4157 Lavon Reynolds Ln · Kathleen, FL
Flood risk 1/10 · Minimal
- FEMA flood zone
- X (unshaded)
- Chance of flooding over 30 yrs
- 0.0%
- Est. flood insurance / yr
- $507 – $1,088
Fire risk 5/10 · Moderate
- Est. fire insurance / yr
- $947 – $1,759
Heat risk 8/10 · Major
- Hot days now (above 108°F)
- 7 days/yr
- Hot days in 30 yrs
- 24 days/yr
Wind risk 9/10 · Severe
- Chance of severe wind over 30 yrs
- 99.0%
Air-quality risk 2/10 · Minimal
- Unhealthy air days now
- 1 days/yr
- Unhealthy air days in 30 yrs
- 1 days/yr
Risk factors via First Street. Map © Google.
Why this score? — see what drove the D grade
The composite is a weighted blend of 9 inputs, each scored 0–100. Each bar is that input's sub-score; the figure is the points it added to the 100-point composite (weight × sub-score).
- Cash flow +14.8/30.0
- ARV discount +7.5/15.0
- DSCR +4.5/10.0
- Schools +3.5/10.0
- Rent growth +3.2/5.0
- Livability +3.1/5.0
- 1% rule +2.9/10.0
- Condition / age +2.5/5.0
- Appreciation +0.0/10.0
$220,000
🖨 Deal sheet 📄 Offer letter ✓ Due diligence
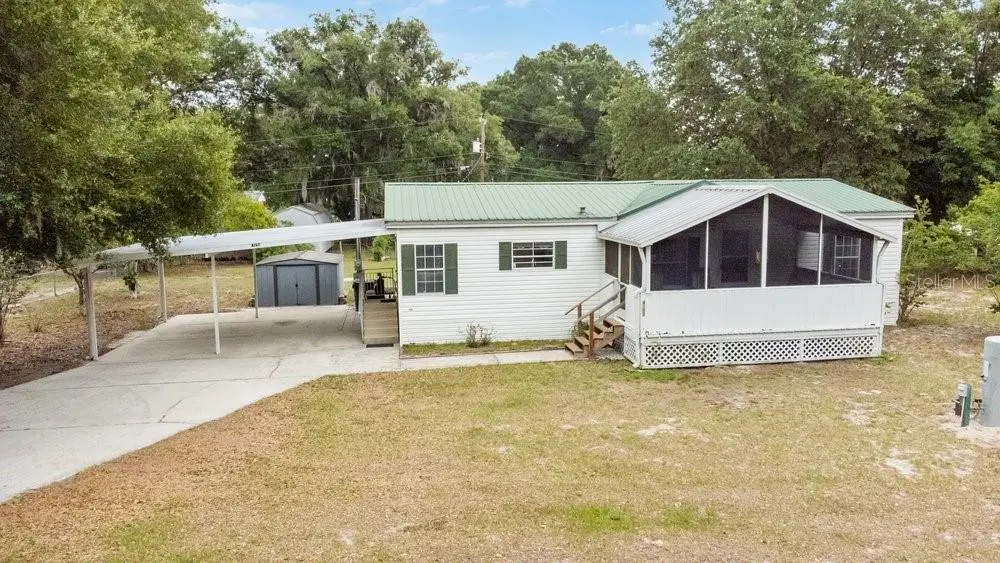
Listing remarks
Welcome to your own private slice of country charm in Lakeland! Tucked away down a quiet dirt road, this property sits on over half an acre of beautifully treed, fully fenced land offering peace, privacy, and room to spread out. A very large screened-in front porch invites you to relax and enjoy the serene surroundings, while the durable metal roof adds both character and long-lasting value. With gorgeous mature trees, plenty of outdoor space, and the tranquil feel of old Florida living, this property offers the perfect escape while still being conveniently close to town. There is a 2 space attached carport with covered staircase into the home. Walk through the front door into the open livi
Key facts
- Over half an acre
- Durable metal roof
- Fully fenced land
Tags
Property features AI
Finance
- Other: Property is homesteaded; Lot approximately 0.55 acre (dirt road access); Unfurnished; No lease restrictions; Virtual tour available
Exterior
- Parking: Carport with 2 spaces
- Utilities: Well water; Septic tank; Broadband/High-speed internet available; Cable available
- Home design: Manufactured double-wide home; One story; Faces west
- Construction: Vinyl siding; Metal roof; Other foundation
- Exterior features: Front porch (screened); Chain link fence; Shed(s)
Interior
- Kitchen: Dishwasher; Disposal; Microwave; Range; Refrigerator
- Bedrooms: 3 bedrooms
- Bathrooms: 2 full bathrooms
- Heating & cooling: Central heating; Central air conditioning
- Interior features: Ceiling fans; Eat-in kitchen; High ceilings; Window treatments
- Laundry & utility: Inside laundry; Washer; Dryer
Neighborhood map
What this means for you Summary
Snapshot
- This is a 3-bed/2.0-bath manufactured listed at $220k.
Deal economics
- At list price, monthly cash flow is $61 ($730/yr) — positive.
- The deal already cash-flows at list — no discount required.
- To meet the 1% rule (rent ≥ 1% of price), the offer needs to be $174k (20.9% below list).
- Recommended offer: $174k (20.9% below list) — sets the bar for 1% rule.
Location & tenants
- Location reads 62/100 on livability (#752 in FL) — a middle-class / working-renter tenant base. Strengths: cost of living A+, housing A+; Watch: employment D+, amenities F, commute F.
- Polk (suburban): math 39% / reading 43% proficiency, ranked #62 of 73 in FL (top 85%) — families likely to look elsewhere, expect single-tenant / working-renter base with shorter leases.
- Zoned schools: Kathleen Elementary School (math 38% / reading 33%, grade F, #1,684 of 2,144 statewide, top 79%, 489 students, 63% FRL); Kathleen Senior High School (math 19% / reading 31%, grade F, #501 of 667 statewide, top 75%, 2,051 students, 59% FRL) — zoned schools at 61% FRL track the district average.
- Market conditions: Rents rising (+2.8%/yr); 504 active listings in the ZIP; 5 comparable units currently listed for rent nearby; rentals leasing fast (median 3d on market — plan ~1-2 weeks tenant-placement turnaround); 10,384 units permitted in Polk County in 2024 (1,716 in 5+ unit buildings).
Forward outlook
- Local home prices are declining (-3.0%/yr); year-one equity from $2k of loan paydown is wiped out by about $7k of value loss. Plan a longer hold.
- Polk County population projected at +33% by 2050 — long-run rental-demand tailwind backs the buy-and-hold thesis.
Negotiation context
- Only 8 days on market — expect competitive offers; lowballing is unlikely to land.
- Current owner paid $72k; list at $220k implies a 204% gain — meaningful room to come down on a strong offer.
Risks & watch-outs
- Climate carrying-cost: severe wind risk, 99% chance of damaging wind over 30y; moderate wildfire risk; extreme-heat days projected 7→24/yr by 2055 (HVAC capex compounding) — expect insurance premiums to compound above CPI over the hold.
Questions for the listing agent
- Is there a deadline driving the sale (1031 exchange, divorce, estate, relocation)? That informs how much negotiation room exists.
- Schools are F-rated, which usually means shorter tenancies and higher turnover. Who's the typical renter profile here, and what's been the actual vacancy rate?
- The area grade is low — what's the realistic commute time and amenity access for the typical tenant pool here? Any planned neighborhood developments (good or bad) we should know about?
- What's the average days-on-market for RENTAL listings here right now (not sales)? A rising rental-DOM trend means longer vacancies and softer asking-rent achievability than the comps imply.
- What's the recent tenant-quality profile in this submarket — average credit score on applications, eviction rate, late-payment / NSF rate, and stable-employment percentage? A property-management company in the area should have these aggregated.
- How much new for-sale + rental construction is in the pipeline within 1–3 miles? Heavy new supply typically softens prices + rents 12–24 months out; constrained supply supports both.
Investment metrics
- 1% rule
- 0.79% ✗
- Cap rate
- 6.62%
- Cash-on-cash
- 1.19%
- DSCR
- 1.05
- GRM
- 10.5
CMA / ARV
No comps found within radius.
Projected returns pro-forma
-3.0% appreciation · 2.78% rent growth · sell at horizon
- IRR
- -14.7%
- Equity multiple
- 0.48×
- Total profit
- $-32,260
- Equity at exit
- $32,803
- IRR
- -6.4%
- Equity multiple
- 0.59×
- Total profit
- $-25,083
- Equity at exit
- $19,022
Cash invested: $61,600 (down + closing). Projections, not guarantees.
Landlord ↔ Tenant lean methodology
- Overall (STATE)
- 87 Strongly Landlord-Friendly
- State Florida
- 87 Strongly Landlord-Friendly · R+3
- County
- — inherits STATE
- City
- — inherits STATE
ZIP-level market 33810
- Rents YoY
- 2.8%
- Active inventory
- 504
- Price-to-rent
- 10.5×
Monthly cashflow live
- Estimated rent
- $1,739 high interval (Pro) →
- Mortgage (P&I)
- −$1,154
- Tax from tax record
- −$68 /mo · $815/yr
- Insurance
- −$92
- HOA
- −$0
- Vacancy / Maint / Mgmt
- −$365
- Net cashflow
- $61
Break-even live
UW: 25.0% down · 7.5% · 30yr · 1.5% tax · 5.0% vac · 8.0% maint · 8.0% mgmt
Financing live
Cash to close
- Down payment
- $55,000
- Closing costs
- $6,600
- Reserves months
- —
- Total cash needed
- —
Loan-product check · same deal, 3 products live
Conventional
25% down · 7.5% · 30yr
- Down + closing
- —
- Monthly P&I
- —
- Monthly cashflow
- —
- DSCR
- —
- Eligible?
- —
Personal DTI + credit; lowest rate.
DSCR
20% down · 8.5% · 30yr
- Down + closing
- —
- Monthly P&I
- —
- Monthly cashflow
- —
- DSCR
- —
- Eligible?
- —
No personal income docs; deal must DSCR.
Hard money
10% down · 12.0% · 12mo
- Down + closing
- —
- Monthly P&I
- —
- Monthly cashflow
- —
- DSCR
- —
- Eligible?
- —
Short-term bridge; refi at stabilization.
Rent comps 5 comps
| Address | Beds | Baths | Sqft | Rent | $/sqft | DOM | Units | Dist |
|---|---|---|---|---|---|---|---|---|
| 3276 Mount Tabor Rd Lot 28 Lakeland, FL | 2.0 | 2.0 | 896 | $1,295 | $1.45 | 2d | 1 | 0.67mi |
| 3276 Mount Tabor Rd Lakeland, FL | 3.0 | 2.0 | 896 | $1,195 | $1.33 | 2d | 1 | 0.67mi |
| 5138 Rollinglen Loop W Lakeland, FL | 3.0 | 2.0 | 924 | $1,400 | $1.52 | 3d | 1 | 1.16mi |
| 3230 J and J Manor Rd Lakeland, FL | 4.0 | 2.0 | 1056 | $1,700 | $1.61 | 3d | 1 | 1.45mi |
| 3205 J and J Manor Rd Lakeland, FL | 3.0 | 2.0 | 1568 | $1,900 | $1.21 | 3d | 1 | 1.47mi |
Listing history 4 events
-
2026-05-22$220,000 Active
-
2000-03-20soldstatus $72,332
-
1999-01-08soldstatus $15,000
-
1995-08-21soldstatus $16,000
ⓘ Source: listings_history table (triggers on properties + properties_extension) + one-shot
backfill from property_details.listing_events for pre-trigger history.
Tax reassessment forecast FL · Resets to sale price
- Current annual tax
- $815 · $68/mo
- Projected year-2 tax
- $1,826 · $152/mo
- Expected delta
- +$1,011/yr (+$84/mo · 124.0%)
ⓘ Screening estimate from a state-policy table — verify with the county assessor before closing.
Climate risk First Street
- Flood 1/10 Low FEMA zone X (unshaded) · 0% chance over 30 yrs
- Wildfire 5/10 Major
- Heat 8/10 Severe 7 d/yr ≥108°F today · 24 d/yr by 30 yrs out
- Wind 9/10 Extreme 99% chance of damaging wind over 30 yrs
- Air quality 2/10 Low 1 unhealthy d/yr today · 1 by 30 yrs out
Nearby sold comps map
Loading sold comps map…
Walkable amenities ~0.75 mi
Loading nearby amenities…
Taxation est. · year 1
- Rental income
- $20,873
- − Mortgage interest
- −$12,323
- − Property taxes
- −$815
- − Insurance
- −$1,100
- − Repairs & maintenance
- −$1,670
- − Management
- −$1,670
- − Depreciation
- −$6,400
- Taxable loss
- −$3,105
- Est. tax savings @ 24.0%
- +$745
- After-tax cash flow
- $1,475/yr
For passive investors: Depreciation is non-cash, so a rental often shows a tax loss while cash-flowing — sheltering income. Rental losses are passive: they offset passive income freely, and up to $25,000/yr can offset ordinary (W-2) income if you actively participate and your MAGI is under $100k (phasing out to $0 by $150k); unused losses carry forward. On sale, claimed depreciation is recaptured at up to 25%, and gains may owe capital-gains tax (a 1031 exchange can defer both). Figures are a year-1 estimate at your 24.0% rate — not tax advice; consult a CPA.
Schools (NCES district)
- District
- Polk
- NCES district ID
- 1201590
- Math proficiency
- 39% ▼ -11.00%
- Reading proficiency
- 43% ▼ -4.00%
- Median HH income
- $43,979
- Composite
- 34.74/100
- National rank
- #5132
- State rank
- #62 of 73 in FL
Livability — Kathleen
- Score
- 62/100
- State rank
- #752
- US rank
- #16450
Category grades
Schools grade is shown separately in the Schools card above.
Census & demographics
- County
- Polk County · 740,051 people
- City population
- 52,734
- Metro
- Lakeland-Winter Haven, FL
- Population (ZIP)
- 55,137
- Household income
- $69,986
- Rent vs Own
- Severe rent burden
- 1208.0
Population outlook (Polk County) Hauer SSP2
- Today (2025)
- 752,975 people
- By 2030
- 804,621 · +6.9%
- By 2040
- 906,117 · +20.3%
- By 2050
- 1,000,476 · +32.9%
- By 2075
- 1,197,520 · +59.0%
- By 2100
- 1,271,518 · +68.9%
Race, ethnicity, and origin ACS 2023
- Neighborhood character
- Diverse neighborhood (Simpson 0.58)
- Race & ethnicity
- White 59% Hispanic / Latino 23% Black 12% Two or more races 10% Asian 2%
- Hispanic origin (detail)
- Mexican 5% Puerto Rican 9% Cuban 5%
- Common ancestry
- Italian 2% Lithuanian 2% Slovak 1%
- Foreign-born
- 9% · Canada, Jamaica
- Languages at home
- 79% English-only · Spanish 17% French/Haitian/Cajun 1% Tagalog/Filipino 1%
Political lean MEDSL · Polk
- 2024 margin
- Strong R (+20.7) · D 39.2% · R 59.9%
- 2008→2024 swing
- -14.6pp toward R · 2008: -6.1pp · 2024: -20.7pp
- All cycles
- 2024: R+20.7 2020: R+14.4 2016: R+14.1 2012: R+6.8 2008: R+6.1
Not yet ingested
- Civics
- —
Market trends
- HPI YoY
- ▼ -194.94%
- Current HPI
- 320.7366
- Rent YoY
- ▲ 2.78%
- Metro
- Lakeland-Winter Haven, FL
- State GDP YoY
- ▲ 3.28%
- F500 in state
- 36
Industry mix (Fortune 500 HQ in FL)
| Industry | F500 HQs | Revenue |
|---|---|---|
| Industrial Technology | 2 | $29B |
|
||
| Insurance | 2 | $17B |
|
||
| Retail | 1 | $60B |
|
||
| Technology Distribution | 1 | $58B |
|
||
| Homebuilding | 1 | $35B |
|
||
| Technology Manufacturing | 1 | $35B |
|
||
Price history
+1275.0% since first listed4 events — show timeline
- 2026-05-22 Listed $220,000 Stellar MLS as Distributed by MLS Grid
- 2000-03-20 Sold (Public Records) $72,332 Public Records
- 1999-01-08 Sold (Public Records) $15,000 Public Records
- 1995-08-21 Sold (Public Records) $16,000 Public Records
Property tax history
+14.8%/yrLatest (2025): $815 · +43.8% YoY. Source: county tax records.
Cash-flow waterfall
monthlySold comps — $/sqft
last 12 mo · ≤1 miLoading sold comps…