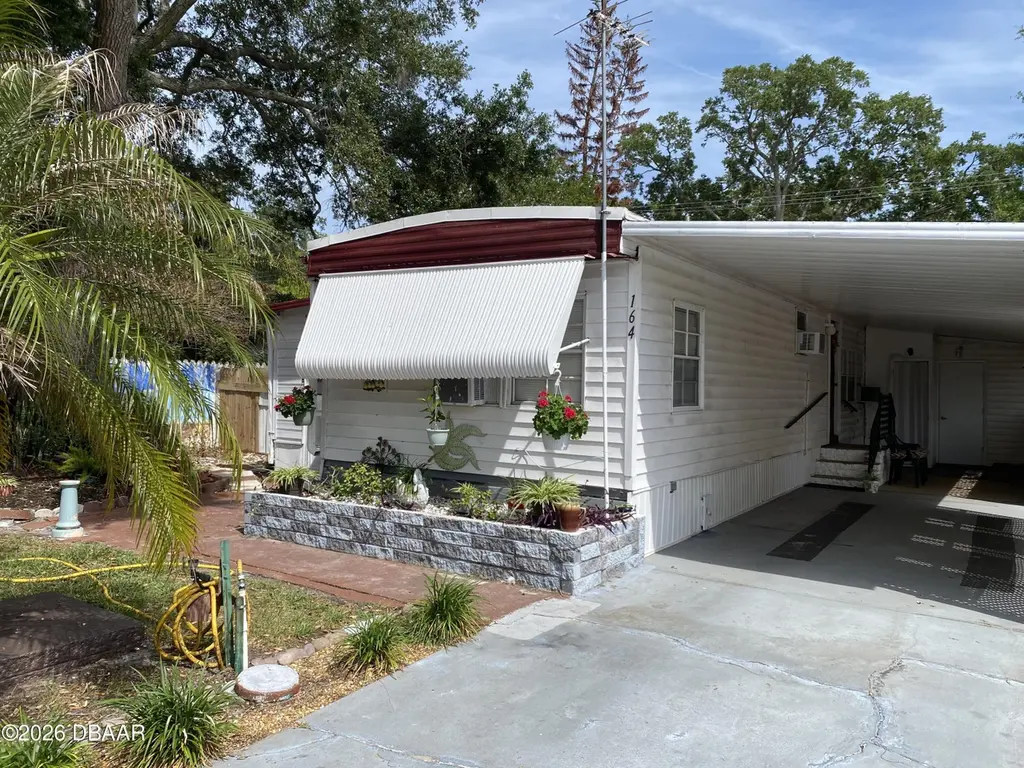
164 Iron Gate Cir · Port Orange, FL
Flood risk 1/10 · Minimal
- FEMA flood zone
- X (unshaded)
- Chance of flooding over 30 yrs
- 0.0%
- Est. flood insurance / yr
- $507 – $1,088
Fire risk 1/10 · Minimal
- Est. fire insurance / yr
- $947 – $1,759
Heat risk 9/10 · Severe
- Hot days now (above 105°F)
- 7 days/yr
- Hot days in 30 yrs
- 20 days/yr
Wind risk 10/10 · Severe
- Chance of severe wind over 30 yrs
- 99.0%
Air-quality risk 2/10 · Minimal
- Unhealthy air days now
- 1 days/yr
- Unhealthy air days in 30 yrs
- 1 days/yr
Risk factors via First Street. Map © Google.
Why this score? — see what drove the C grade
The composite is a weighted blend of 9 inputs, each scored 0–100. Each bar is that input's sub-score; the figure is the points it added to the 100-point composite (weight × sub-score).
- Cash flow +23.6/30.0
- DSCR +7.6/10.0
- ARV discount +7.5/15.0
- 1% rule +6.0/10.0
- Livability +4.0/5.0
- Schools +3.9/10.0
- Condition / age +2.5/5.0
- Rent growth +1.8/5.0
- Appreciation +0.0/10.0
$139,000
🖨 Deal sheet (PDF) 📄 Offer letter ✓ Due diligence
Listing remarks MLS
Perfect for Full-Time living or Snowbird. This home is on it's own land so NO lot rent here. Lots of updates over the last yr. New tub/shower enclosure. Hardwood floors, and cabinets have been updated over the last few years. Carport, fenced backyard. Ready for new owners to enjoy. Could use a little more updating but priced to sell.
Key facts
- 4,791 sq ft lot
- 2 parking spots
- Built 1973
Neighborhood map
What this means for you Summary
Snapshot
- This is a 2-bed/1.5-bath manufactured listed at $139k.
Deal economics
- At list price, monthly cash flow is $262 ($3k/yr) — positive.
- The deal already cash-flows at list — no discount required.
- Meets the 1% rule at list price ($2k rent vs $139k).
- Recommended offer: $126k (9.0% below list) — sets the bar for market timing.
Location & tenants
- Location reads 80/100 on livability (#131 in FL, #1,957 nationally) — a professional / high-income tenant draw. Strengths: housing A+, health & safety A+, cost of living A; Watch: amenities D+, commute D+.
- Volusia (suburban): math 44% / reading 49% proficiency, ranked #47 of 73 in FL (top 64%) — families likely to look elsewhere, expect single-tenant / working-renter base with shorter leases.
- Zoned schools: Sugar Mill Elementary School (math 59% / reading 58%, grade B-, #735 of 2,144 statewide, top 35%, 623 students, 64% FRL); Silver Sands Middle School (math 50% / reading 52%, grade C, #237 of 571 statewide, top 43%, 1,165 students, 54% FRL); Atlantic High School (math 24% / reading 46%, grade F, #379 of 667 statewide, top 58%, 1,266 students, 52% FRL).
- Market conditions: Rents soft (-2.7%/yr); 248 active listings in the ZIP; 9 comparable units currently listed for rent nearby; rentals leasing fast (median 13d on market — plan ~1-2 weeks tenant-placement turnaround); 3,402 units permitted in Volusia County in 2024 (681 in 5+ unit buildings).
Forward outlook
- Local home prices are declining (-3.0%/yr); year-one equity from $961 of loan paydown is wiped out by about $4k of value loss. Plan a longer hold.
- Volusia County population projected at +19% by 2050 — long-run rental-demand tailwind backs the buy-and-hold thesis.
Negotiation context
- It's been on market 110 days — a 9% lower offer ($126k) is reasonable based on typical stale-listing flexibility.
- 4 sale attempts since 21y ago with the ask held roughly flat each time — persistent listings suggest the price (not the market) is what's stuck; bring a comps-based counter.
- Current owner paid $65k; list at $139k implies a 113% gain — meaningful room to come down on a strong offer.
Risks & watch-outs
- Climate carrying-cost: severe wind risk, 99% chance of damaging wind over 30y; extreme-heat days projected 7→20/yr by 2055 (HVAC capex compounding) — expect insurance premiums to compound above CPI over the hold.
Questions for the listing agent
- It's been on market 110 days. Have you received any prior offers? Is the seller open to a 9% concession, seller financing, or rate buy-down credit?
- Built in 1973 — when were the roof, HVAC, electrical panel, plumbing, and water heater last replaced?
- Why hasn't it sold? Are there any deal-killer items the seller is aware of (foundation, flood, title, zoning, code violations)?
- Is there a deadline driving the sale (1031 exchange, divorce, estate, relocation)? That informs how much negotiation room exists.
- Schools are B-rated — typically a magnet for longer-tenancy family renters. What's the average tenant stay here, and is there a school-zone premium baked into asking?
- What's the average days-on-market for RENTAL listings here right now (not sales)? A rising rental-DOM trend means longer vacancies and softer asking-rent achievability than the comps imply.
- What's the recent tenant-quality profile in this submarket — average credit score on applications, eviction rate, late-payment / NSF rate, and stable-employment percentage? A property-management company in the area should have these aggregated.
- How much new for-sale + rental construction is in the pipeline within 1–3 miles? Heavy new supply typically softens prices + rents 12–24 months out; constrained supply supports both.
Investment metrics
- 1% rule
- 1.10% ✓
- Cap rate
- 8.56%
- Cash-on-cash
- 8.09%
- DSCR
- 1.36
- GRM
- 7.6
CMA / ARV
No comps found within radius.
Projected returns pro-forma
-3.0% appreciation · 0.0% rent growth · sell at horizon
- IRR
- -7.4%
- Equity multiple
- 0.74×
- Total profit
- $-10,269
- Equity at exit
- $20,725
- IRR
- -2.0%
- Equity multiple
- 0.88×
- Total profit
- $-4,630
- Equity at exit
- $12,018
Cash invested: $38,920 (down + closing). Projections, not guarantees.
Landlord ↔ Tenant lean methodology
- Overall (STATE)
- 87 Strongly Landlord-Friendly
- State Florida
- 87 Strongly Landlord-Friendly · R+3
- County
- — inherits STATE
- City
- — inherits STATE
ZIP-level market 32129
- Rents YoY
- -2.7%
- Active inventory
- 248
- Price-to-rent
- 7.6×
Monthly cashflow live
- Estimated rent
- $1,522 high interval (Pro) →
- Mortgage (P&I)
- −$729
- Tax from tax record
- −$154 /mo · $1,842/yr
- Insurance
- −$58
- HOA
- −$0
- Vacancy / Maint / Mgmt
- −$320
- Net cashflow
- $262
Break-even live
Sensitivity live
| Price | -10% $341 | -5% $302 | +0% $262 | +5% $223 | +10% $184 |
|---|---|---|---|---|---|
| Rent | -10% $142 | -5% $202 | +0% $262 | +5% $322 | +10% $383 |
| Rate | -1.0pp $332 | -0.5pp $298 | base $262 | +0.5pp $226 | +1.0pp $190 |
UW: 25.0% down · 7.5% · 30yr · 1.5% tax · 5.0% vac · 8.0% maint · 8.0% mgmt
Financing live
Cash to close
- Down payment
- $34,750
- Closing costs
- $4,170
- Reserves months
- —
- Total cash needed
- —
Loan-product check · same deal, 3 products live
Conventional
25% down · 7.5% · 30yr
- Down + closing
- —
- Monthly P&I
- —
- Monthly cashflow
- —
- DSCR
- —
- Eligible?
- —
Personal DTI + credit; lowest rate.
DSCR
20% down · 8.5% · 30yr
- Down + closing
- —
- Monthly P&I
- —
- Monthly cashflow
- —
- DSCR
- —
- Eligible?
- —
No personal income docs; deal must DSCR.
Hard money
10% down · 12.0% · 12mo
- Down + closing
- —
- Monthly P&I
- —
- Monthly cashflow
- —
- DSCR
- —
- Eligible?
- —
Short-term bridge; refi at stabilization.
Rent comps 9 comps
| Address | Beds | Baths | Sqft | Rent | $/sqft | DOM | Units | Dist |
|---|---|---|---|---|---|---|---|---|
| 1152 Old Hammock Rd Unit 1 Port Orange, FL | 1.0 | 1.0 | 600 | $1,295 | $2.16 | 25d | 1 | 0.27mi |
| 1025 Eagle Lake Trl Port Orange, FL | 1.0 | 1.0 | 576 | $1,185 | $2.06 | 25d | 2 | 0.51mi |
| 958 Village Trl Port Orange, FL | 1.0–2.0 | 1.0–2.0 | 775 | $1,455 | $1.88 | 13d | 12 | 0.85mi |
| 4801 Clyde Morris Blvd Port Orange, FL | 1.0 | 1.0 | 576 | $1,376 | $2.39 | 25d | 5 | 1.07mi |
| 3835 Clyde Morris Blvd Port Orange, FL | 1.0–3.0 | 1.0–2.0 | 1013 | $2,012 | $1.99 | 13d | 17 | 1.08mi |
| 1270 Reed Canal Rd Port Orange, FL | 1.0–3.0 | 1.0–2.0 | 1001 | $1,746 | $1.74 | 13d | 29 | 1.35mi |
| 1645 Dunlawton Ave Port Orange, FL | 1.0–2.0 | 1.0–2.0 | 894 | $1,593 | $1.78 | 13d | 26 | 1.38mi |
| 3900 Yorktowne Blvd Port Orange, FL | 1.0–3.0 | 1.0–2.0 | 1031 | $1,606 | $1.56 | 13d | 19 | 1.40mi |
| 1401 Reed Canal Rd Port Orange, FL | 1.0–3.0 | 1.0–2.0 | 1045 | $1,856 | $1.78 | 16d | 25 | 1.41mi |
Listing history 25 events
-
2026-06-22days on market $139,000 Active 110 DOM
-
2026-06-18days on market $139,000 Active 107 DOM
-
2026-06-17days on market $139,000 Active 106 DOM
-
2026-06-16days on market $139,000 Active 105 DOM
-
2026-06-15days on market $139,000 Active 104 DOM
-
2026-06-14days on market $139,000 Active 102 DOM
-
2026-06-10days on market $139,000 Active 99 DOM
-
2026-06-09days on market $139,000 Active 98 DOM
-
2026-06-08days on market $139,000 Active 97 DOM
-
2026-06-07days on market $139,000 Active 96 DOM
-
2026-06-05days on market $139,000 Active 93 DOM
-
2026-06-03days on market $139,000 Active 92 DOM
-
2026-06-03days on market $139,000 Active 91 DOM
-
2026-06-01days on market $139,000 Active 90 DOM
-
2026-05-31days on market $139,000 Active 89 DOM
-
2026-05-31days on market $139,000 Active 88 DOM
-
2026-03-03$139,000 Active 335-char remark
Show marketing remark (335 chars)
Perfect for Full-Time living or Snowbird. This home is on it's own land so NO lot rent here. Lots of updates over the last yr. New tub/shower enclosure. Hardwood floors, and cabinets have been updated over the last few years. Carport, fenced backyard. Ready for new owners to enjoy. Could use a little more updating but priced to sell.
-
2013-10-30$41,500
-
2011-07-23$41,500
-
2005-10-04soldstatus $65,250
-
2005-09-26soldstatus $65,250
-
2005-08-10$74,900
-
1995-03-13soldstatus $25,000
-
1988-01-01soldstatus $8,500
-
1976-10-01soldstatus $352,000
ⓘ Source: listings_history table (triggers on properties + properties_extension) + one-shot
backfill from property_details.listing_events for pre-trigger history.
Tax reassessment forecast FL · Resets to sale price
- Current annual tax
- $1,842 · $154/mo
- Projected year-2 tax
- $1,842 · $154/mo
- Expected delta
- $0/yr ($0/mo · 0.0%)
ⓘ Screening estimate from a state-policy table — verify with the county assessor before closing.
Climate risk First Street
- Flood 1/10 Low FEMA zone X (unshaded) · 0% chance over 30 yrs
- Wildfire 1/10 Low
- Heat 9/10 Extreme 7 d/yr ≥105°F today · 20 d/yr by 30 yrs out
- Wind 10/10 Extreme 99% chance of damaging wind over 30 yrs
- Air quality 2/10 Low 1 unhealthy d/yr today · 1 by 30 yrs out
Nearby sold comps map
Loading sold comps map…
Walkable amenities ~0.75 mi
Loading nearby amenities…
Taxation est. · year 1
- Rental income
- $18,268
- − Mortgage interest
- −$7,786
- − Property taxes
- −$1,842
- − Insurance
- −$695
- − Repairs & maintenance
- −$1,461
- − Management
- −$1,461
- − Depreciation
- −$4,044
- Taxable income
- $978
- Est. tax owed @ 24.0%
- −$235
- After-tax cash flow
- $2,913/yr
For passive investors: Depreciation is non-cash, so a rental often shows a tax loss while cash-flowing — sheltering income. Rental losses are passive: they offset passive income freely, and up to $25,000/yr can offset ordinary (W-2) income if you actively participate and your MAGI is under $100k (phasing out to $0 by $150k); unused losses carry forward. On sale, claimed depreciation is recaptured at up to 25%, and gains may owe capital-gains tax (a 1031 exchange can defer both). Figures are a year-1 estimate at your 24.0% rate — not tax advice; consult a CPA.
Schools (NCES district)
- District
- Volusia
- NCES district ID
- 1201920
- Math proficiency
- 44% ▼ -9.00%
- Reading proficiency
- 49% ▼ -3.00%
- Median HH income
- $42,946
- Composite
- 39.2/100
- National rank
- #4019
- State rank
- #47 of 73 in FL
Livability — Port Orange
- Score
- 80/100
- State rank
- #131
- US rank
- #1957
Category grades
Schools grade is shown separately in the Schools card above.
Census & demographics
- Census place
- Port Orange, FL
- County
- Volusia County · 556,871 people
- City population
- 75,051
- Metro
- Deltona-Daytona Beach-Ormond Beach, FL
- Population (ZIP)
- 23,195
- Household income
- $67,924
- Rent vs Own
- Severe rent burden
- 602.0
Population outlook (Volusia County) Hauer SSP2
- Today (2025)
- 572,749 people
- By 2030
- 598,695 · +4.5%
- By 2040
- 644,880 · +12.6%
- By 2050
- 681,451 · +19.0%
- By 2075
- 759,957 · +32.7%
- By 2100
- 778,902 · +36.0%
Race, ethnicity, and origin ACS 2023
- Neighborhood character
- Predominantly White (80%)
- Race & ethnicity
- White 80% Hispanic / Latino 7% Two or more races 6% Black 6% Asian 3%
- Hispanic origin (detail)
- Mexican 2% Puerto Rican 3%
- Common ancestry
- Lithuanian 4% Iranian 3% Romanian 3%
- Foreign-born
- 9% · Canada, South Korea, China
- Languages at home
- 87% English-only · Spanish 4% German/W. Germanic 3% Arabic 1%
Political lean MEDSL · Volusia
- 2024 margin
- Strong R (+21.8) · D 38.7% · R 60.5%
- 2008→2024 swing
- -27.4pp toward R · 2008: 5.7pp · 2024: -21.8pp
- All cycles
- 2024: R+21.8 2020: R+14.1 2016: R+13.1 2012: R+1.2 2008: D+5.7
Not yet ingested
- Civics
- —
Market trends
- HPI YoY
- ▼ -234.13%
- Current HPI
- 310.0285
- Rent YoY
- ▼ -2.71%
- Metro
- Deltona-Daytona Beach-Ormond Beach, FL
- State GDP YoY
- ▲ 3.28%
- F500 in state
- 36
Industry mix (Fortune 500 HQ in FL)
| Industry | F500 HQs | Revenue |
|---|---|---|
| Industrial Technology | 2 | $29B |
|
||
| Insurance | 2 | $17B |
|
||
| Retail | 1 | $60B |
|
||
| Technology Distribution | 1 | $58B |
|
||
| Homebuilding | 1 | $35B |
|
||
| Technology Manufacturing | 1 | $35B |
|
||
Price history
-60.5% since first listed9 events — show timeline
- 2026-03-03 Listed $139,000 Daytona MLS
- 2013-10-30 Listed $41,500 Daytona MLS
- 2011-07-23 Listed $41,500 Daytona MLS
- 2005-10-04 Sold (Public Records) $65,250 Public Records
- 2005-09-26 Sold (MLS) $65,250 Daytona MLS
- 2005-08-10 Listed $74,900 Daytona MLS
- 1995-03-13 Sold (Public Records) $25,000 Public Records
- 1988-01-01 Sold (Public Records) $8,500 Public Records
- 1976-10-01 Sold (Public Records) $352,000 Public Records
Property tax history
+30.4%/yrLatest (2025): $1,842 · +1068.0% YoY. Source: county tax records.
Cash-flow waterfall
monthlySold comps — $/sqft
last 12 mo · ≤1 miLoading sold comps…