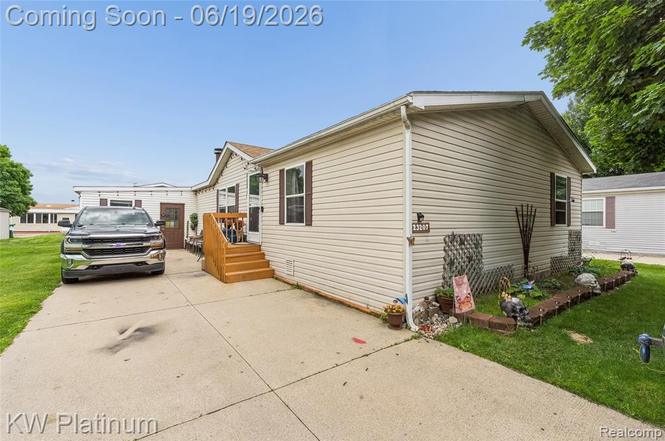
23207 Fountain Dr · Mount Clemens, MI
Flood risk No data
- FEMA flood zone
- —
- Chance of flooding over 30 yrs
- —
- Est. flood insurance / yr
- —
Fire risk No data
- Est. fire insurance / yr
- —
Heat risk No data
- Hot days now (above threshold)
- —
- Hot days in 30 yrs
- —
Wind risk No data
- Chance of severe wind over 30 yrs
- —
Air-quality risk No data
- Unhealthy air days now
- —
- Unhealthy air days in 30 yrs
- —
Risk factors via First Street. Map © Google.
Why this score? — see what drove the B- grade
The composite is a weighted blend of 9 inputs, each scored 0–100. Each bar is that input's sub-score; the figure is the points it added to the 100-point composite (weight × sub-score).
- Cash flow +30.0/30.0
- 1% rule +10.0/10.0
- DSCR +10.0/10.0
- ARV discount +7.5/15.0
- Livability +3.9/5.0
- Rent growth +3.3/5.0
- Condition / age +2.8/5.0
- Schools +0.6/10.0
- Appreciation +0.0/10.0
$74,900
🖨 Deal sheet (PDF) 📄 Offer letter ✓ Due diligence
Listing remarks MLS
Looking to downsize and affordable living? Need one level? Check out this cute 3 bed 2 bath home. Home has been well maintained throughout the year. Crawl has been encapsulated and the bigger items such as the furnace and A/C are newer. Come check her out. Conveniently located in Clinton Township.
Key facts
- Encapsulated crawl
- Newer furnace
- Newer a/c
Tags
Property features AI
Exterior
- Utilities: Natural gas heating fuel; Public water
- Home design: Residential single-story home; Built in 1978
- Construction: Crawl foundation
- Exterior features: Vinyl siding; Private road access; Frontage approximately 20'
Interior
- Kitchen: Range/Oven; Refrigerator; Dishwasher
- Bedrooms: Three bedrooms on entry level (Bedroom sizes: one about 12', one about 10')
- Bathrooms: Two full bathrooms on entry level
- Heating & cooling: Forced air heating
- Interior features: Living room fireplace; Total of 5 rooms
- Laundry & utility: Washer; Dryer
Neighborhood map
What this means for you Summary
Snapshot
- This is a 3-bed/2.0-bath single-family listed at $75k. Condition is rated average.
Deal economics
- At list price, monthly cash flow is $703 ($8k/yr) — positive.
- The deal already cash-flows at list — no discount required.
- Meets the 1% rule at list price ($2k rent vs $75k).
- Cap rate 17.6% vs local median 3.0% in Mount Clemens — top-decile yield for the area; either an underpriced asset or a hidden risk that comps aren't pricing in. Stress-test before assuming the spread holds.
Location & tenants
- Location reads 77/100 on livability (#120 in MI, #2,918 nationally) — a middle-class / working-renter tenant base. Strengths: commute A+, cost of living A+, housing A+; Watch: schools D+, crime D+, amenities D+.
- Mount Clemens Community School District (suburban): math 4% / reading 11% proficiency, ranked #532 of 540 in MI (top 98%) — low school quality limits family demand, transient renter base, plan for 1-2y turnover; 80% free/reduced lunch — lower-income household profile, screen leases tightly.
- Market conditions: Rents rising (+3.1%/yr); 117 active listings in the ZIP; 10 comparable units currently listed for rent nearby; rentals leasing fast (median 6d on market — plan ~1-2 weeks tenant-placement turnaround); 1,321 units permitted in Macomb County in 2024 (86 in 5+ unit buildings).
Forward outlook
- Local home prices are declining (-3.0%/yr); year-one equity from $518 of loan paydown is wiped out by about $2k of value loss. Plan a longer hold.
- Macomb County population projected at +9% by 2050 — modest demand growth; plan on rents tracking national, not racing it.
- At projected returns (-3.0% appreciation + 3.1% rent growth), your $21k cash investment doubles in ~3 years — after that, you're playing with house money.
Negotiation context
- Only 3 days on market — expect competitive offers; lowballing is unlikely to land.
- 2 sale attempts with the ask held roughly flat each time — persistent listings suggest the price (not the market) is what's stuck; bring a comps-based counter.
Questions for the listing agent
- Built in 1978 — when were the roof, HVAC, electrical panel, plumbing, and water heater last replaced?
- Is there a deadline driving the sale (1031 exchange, divorce, estate, relocation)? That informs how much negotiation room exists.
- Schools are D-rated, which usually means shorter tenancies and higher turnover. Who's the typical renter profile here, and what's been the actual vacancy rate?
- Crime grade is D in this area — have there been break-ins, vandalism, or insurance claims at this property in the last 3 years? What carrier currently insures it and at what premium?
- What's the average days-on-market for RENTAL listings here right now (not sales)? A rising rental-DOM trend means longer vacancies and softer asking-rent achievability than the comps imply.
- What's the recent tenant-quality profile in this submarket — average credit score on applications, eviction rate, late-payment / NSF rate, and stable-employment percentage? A property-management company in the area should have these aggregated.
- How much new for-sale + rental construction is in the pipeline within 1–3 miles? Heavy new supply typically softens prices + rents 12–24 months out; constrained supply supports both.
Investment metrics
- 1% rule
- 2.06% ✓
- Cap rate
- 17.55%
- Cash-on-cash
- 40.21%
- DSCR
- 2.79
- GRM
- 4.0
CMA / ARV
- ARV (on-the-fly)
- $192,192
- Comps found
- 12
Show comp detail 12 sales within ~0.75 mi
| Address | Dist | Beds/Ba | Sqft | Sold | Price | $/sf | Match |
|---|---|---|---|---|---|---|---|
| 23149 Egnew Dr. Dr | 0.30mi | 3/2.0 | 1,456 (0%) | 7mo | $52,000 | $36 | 80 |
| 254 Euclid St | 0.39mi | 4/2.0 (+1) | 1,456 (0%) | 3mo | $192,500 | $132 | 74 |
| 33 Canfield Dr | 0.17mi | 3/1.0 | 1,352 (-7%) | 7mo | $195,000 | $144 | 71 |
| 23353 Easy St | 0.34mi | 3/1.5 | 1,533 (+5%) | 6mo | $289,900 | $189 | 68 |
| 23592 Buckingham St | 0.46mi | 3/1.0 | 1,350 (-7%) | 1mo | $245,000 | $181 | 62 |
| 111 Scott Blvd | 0.39mi | 4/2.0 (+1) | 1,612 (+11%) | 1mo | $265,000 | $164 | 58 |
| 40 Moser Pl | 0.51mi | 4/2.0 (+1) | 1,593 (+9%) | 1mo | $200,000 | $126 | 55 |
| 33 Gallup St | 0.59mi | 3/1.0 | 1,340 (-8%) | 6mo | $170,000 | $127 | 50 |
| 26 Hollywood Ct | 0.54mi | 3/1.0 | 1,260 (-14%) | 1mo | $170,500 | $135 | 48 |
| 263 N Walnut St | 0.73mi | 3/1.5 | 1,325 (-9%) | 3mo | $132,000 | $100 | 47 |
| 217 Jones St | 0.67mi | 3/1.0 | 1,330 (-9%) | 4mo | $141,000 | $106 | 46 |
| 288 Jones St | 0.72mi | 3/1.5 | 1,308 (-10%) | 6mo | $169,900 | $130 | 42 |
Match score weights: distance 35% · size 25% · config 20% · recency 20%. Top-matched comps best support the ARV.
Projected returns pro-forma
-3.0% appreciation · 3.12% rent growth · sell at horizon
- IRR
- 36.8%
- Equity multiple
- 2.57×
- Total profit
- $32,835
- Equity at exit
- $11,168
- IRR
- 43.5%
- Equity multiple
- 5.15×
- Total profit
- $87,092
- Equity at exit
- $6,476
Cash invested: $20,972 (down + closing). Projections, not guarantees.
Landlord ↔ Tenant lean methodology
- Overall (STATE)
- 62 Landlord-Friendly
- State Michigan
- 62 Landlord-Friendly · EVEN
- County
- — inherits STATE
- City
- — inherits STATE
ZIP-level market 48036
- Home prices YoY
- -29.2%
- Rents YoY
- 3.1%
- Active inventory
- 117
- Price-to-rent
- 4.0×
Monthly cashflow live
- Estimated rent
- $1,545 high interval (Pro) →
- Mortgage (P&I)
- −$393
- Tax est. 1.5%
- −$94 /mo · $1,124/yr
- Insurance
- −$31
- HOA
- −$0
- Vacancy / Maint / Mgmt
- −$324
- Net cashflow
- $703
Break-even live
Sensitivity live
| Price | -10% $755 | -5% $729 | +0% $703 | +5% $677 | +10% $651 |
|---|---|---|---|---|---|
| Rent | -10% $581 | -5% $642 | +0% $703 | +5% $764 | +10% $825 |
| Rate | -1.0pp $741 | -0.5pp $722 | base $703 | +0.5pp $683 | +1.0pp $664 |
UW: 25.0% down · 7.5% · 30yr · 1.5% tax · 5.0% vac · 8.0% maint · 8.0% mgmt
Financing live
Cash to close
- Down payment
- $18,725
- Closing costs
- $2,247
- Reserves months
- —
- Total cash needed
- —
Loan-product check · same deal, 3 products live
Conventional
25% down · 7.5% · 30yr
- Down + closing
- —
- Monthly P&I
- —
- Monthly cashflow
- —
- DSCR
- —
- Eligible?
- —
Personal DTI + credit; lowest rate.
DSCR
20% down · 8.5% · 30yr
- Down + closing
- —
- Monthly P&I
- —
- Monthly cashflow
- —
- DSCR
- —
- Eligible?
- —
No personal income docs; deal must DSCR.
Hard money
10% down · 12.0% · 12mo
- Down + closing
- —
- Monthly P&I
- —
- Monthly cashflow
- —
- DSCR
- —
- Eligible?
- —
Short-term bridge; refi at stabilization.
Rent comps 10 comps
| Address | Beds | Baths | Sqft | Rent | $/sqft | DOM | Units | Dist |
|---|---|---|---|---|---|---|---|---|
| 121 Jones St Unit 1 Mt Clemens, MI | 2.0 | 1.0 | 1080 | $1,400 | $1.30 | 0d | 1 | 0.70mi |
| 121 Jones St Unit 2 Mt Clemens, MI | 2.0 | 1.0 | 1050 | $1,600 | $1.52 | 3d | 1 | 0.70mi |
| 40 Ferrin Pl Mount Clemens, MI | 3.0 | 1.0 | 1400 | $1,700 | $1.21 | 0d | 1 | 0.85mi |
| 176 N Christine Cir Unit 1 Mt Clemens, MI | 2.0 | 1.5 | 1020 | $1,300 | $1.27 | 45d | 1 | 0.91mi |
| 133 S Christine Cir Unit 1 Mt Clemens, MI | 3.0 | 1.5 | 1040 | $1,500 | $1.44 | 0d | 1 | 0.94mi |
| 277 N Rose St Mt Clemens, MI | 1.0–2.0 | 1.0 | 755 | $1,434 | $1.90 | 0d | 2 | 1.13mi |
| 15 Washington St Unit 2 Mt Clemens, MI | 3.0 | 1.0 | 1396 | $1,400 | $1.00 | 45d | 1 | 1.16mi |
| 64 Crocker Blvd Mt Clemens, MI | 2.0 | 1.0 | 950 | $1,250 | $1.32 | 45d | 1 | 1.32mi |
| 70 Crocker Blvd Mt Clemens, MI | 2.0 | 1.0 | 950 | $1,400 | $1.47 | 11d | 1 | 1.32mi |
| 42510 Pinehurst Dr Clinton Twp, MI | 3.0 | 2.5 | 1845 | $2,600 | $1.41 | 5d | 1 | 1.36mi |
Listing history 3 events
-
2026-06-21statusdays on market $74,900 Active 3 DOM
-
2026-06-18remarks 298-char remark
-
2026-06-18$74,900 Coming Soon 1 DOM
ⓘ Source: listings_history table (triggers on properties + properties_extension) + one-shot
backfill from property_details.listing_events for pre-trigger history.
Nearby sold comps map
Loading sold comps map…
Walkable amenities ~0.75 mi
Loading nearby amenities…
Taxation est. · year 1
- Rental income
- $18,538
- − Mortgage interest
- −$4,196
- − Property taxes
- −$1,124
- − Insurance
- −$374
- − Repairs & maintenance
- −$1,483
- − Management
- −$1,483
- − Depreciation
- −$2,179
- Taxable income
- $7,699
- Est. tax owed @ 24.0%
- −$1,848
- After-tax cash flow
- $6,586/yr
For passive investors: Depreciation is non-cash, so a rental often shows a tax loss while cash-flowing — sheltering income. Rental losses are passive: they offset passive income freely, and up to $25,000/yr can offset ordinary (W-2) income if you actively participate and your MAGI is under $100k (phasing out to $0 by $150k); unused losses carry forward. On sale, claimed depreciation is recaptured at up to 25%, and gains may owe capital-gains tax (a 1031 exchange can defer both). Figures are a year-1 estimate at your 24.0% rate — not tax advice; consult a CPA.
Condition & rehab AI · 1 photo
This single-family home is in average condition with some cosmetic repairs needed. Painting the exterior and trimming the landscaping would significantly enhance its curb appeal and value.
Repairs flagged
- Minor exterior siding — Slight discoloration
- Minor landscaping — Overgrown grass and debris
Value-add opportunities
- Both paint exterior — Enhances curb appeal and value
- Both landscaping — Improves curb appeal and value
Renovation cost estimate screening
| Repair item | Severity | Est. cost |
|---|---|---|
| exterior siding · Slight discoloration | Minor | $500–3,000 |
| landscaping · Overgrown grass and debris | Minor | $500–3,000 |
| Total estimated repair cost · 2 items | $1,000–6,000 |
Value-add ROI direction
- Both paint exterior — Enhances curb appeal and value ↑
- Both landscaping — Improves curb appeal and value ↑
ⓘ Cost ranges are severity-bucket heuristics (US national rule-of-thumb). Get contractor quotes + a written scope before underwriting a rehab budget.
Schools (NCES district)
- District
- Mount Clemens Community School District
- NCES district ID
- 2624690
- Math proficiency
- 4% ▼ -9.00%
- Reading proficiency
- 11% ▼ -7.00%
- Median HH income
- $36,632
- Composite
- 6.25/100
- National rank
- #10005
- State rank
- #532 of 540 in MI
Livability — Mount Clemens
- Score
- 77/100
- State rank
- #120
- US rank
- #2918
Category grades
Schools grade is shown separately in the Schools card above.
Census & demographics
- County
- Macomb County · 638,552 people
- City population
- 15,429
- Metro
- Detroit-Warren-Dearborn, MI
- Population (ZIP)
- 22,538
- Household income
- $70,071
- Rent vs Own
- Severe rent burden
- 514.0
Population outlook (Macomb County) Hauer SSP2
- Today (2025)
- 925,296 people
- By 2030
- 948,226 · +2.5%
- By 2040
- 983,961 · +6.3%
- By 2050
- 1,010,200 · +9.2%
- By 2075
- 1,076,222 · +16.3%
- By 2100
- 1,077,065 · +16.4%
Race, ethnicity, and origin ACS 2023
- Neighborhood character
- Predominantly White (65%)
- Race & ethnicity
- White 65% Black 21% Two or more races 8% Hispanic / Latino 5% Asian 3%
- Hispanic origin (detail)
- Mexican 3%
- Common ancestry
- Romanian 13% Lithuanian 3% English 2%
- Foreign-born
- 4% · Canada, China, Jamaica
- Languages at home
- 94% English-only · Spanish 3% Chinese 1% Other Indo-European 1%
Political lean MEDSL · Macomb
- 2024 margin
- R (+13.7) · D 42.2% · R 55.9% · Other 1.9%
- 2008→2024 swing
- -22.3pp toward R · 2008: 8.6pp · 2024: -13.7pp
- All cycles
- 2024: R+13.7 2020: R+8.1 2016: R+11.6 2012: D+4.0 2008: D+8.6
Not yet ingested
- Civics
- —
Market trends
- HPI YoY
- ▼ -111.99%
- Current HPI
- 270.9126
- Rent YoY
- ▲ 3.12%
- Metro
- Detroit-Warren-Dearborn, MI
- State GDP YoY
- ▲ 1.37%
- F500 in state
- 28
Industry mix (Fortune 500 HQ in MI)
| Industry | F500 HQs | Revenue |
|---|---|---|
| Automotive Parts | 3 | $48B |
|
||
| Automotive | 2 | $372B |
|
||
| Chemicals | 1 | $45B |
|
||
| Automotive Retail | 1 | $29B |
|
||
| Healthcare / Medical Devices | 1 | $23B |
|
||
| Automotive Technology | 1 | $20B |
|
||
Price history
+0.0% since first listed3 events — show timeline
- 2026-06-19 Listed $74,900 MiRealSource-MiMLS
- 2026-06-19 Listed $74,900 REALCOMP
- 2026-06-18 Coming Soon $74,900 MiRealSource-MiMLS
Cash-flow waterfall
monthlySold comps — $/sqft
last 12 mo · ≤1 miLoading sold comps…