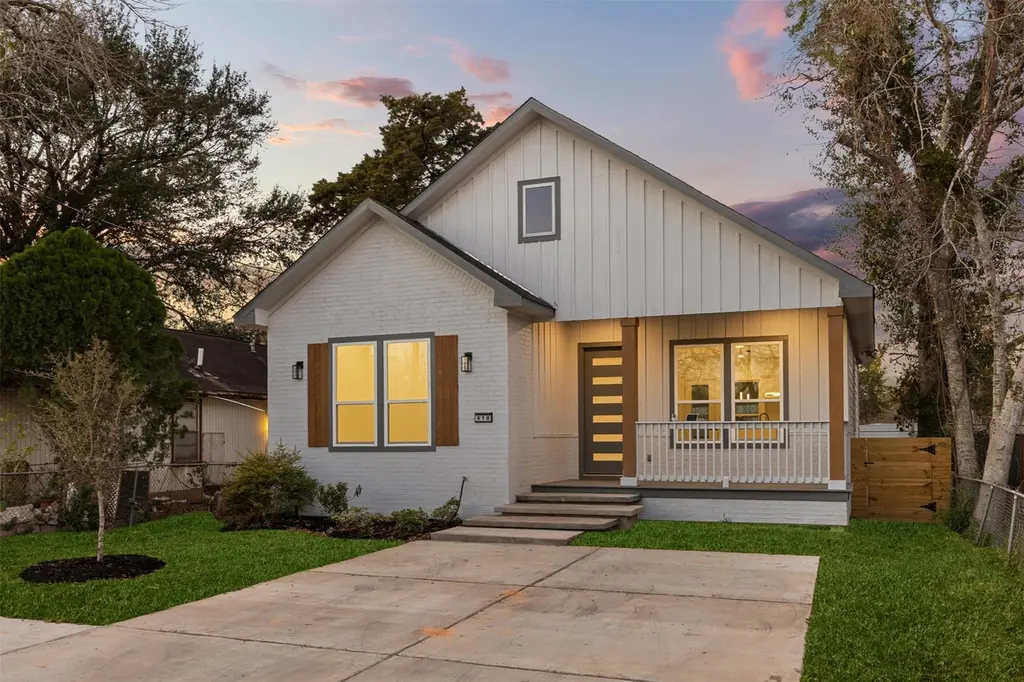
610 Lettie St · Richmond, TX
Flood risk 1/10 · Minimal
- FEMA flood zone
- X (unshaded)
- Chance of flooding over 30 yrs
- 0.0%
- Est. flood insurance / yr
- $507 – $1,088
Fire risk 3/10 · Minor
- Est. fire insurance / yr
- $1,222 – $2,270
Heat risk 9/10 · Severe
- Hot days now (above 110°F)
- 7 days/yr
- Hot days in 30 yrs
- 20 days/yr
Wind risk 9/10 · Severe
- Chance of severe wind over 30 yrs
- 99.0%
Air-quality risk 2/10 · Minimal
- Unhealthy air days now
- 1 days/yr
- Unhealthy air days in 30 yrs
- 1 days/yr
Risk factors via First Street. Map © Google.
Why this score? — see what drove the D- grade
The composite is a weighted blend of 9 inputs, each scored 0–100. Each bar is that input's sub-score; the figure is the points it added to the 100-point composite (weight × sub-score).
- Cash flow +12.7/30.0
- ARV discount +7.5/15.0
- Schools +4.6/10.0
- DSCR +3.8/10.0
- Livability +3.5/5.0
- Condition / age +2.5/5.0
- 1% rule +2.3/10.0
- Rent growth +2.0/5.0
- Appreciation +0.0/10.0
$245,000
🖨 Deal sheet (PDF) 📄 Offer letter ✓ Due diligence
Listing remarks
Introducing this beautifully designed 3-bedroom home in a desirable Richmond location, featuring a modern open-concept layout that seamlessly connects the living, dining, and kitchen areas. The kitchen offers a clean, contemporary feel with durable countertops, while the spacious primary suite provides a private retreat with an en-suite bath. Two additional bedrooms offer flexibility for guests or a home office. With all-new systems, a new roof, and a convenient location near schools, shopping, dining, and major roadways, this home offers both comfort and convenience.
Key facts
- En-suite bath
- Private retreat
- Convenient location
Tags
Property features AI
Finance
- Financial info: Lease considered
Exterior
- Parking: No designated parking
- Security: Smoke detectors
- Utilities: Public water; Public sewer
- Home design: Residential property; New construction (built 2026); Southeast facing; Pillar/post/pier foundation
- Construction: Brick and cement siding exterior; Composition roof; Built in 2026
- Exterior features: Fence with private backyard; Cleared lot; Concrete road access
Interior
- Kitchen: Dishwasher; Electric oven; Gas cooktop; Garbage disposal; Microwave
- Bedrooms: 3 rooms total
- Flooring: Plank flooring; Tile flooring; Vinyl flooring
- Bathrooms: 2 full bathrooms
- Heating & cooling: Central heating (gas); Central electric air conditioning
- Interior features: High ceilings; Ceiling fans; Programmable thermostat; Electric fireplace (1)
- Laundry & utility: Washer hookup; Electric dryer hookup; Gas dryer hookup
Neighborhood map
What this means for you Summary
Snapshot
- This is a 3-bed/2.0-bath land listed at $245k.
Deal economics
- At list price, monthly cash flow is $-28 ($-332/yr) — negative.
- To cash-flow at today's rent, offer at most $240k (2.0% below list).
- To meet the 1% rule (rent ≥ 1% of price), the offer needs to be $178k (27.2% below list).
- Recommended offer: $178k (27.2% below list) — sets the bar for 1% rule.
- Cap rate 6.2% vs local median 2.6% in Richmond — top-decile yield for the area; either an underpriced asset or a hidden risk that comps aren't pricing in. Stress-test before assuming the spread holds.
Location & tenants
- Location reads 70/100 on livability (#363 in TX) — a middle-class / working-renter tenant base. Strengths: cost of living A+, housing A+, health & safety B+; Watch: crime C-, amenities F, commute F.
- Lamar CISD (suburban): math 50% / reading 53% proficiency, ranked #116 of 826 in TX (top 14%) — acceptable for families but not a draw, mixed tenant base, ~2y average lease.
- Zoned schools: T L Pink El (math 32% / reading 25%, grade F, #2,706 of 4,322 statewide, top 63%, 486 students, 93% FRL); Lamar J H (math 30% / reading 34%, grade F, #971 of 1,662 statewide, top 60%, 1,246 students, 71% FRL); Lamar Cons H S (math 26% / reading 48%, grade F, #897 of 1,632 statewide, top 57%, 1,762 students, 62% FRL) — zoned schools average 75% FRL vs 43% district-wide (33 pts higher); higher-poverty schools than district average — tighter screening recommended.
- Zoned-school proficiency averages 32% at this address vs 52% district-wide (-19 pts) — the specific schools serving this property underperform the Lamar CISD average; the district grade overstates school quality for this exact location.
- Market conditions: Rents soft (-1.8%/yr); 1345 active listings in the ZIP; 5 comparable units currently listed for rent nearby; rentals at typical pace (median 14d on market — plan ~3-4 weeks tenant-placement turnaround); solid renter incomes; 12,093 units permitted in Fort Bend County in 2024 (815 in 5+ unit buildings).
Forward outlook
- Local home prices are declining (-3.0%/yr); year-one equity from $2k of loan paydown is wiped out by about $7k of value loss. Plan a longer hold.
- Fort Bend County population projected at +75% by 2050 — long-run rental-demand tailwind backs the buy-and-hold thesis.
Negotiation context
- It's been on market 23 days — a 2% lower offer ($241k) is reasonable based on typical stale-listing flexibility.
- 12 sale attempts since 7y ago with the ask held roughly flat each time — persistent listings suggest the price (not the market) is what's stuck; bring a comps-based counter.
Risks & watch-outs
- Climate carrying-cost: severe wind risk, 99% chance of damaging wind over 30y; extreme-heat days projected 7→20/yr by 2055 (HVAC capex compounding) — expect insurance premiums to compound above CPI over the hold.
Questions for the listing agent
- What do current leases actually rent for vs. the listed asking? Can we see a recent rent roll and the last 12 months of T-12 income?
- Is there a deadline driving the sale (1031 exchange, divorce, estate, relocation)? That informs how much negotiation room exists.
- The area grade is low — what's the realistic commute time and amenity access for the typical tenant pool here? Any planned neighborhood developments (good or bad) we should know about?
- What's the average days-on-market for RENTAL listings here right now (not sales)? A rising rental-DOM trend means longer vacancies and softer asking-rent achievability than the comps imply.
- What's the recent tenant-quality profile in this submarket — average credit score on applications, eviction rate, late-payment / NSF rate, and stable-employment percentage? A property-management company in the area should have these aggregated.
- How much new for-sale + rental construction is in the pipeline within 1–3 miles? Heavy new supply typically softens prices + rents 12–24 months out; constrained supply supports both.
Investment metrics
- 1% rule
- 0.73% ✗
- Cap rate
- 6.16%
- Cash-on-cash
- -0.48%
- DSCR
- 0.98
- GRM
- 11.4
CMA / ARV
- ARV (median comp)
- $28,000
- List price
- $245,000
- Delta
- 775.00%
- Verdict
- OVERPRICED
- Comps
- 3 within 1.0 mi
Projected returns pro-forma
-3.0% appreciation · 0.0% rent growth · sell at horizon
- IRR
- -20.1%
- Equity multiple
- 0.32×
- Total profit
- $-46,823
- Equity at exit
- $36,530
- IRR
- -19.9%
- Equity multiple
- 0.07×
- Total profit
- $-63,781
- Equity at exit
- $21,183
Cash invested: $68,600 (down + closing). Projections, not guarantees.
Landlord ↔ Tenant lean methodology
- Overall (STATE)
- 87 Strongly Landlord-Friendly
- State Texas
- 87 Strongly Landlord-Friendly · R+5
- County
- — inherits STATE
- City
- — inherits STATE
ZIP-level market 77469
- Home prices YoY
- -25.1%
- Rents YoY
- -1.8%
- Active inventory
- 1345
- Price-to-rent
- 11.4×
Monthly cashflow live
- Estimated rent
- $1,784 medium interval (Pro) →
- Mortgage (P&I)
- −$1,285
- Tax from tax record
- −$51 /mo · $606/yr
- Insurance
- −$102
- HOA
- −$0
- Vacancy / Maint / Mgmt
- −$375
- Net cashflow
- $-28
Break-even live
Sensitivity live
| Price | -10% $111 | -5% $42 | +0% $-28 | +5% $-97 | +10% $-166 |
|---|---|---|---|---|---|
| Rent | -10% $-169 | -5% $-98 | +0% $-28 | +5% $43 | +10% $113 |
| Rate | -1.0pp $96 | -0.5pp $35 | base $-28 | +0.5pp $-91 | +1.0pp $-156 |
UW: 25.0% down · 7.5% · 30yr · 1.5% tax · 5.0% vac · 8.0% maint · 8.0% mgmt
Financing live
Cash to close
- Down payment
- $61,250
- Closing costs
- $7,350
- Reserves months
- —
- Total cash needed
- —
Loan-product check · same deal, 3 products live
Conventional
25% down · 7.5% · 30yr
- Down + closing
- —
- Monthly P&I
- —
- Monthly cashflow
- —
- DSCR
- —
- Eligible?
- —
Personal DTI + credit; lowest rate.
DSCR
20% down · 8.5% · 30yr
- Down + closing
- —
- Monthly P&I
- —
- Monthly cashflow
- —
- DSCR
- —
- Eligible?
- —
No personal income docs; deal must DSCR.
Hard money
10% down · 12.0% · 12mo
- Down + closing
- —
- Monthly P&I
- —
- Monthly cashflow
- —
- DSCR
- —
- Eligible?
- —
Short-term bridge; refi at stabilization.
Rent comps 5 comps
| Address | Beds | Baths | Sqft | Rent | $/sqft | DOM | Units | Dist |
|---|---|---|---|---|---|---|---|---|
| 1108 Fort St Unit 1108 Richmond, TX | 3.0 | 1.0 | 1000 | $1,450 | $1.45 | 18d | 1 | 0.62mi |
| 1217 Westwood Dr Unit 1274 Rosenberg, TX | 2.0 | 2.0 | 900 | $1,113 | $1.24 | 0d | 1 | 1.03mi |
| 1217 Westwood Dr Unit 424 Rosenberg, TX | 2.0 | 2.0 | 900 | $1,129 | $1.25 | 6d | 1 | 1.03mi |
| 1308 Wilson Dr Rosenberg, TX | 3.0 | 2.0 | 1835 | $2,171 | $1.18 | 45d | 1 | 1.16mi |
| 4932 Vancouver Blvd Richmond, TX | 3.0 | 2.0 | 1321 | $3,500 | $2.65 | 14d | 1 | 1.42mi |
Listing history 42 events
-
2026-06-01days on market $245,000 Active 23 DOM
-
2026-05-31days on market $245,000 Active 22 DOM
-
2026-05-09$245,000 Active 574-char remark
-
2026-04-20historical
-
2026-04-16$2,000
-
2026-04-10price $240,000
-
2026-03-26$250,000 Active
-
2026-03-25historical
-
2026-02-17price $265,000
-
2026-01-05$275,000 Active
-
2025-12-31historical
-
2025-12-01historical $2,250
-
2025-10-11$2,250
-
2025-07-24$305,000 Active
-
2025-07-02soldstatus
-
2024-06-05soldstatus
-
2024-06-03soldstatus Sold
-
2024-05-17status Pending
-
2024-05-13status Option Pending
-
2024-05-03status Active
-
2024-05-02status Pending
-
2024-04-17status Option Pending
-
2024-01-28price $46,000
-
2024-01-23price $59,000
-
2023-10-30$65,000 Active
-
2022-04-20soldstatus Sold
-
2022-04-20soldstatus
-
2022-04-02status Pending
-
2021-12-22price $50,000
-
2021-12-03$45,000 Active
-
2020-06-25soldstatus Sold
-
2020-06-25soldstatus
-
2020-06-08status Pending, Continue to Show
-
2020-05-26historical
-
2020-05-25$39,900 Active
-
2020-05-21$39,000 Active
-
2019-02-18soldstatus Sold
-
2019-01-28status Pending
-
2019-01-11$22,000 Active
-
2018-12-12soldstatus
-
2008-11-26soldstatus
-
1993-04-22soldstatus
ⓘ Source: listings_history table (triggers on properties + properties_extension) + one-shot
backfill from property_details.listing_events for pre-trigger history.
Tax reassessment forecast TX · Resets to sale price
- Current annual tax
- $606 · $51/mo
- Projected year-2 tax
- $4,484 · $374/mo
- Expected delta
- +$3,877/yr (+$323/mo · 639.4%)
ⓘ Screening estimate from a state-policy table — verify with the county assessor before closing.
Climate risk First Street
- Flood 1/10 Low FEMA zone X (unshaded) · 0% chance over 30 yrs
- Wildfire 3/10 Moderate
- Heat 9/10 Extreme 7 d/yr ≥110°F today · 20 d/yr by 30 yrs out
- Wind 9/10 Extreme 99% chance of damaging wind over 30 yrs
- Air quality 2/10 Low 1 unhealthy d/yr today · 1 by 30 yrs out
Nearby sold comps map
Loading sold comps map…
Walkable amenities ~0.75 mi
Loading nearby amenities…
Taxation est. · year 1
- Rental income
- $21,414
- − Mortgage interest
- −$13,724
- − Property taxes
- −$606
- − Insurance
- −$1,225
- − Repairs & maintenance
- −$1,713
- − Management
- −$1,713
- − Depreciation
- −$7,127
- Taxable loss
- −$4,695
- Est. tax savings @ 24.0%
- +$1,127
- After-tax cash flow
- $795/yr
For passive investors: Depreciation is non-cash, so a rental often shows a tax loss while cash-flowing — sheltering income. Rental losses are passive: they offset passive income freely, and up to $25,000/yr can offset ordinary (W-2) income if you actively participate and your MAGI is under $100k (phasing out to $0 by $150k); unused losses carry forward. On sale, claimed depreciation is recaptured at up to 25%, and gains may owe capital-gains tax (a 1031 exchange can defer both). Figures are a year-1 estimate at your 24.0% rate — not tax advice; consult a CPA.
Schools (NCES district)
- District
- Lamar CISD
- NCES district ID
- 4826580
- Math proficiency
- 50% ▼ -12.00%
- Reading proficiency
- 53% ▼ -4.00%
- Median HH income
- $75,213
- Composite
- 46.43/100
- National rank
- #2452
- State rank
- #116 of 826 in TX
Livability — Richmond
- Score
- 70/100
- State rank
- #363
- US rank
- #7780
Category grades
Schools grade is shown separately in the Schools card above.
Census & demographics
- Census place
- Richmond, TX
- County
- Fort Bend County · 836,777 people
- City population
- 158,237
- Metro
- Houston-The Woodlands-Sugar Land, TX
- Population (ZIP)
- 69,826
- Household income
- $102,125
- Rent vs Own
- Severe rent burden
- 1292.0
Population outlook (Fort Bend County) Hauer SSP2
- Today (2025)
- 1,004,526 people
- By 2030
- 1,153,104 · +14.8%
- By 2040
- 1,453,718 · +44.7%
- By 2050
- 1,753,781 · +74.6%
- By 2075
- 2,455,772 · +144.5%
- By 2100
- 2,930,528 · +191.7%
Race, ethnicity, and origin ACS 2023
- Neighborhood character
- Highly diverse neighborhood (Simpson 0.76)
- Race & ethnicity
- Hispanic / Latino 29% White 27% Black 25% Two or more races 15% Asian 15%
- Hispanic origin (detail)
- Mexican 21%
- Common ancestry
- Romanian 1% Lithuanian 1%
- Foreign-born
- 24% · Canada, Vietnam, China
- Languages at home
- 65% English-only · Spanish 17% Other Indo-European 7% Other Asian/Pacific 2%
Political lean MEDSL · Fort Bend
- 2024 margin
- Toss-up / Even · D 49.5% · R 47.9% · Other 2.6%
- 2008→2024 swing
- +4.0pp toward D · 2008: -2.4pp · 2024: 1.6pp
- All cycles
- 2024: D+1.6 2020: D+10.6 2016: D+6.6 2012: R+6.8 2008: R+2.4
Not yet ingested
- Civics
- —
Market trends
- HPI YoY
- ▼ -78.66%
- Current HPI
- 234.9892
- Rent YoY
- ▼ -1.81%
- Metro
- Houston-The Woodlands-Sugar Land, TX
- State GDP YoY
- ▲ 3.95%
- F500 in state
- 110
Industry mix (Fortune 500 HQ in TX)
| Industry | F500 HQs | Revenue |
|---|---|---|
| Energy | 16 | $1,198B |
|
||
| Technology | 5 | $198B |
|
||
| Engineering / Construction | 4 | $72B |
|
||
| Energy Services | 3 | $60B |
|
||
| Utilities | 3 | $41B |
|
||
| Healthcare | 2 | $330B |
|
||
Price history
-90.9% since first listed42 events — show timeline
- 2026-06-01 Rental Removed $2,000 HARMLS
- 2026-06-01 Listing Removed — HARMLS
- 2026-05-09 Listed $245,000 HARMLS
- 2026-04-20 Listing Removed — HARMLS
- 2026-04-16 Listed for Rent $2,000 HARMLS
- 2026-04-10 Price Changed $240,000 HARMLS
- 2026-03-26 Listed $250,000 HARMLS
- 2026-03-25 Listing Removed — HARMLS
- 2026-02-17 Price Changed $265,000 HARMLS
- 2026-01-05 Listed $275,000 HARMLS
- 2025-12-31 Listing Removed — HARMLS
- 2025-12-01 Rental Removed $2,250 HARMLS
- 2025-10-11 Listed for Rent $2,250 HARMLS
- 2025-07-24 Listed $305,000 HARMLS
- 2025-07-02 Sold (Public Records) — Public Records
- 2024-06-05 Sold (Public Records) — Public Records
- 2024-06-03 Sold (MLS) — HARMLS
- 2024-05-17 Pending — HARMLS
- 2024-05-13 Pending — HARMLS
- 2024-05-03 Relisted — HARMLS
- 2024-05-02 Pending — HARMLS
- 2024-04-17 Pending — HARMLS
- 2024-01-28 Price Changed $46,000 HARMLS
- 2024-01-23 Price Changed $59,000 HARMLS
- 2023-10-30 Listed $65,000 HARMLS
- 2022-04-20 Sold (Public Records) — Public Records
- 2022-04-20 Sold (MLS) — HARMLS
- 2022-04-02 Pending — HARMLS
- 2021-12-22 Price Changed $50,000 HARMLS
- 2021-12-03 Listed $45,000 HARMLS
- 2020-06-25 Sold (Public Records) — Public Records
- 2020-06-25 Sold (MLS) — HARMLS
- 2020-06-08 Pending — HARMLS
- 2020-05-26 Listing Removed — HARMLS
- 2020-05-25 Listed $39,900 HARMLS
- 2020-05-21 Listed $39,000 HARMLS
- 2019-02-18 Sold (MLS) — HARMLS
- 2019-01-28 Pending — HARMLS
- 2019-01-11 Listed $22,000 HARMLS
- 2018-12-12 Sold (Public Records) — Public Records
- 2008-11-26 Sold (Public Records) — Public Records
- 1993-04-22 Sold (Public Records) — Public Records
Property tax history
-0.8%/yrLatest (2025): $606 · -5.4% YoY. Source: county tax records.
Cash-flow waterfall
monthlySold comps — $/sqft
last 12 mo · ≤1 miLoading sold comps…