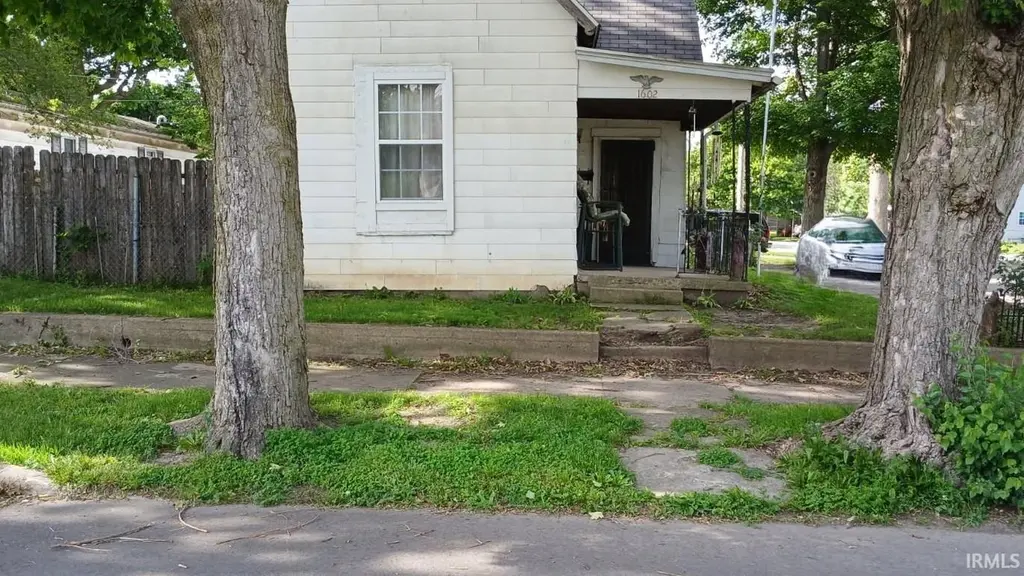
1602 W Jeffras Ave · Marion, IN
Flood risk 1/10 · Minimal
- FEMA flood zone
- X (unshaded)
- Chance of flooding over 30 yrs
- 0.0%
- Est. flood insurance / yr
- $507 – $1,088
Fire risk 1/10 · Minimal
- Est. fire insurance / yr
- $717 – $1,331
Heat risk 3/10 · Minor
- Hot days now (above 100°F)
- 7 days/yr
- Hot days in 30 yrs
- 18 days/yr
Wind risk 2/10 · Minimal
- Chance of severe wind over 30 yrs
- —
Air-quality risk 2/10 · Minimal
- Unhealthy air days now
- 1 days/yr
- Unhealthy air days in 30 yrs
- 3 days/yr
Risk factors via First Street. Map © Google.
Why this score? — see what drove the B- grade
The composite is a weighted blend of 9 inputs, each scored 0–100. Each bar is that input's sub-score; the figure is the points it added to the 100-point composite (weight × sub-score).
- Cash flow +30.0/30.0
- 1% rule +10.0/10.0
- DSCR +10.0/10.0
- ARV discount +7.5/15.0
- Livability +3.2/5.0
- Rent growth +2.5/5.0
- Condition / age +2.5/5.0
- Schools +1.7/10.0
- Appreciation +0.0/10.0
$50,000
🖨 Deal sheet (PDF) 📄 Offer letter ✓ Due diligence
Listing remarks
Being sold AS-IS, WHERE-IS, with no repairs or concessions to be made by the seller. Cash offers preferred! Don't miss this opportunity to acquire an affordable property with strong upside potential in Marion, Indiana. This 2-bedroom, 1-bath home offers 884 square feet of living space and features a functional floor plan, spacious living area, and a detached garage for additional storage or parking. Conveniently located near schools, shopping, dining, and major roadways, the property provides easy access to everyday amenities. Whether you're an investor, flipper, or buyer looking for a value-add opportunity, this home presents excellent potential for renovation, rental income, or resale. Br
Key facts
- Spacious living area
- Detached garage
- 4,700 sq ft lot
Tags
Property features AI
Finance
- Financial info: Annual tax amount reported
Exterior
- Utilities: Public water; Public sewer
- Home design: Single-family residence, site-built; One story
- Construction: Vinyl siding; Slab foundation; Built as site-built construction
- Exterior features: Lot dimensions approximately 47 x 100; Lot size about 0.11 acre
Interior
- Kitchen: Includes refrigerator and gas oven
- Bedrooms: Total of 5 rooms (includes bedrooms and living spaces)
- Bathrooms: 1 full bathroom (main level)
- Heating & cooling: Forced air heating; Window unit cooling
- Interior features: Refrigerator; Gas oven; Window air conditioning units; Forced air heating
- Laundry & utility: Laundry on the main level
Neighborhood map
What this means for you Summary
Snapshot
- This is a 2-bed/1.0-bath single-family listed at $50k.
Deal economics
- At list price, monthly cash flow is $366 ($4k/yr) — positive.
- The deal already cash-flows at list — no discount required.
- Meets the 1% rule at list price ($857 rent vs $50k).
- Cap rate 15.1% vs local median 8.2% in Marion — top-decile yield for the area; either an underpriced asset or a hidden risk that comps aren't pricing in. Stress-test before assuming the spread holds.
Location & tenants
- Location reads 65/100 on livability (#337 in IN) — a middle-class / working-renter tenant base. Strengths: crime A+, cost of living A+, housing A+; Watch: amenities F, commute F, employment F.
- Marion Community Schools (town): math 18% / reading 24% proficiency, ranked #277 of 301 in IN (top 92%) — low school quality limits family demand, transient renter base, plan for 1-2y turnover; 67% free/reduced lunch — lower-income household profile, screen leases tightly.
- Zoned schools: John W Kendall Elem School (math 37% / reading 32%, grade F, #597 of 994 statewide, top 63%, 372 students, 69% FRL); John L Mcculloch Junior High Sch (math 11% / reading 22%, grade F, #287 of 330 statewide, top 88%, 524 students, 74% FRL); Marion High School (math 12% / reading 47%, grade F, #308 of 369 statewide, top 84%, 1,050 students, 66% FRL) — zoned schools at 70% FRL track the district average.
- Market conditions: 126 active listings in the ZIP; 3 comparable units currently listed for rent nearby; rentals lingering (median 45d on market — plan ~5-8 weeks vacancy on turnover, expect pricing pressure); 100% of comp listings sitting > 30 days — soft ceiling on asking rent; 52 units permitted in Grant County in 2024 (8 in 5+ unit buildings).
Forward outlook
- Local home prices are declining (-3.0%/yr); year-one equity from $346 of loan paydown is wiped out by about $2k of value loss. Plan a longer hold.
- Grant County population projected at -18% by 2050 — secular population decline; favor cash flow + early exit over multi-decade hold.
- At projected returns (-3.0% appreciation + 3.0% rent growth), your $14k cash investment doubles in ~4 years — after that, you're playing with house money.
Negotiation context
- Only 4 days on market — expect competitive offers; lowballing is unlikely to land.
Risks & watch-outs
- Watch-outs: built in 1900 — expect roof / HVAC / electrical / plumbing capex.
Questions for the listing agent
- Built in 1900 — when were the roof, HVAC, electrical panel, plumbing, and water heater last replaced?
- Is there a deadline driving the sale (1031 exchange, divorce, estate, relocation)? That informs how much negotiation room exists.
- Schools are F-rated, which usually means shorter tenancies and higher turnover. Who's the typical renter profile here, and what's been the actual vacancy rate?
- What's the average days-on-market for RENTAL listings here right now (not sales)? A rising rental-DOM trend means longer vacancies and softer asking-rent achievability than the comps imply.
- What's the recent tenant-quality profile in this submarket — average credit score on applications, eviction rate, late-payment / NSF rate, and stable-employment percentage? A property-management company in the area should have these aggregated.
- How much new for-sale + rental construction is in the pipeline within 1–3 miles? Heavy new supply typically softens prices + rents 12–24 months out; constrained supply supports both.
Investment metrics
- 1% rule
- 1.71% ✓
- Cap rate
- 15.08%
- Cash-on-cash
- 31.37%
- DSCR
- 2.40
- GRM
- 4.9
CMA / ARV
- ARV (on-the-fly)
- $112,268
- Comps found
- 12
Show comp detail 12 sales within ~0.75 mi
| Address | Dist | Beds/Ba | Sqft | Sold | Price | $/sf | Match |
|---|---|---|---|---|---|---|---|
| 1805 W Wenlock Dr | 0.41mi | 2/1.0 | 851 (-4%) | 7mo | $95,000 | $112 | 69 |
| 1203 W National Ave | 0.51mi | 2/1.0 | 848 (-4%) | 2mo | $85,000 | $100 | 68 |
| 1640 W Spencer Ave | 0.15mi | 2/1.5 | 1,004 (+14%) | 2mo | $74,000 | $74 | 66 |
| 221 N G St | 0.37mi | 2/1.0 | 804 (-9%) | 2mo | $55,000 | $68 | 66 |
| 1005 N Oxford Dr | 0.55mi | 3/1.0 (+1) | 864 (-2%) | 6mo | $109,900 | $127 | 60 |
| 304 N Norton Ave | 0.50mi | 2/1.5 | 960 (+9%) | 3mo | $154,000 | $160 | 58 |
| 601 N Bradner Ave | 0.39mi | 3/1.0 (+1) | 960 (+9%) | 7mo | $150,000 | $156 | 57 |
| 806 N Guinivere Dr | 0.66mi | 3/1.0 (+1) | 900 (+2%) | 7mo | $157,000 | $174 | 55 |
| 506 N Miller Ave | 0.71mi | 3/1.5 (+1) | 936 (+6%) | 2mo | $156,000 | $167 | 49 |
| 1422 W 5 St | 0.55mi | 2/1.0 | 768 (-13%) | 7mo | $55,000 | $72 | 47 |
| 1806 W Westlea Dr | 0.71mi | 3/1.0 (+1) | 960 (+9%) | 2mo | $80,000 | $83 | 46 |
| 800 N Knight Cir | 0.62mi | 3/1.0 (+1) | 984 (+11%) | 1mo | $157,000 | $160 | 46 |
Match score weights: distance 35% · size 25% · config 20% · recency 20%. Top-matched comps best support the ARV.
Projected returns pro-forma
-3.0% appreciation · 3.0% rent growth · sell at horizon
- IRR
- 26.2%
- Equity multiple
- 2.09×
- Total profit
- $15,202
- Equity at exit
- $7,455
- IRR
- 33.9%
- Equity multiple
- 4.09×
- Total profit
- $43,222
- Equity at exit
- $4,323
Cash invested: $14,000 (down + closing). Projections, not guarantees.
Landlord ↔ Tenant lean methodology
- Overall (STATE)
- 90 Strongly Landlord-Friendly
- State Indiana
- 90 Strongly Landlord-Friendly · R+11
- County
- — inherits STATE
- City
- — inherits STATE
ZIP-level market 46952
- Home prices YoY
- -29.9%
- Active inventory
- 126
- Price-to-rent
- 4.9×
Monthly cashflow live
- Estimated rent
- $857 medium interval (Pro) →
- Mortgage (P&I)
- −$262
- Tax from tax record
- −$28 /mo · $333/yr
- Insurance
- −$21
- HOA
- −$0
- Vacancy / Maint / Mgmt
- −$180
- Net cashflow
- $366
Break-even live
Sensitivity live
| Price | -10% $394 | -5% $380 | +0% $366 | +5% $352 | +10% $338 |
|---|---|---|---|---|---|
| Rent | -10% $298 | -5% $332 | +0% $366 | +5% $400 | +10% $434 |
| Rate | -1.0pp $391 | -0.5pp $379 | base $366 | +0.5pp $353 | +1.0pp $340 |
UW: 25.0% down · 7.5% · 30yr · 1.5% tax · 5.0% vac · 8.0% maint · 8.0% mgmt
Financing live
Cash to close
- Down payment
- $12,500
- Closing costs
- $1,500
- Reserves months
- —
- Total cash needed
- —
Loan-product check · same deal, 3 products live
Conventional
25% down · 7.5% · 30yr
- Down + closing
- —
- Monthly P&I
- —
- Monthly cashflow
- —
- DSCR
- —
- Eligible?
- —
Personal DTI + credit; lowest rate.
DSCR
20% down · 8.5% · 30yr
- Down + closing
- —
- Monthly P&I
- —
- Monthly cashflow
- —
- DSCR
- —
- Eligible?
- —
No personal income docs; deal must DSCR.
Hard money
10% down · 12.0% · 12mo
- Down + closing
- —
- Monthly P&I
- —
- Monthly cashflow
- —
- DSCR
- —
- Eligible?
- —
Short-term bridge; refi at stabilization.
Rent comps 3 comps
| Address | Beds | Baths | Sqft | Rent | $/sqft | DOM | Units | Dist |
|---|---|---|---|---|---|---|---|---|
| 2116 W 2nd St Marion, IN | 1.0–2.0 | 1.0 | 764 | $945 | $1.24 | 45d | 1 | 0.63mi |
| 2111 W Frederick Dr Marion, IN | 1.0–2.0 | 1.0–1.5 | 965 | $937 | $0.97 | 45d | 4 | 0.76mi |
| 805 N Washington St Unit 10 Marion, IN | 1.0 | 1.0 | 600 | $575 | $0.96 | 45d | 1 | 1.07mi |
Listing history 8 events
-
2026-06-21days on market $50,000 Active 4 DOM
-
2026-06-19days on market $50,000 Active 2 DOM
-
2026-06-18days on market $50,000 Active 1 DOM
-
2026-06-17days on market $50,000 Active 5 DOM
-
2026-06-16days on market $50,000 Active 4 DOM
-
2026-06-15days on market $50,000 Active 3 DOM
-
2026-06-12remarks 699-char remark
-
2026-06-12$50,000 Active 1 DOM
ⓘ Source: listings_history table (triggers on properties + properties_extension) + one-shot
backfill from property_details.listing_events for pre-trigger history.
Tax reassessment forecast IN · Partial reset (capped growth)
- Current annual tax
- $333 · $28/mo
- Projected year-2 tax
- $379 · $32/mo
- Expected delta
- +$46/yr (+$4/mo · 13.8%)
ⓘ Screening estimate from a state-policy table — verify with the county assessor before closing.
Climate risk First Street
- Flood 1/10 Low FEMA zone X (unshaded) · 0% chance over 30 yrs
- Wildfire 1/10 Low
- Heat 3/10 Moderate 7 d/yr ≥100°F today · 18 d/yr by 30 yrs out
- Wind 2/10 Low
- Air quality 2/10 Low 1 unhealthy d/yr today · 3 by 30 yrs out
Nearby sold comps map
Loading sold comps map…
Walkable amenities ~0.75 mi
Loading nearby amenities…
Taxation est. · year 1
- Rental income
- $10,281
- − Mortgage interest
- −$2,801
- − Property taxes
- −$333
- − Insurance
- −$250
- − Repairs & maintenance
- −$822
- − Management
- −$822
- − Depreciation
- −$1,455
- Taxable income
- $3,798
- Est. tax owed @ 24.0%
- −$911
- After-tax cash flow
- $3,481/yr
For passive investors: Depreciation is non-cash, so a rental often shows a tax loss while cash-flowing — sheltering income. Rental losses are passive: they offset passive income freely, and up to $25,000/yr can offset ordinary (W-2) income if you actively participate and your MAGI is under $100k (phasing out to $0 by $150k); unused losses carry forward. On sale, claimed depreciation is recaptured at up to 25%, and gains may owe capital-gains tax (a 1031 exchange can defer both). Figures are a year-1 estimate at your 24.0% rate — not tax advice; consult a CPA.
Schools (NCES district)
- District
- Marion Community Schools
- NCES district ID
- 1806390
- Math proficiency
- 18% ▼ -9.00%
- Reading proficiency
- 24% ▼ -6.00%
- Median HH income
- $33,415
- Composite
- 17.13/100
- National rank
- #9115
- State rank
- #277 of 301 in IN
Livability — Marion
- Score
- 65/100
- State rank
- #337
- US rank
- #13006
Category grades
Schools grade is shown separately in the Schools card above.
Census & demographics
- Census place
- Marion, IN
- County
- Grant County · 41,561 people
- City population
- 41,561
- Metro
- Marion, IN
- Population (ZIP)
- 18,189
- Household income
- $52,880
- Rent vs Own
- Severe rent burden
- 662.0
Population outlook (Grant County) Hauer SSP2
- Today (2025)
- 64,394 people
- By 2030
- 62,145 · -3.5%
- By 2040
- 57,252 · -11.1%
- By 2050
- 52,968 · -17.7%
- By 2075
- 45,986 · -28.6%
- By 2100
- 39,400 · -38.8%
Race, ethnicity, and origin ACS 2023
- Neighborhood character
- Predominantly White (84%)
- Race & ethnicity
- White 84% Two or more races 7% Hispanic / Latino 5% Black 4% Asian 1%
- Hispanic origin (detail)
- Mexican 4%
- Common ancestry
- Italian 3% Romanian 1% Iranian 1%
- Foreign-born
- 4% · Canada
- Languages at home
- 96% English-only · Spanish 3%
Political lean MEDSL · Grant
- 2024 margin
- Solid R (+41.8) · D 28.2% · R 70.0% · Other 1.9%
- 2008→2024 swing
- -28.7pp toward R · 2008: -13.1pp · 2024: -41.8pp
- All cycles
- 2024: R+41.8 2020: R+38.8 2016: R+39.5 2012: R+22.0 2008: R+13.1
Not yet ingested
- Civics
- —
Market trends
- HPI YoY
- ▼ -76.69%
- Current HPI
- 180.1174
- Rent YoY
- —
- Metro
- Marion, IN
- State GDP YoY
- ▲ 2.90%
- F500 in state
- 18
Industry mix (Fortune 500 HQ in IN)
| Industry | F500 HQs | Revenue |
|---|---|---|
| Industrial Machinery | 2 | $37B |
|
||
| Healthcare | 1 | $177B |
|
||
| Pharmaceuticals | 1 | $45B |
|
||
| Metals / Steel | 1 | $18B |
|
||
| Agriculture | 1 | $17B |
|
||
| Packaging | 1 | $12B |
|
||
Price history
1 event — show timeline
- 2026-06-12 Listed $50,000 IRMLS
Property tax history
+1.9%/yrLatest (2024): $333 · +6.0% YoY. Source: county tax records.
Cash-flow waterfall
monthlySold comps — $/sqft
last 12 mo · ≤1 miLoading sold comps…