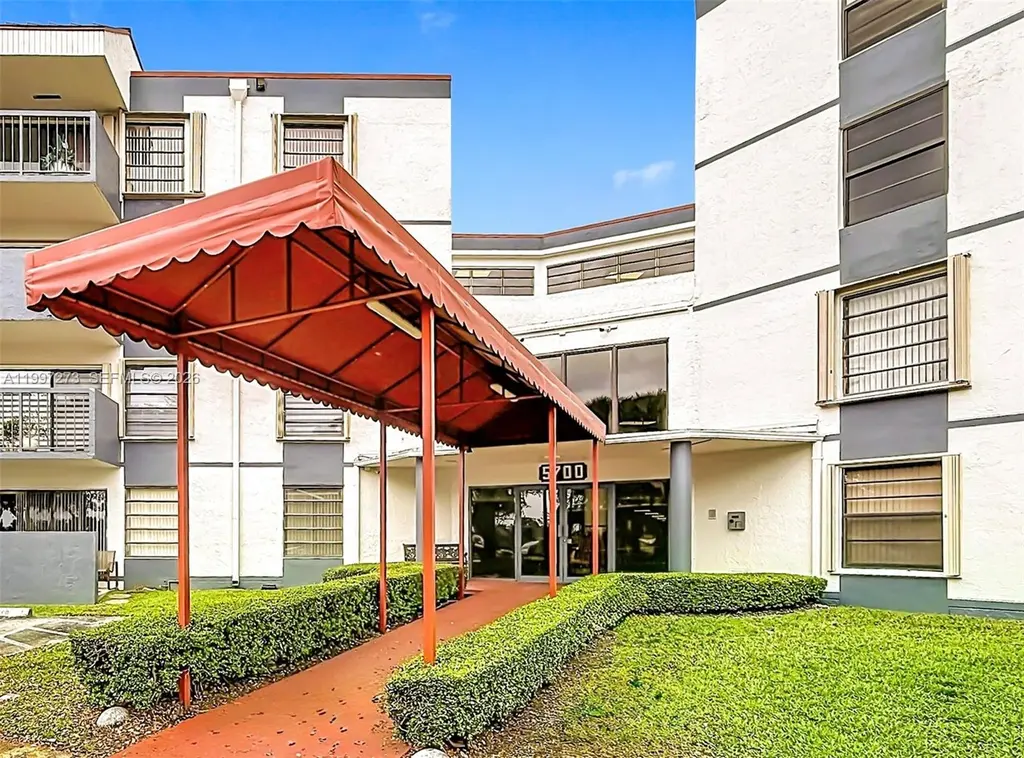
5700 SW 127th Ave #1208 · Kendale Lakes, FL
Flood risk 1/10 · Minimal
- FEMA flood zone
- X
- Chance of flooding over 30 yrs
- 0.0%
- Est. flood insurance / yr
- $507 – $1,088
Fire risk 1/10 · Minimal
- Est. fire insurance / yr
- $947 – $1,759
Heat risk 10/10 · Severe
- Hot days now (above 105°F)
- 7 days/yr
- Hot days in 30 yrs
- 30 days/yr
Wind risk 10/10 · Severe
- Chance of severe wind over 30 yrs
- 99.0%
Air-quality risk 2/10 · Minimal
- Unhealthy air days now
- 1 days/yr
- Unhealthy air days in 30 yrs
- 1 days/yr
Risk factors via First Street. Map © Google.
Why this score? — see what drove the D grade
The composite is a weighted blend of 9 inputs, each scored 0–100. Each bar is that input's sub-score; the figure is the points it added to the 100-point composite (weight × sub-score).
- Cash flow +11.3/30.0
- ARV discount +7.5/15.0
- 1% rule +5.0/10.0
- Schools +4.2/10.0
- Livability +3.9/5.0
- DSCR +3.3/10.0
- Rent growth +2.5/5.0
- Condition / age +2.5/5.0
- Appreciation +0.0/10.0
$254,900
🖨 Deal sheet 📄 Offer letter ✓ Due diligence
Listing remarks
SPACIOUS AND BRIGHT UNIT WITH THE POTENTIAL TO MAKE IT YOUR OWN! UNIT OFFERS A VERY SPACIOUS INTERIOR WITH A FOYER ENTRANCE, LARGE MASTER BEDROOM WITH ON-SUITE BATH and WALK-IN CLOSET * LARGE LIVING/DINNING ADJACENT TO EAT IN KITCHEN AND LARGE DOUBLE BALCONY WITH SLIDERS PROTECTED BY ACCORDION SHUTTERS * UNIT MAY IS INVESTOR FRIENDLY AND MAY BE RENTED IMMEDIATELY AFTER CLOSING * * ENJOY THE CONVENIENCE OF HAVING 2 ASSIGNED PARKING SPOTS, LOBBY ENTRANCE, NEW ELEVATORS AND HALLWAYS TO PROTECT YOU FROM THE FLORIDA RAIN AND HEAT * THE BUILDING IS EXTREMELY CLEAN AND SECURE AND IS NESTLED IN A PRIVATE GATED COMMUNITY THAT OFFERS A 24/7 MANNED GUARDED SECURITY ENTRANCE * AMENITIES INCLUDE POOL
Key facts
- Gated community
- Large lobby
- Rare foyer entrance
Tags
Property features AI
Finance
- Financial info: Pets allowed with restrictions
- HOA & community: Monthly association fee; Association amenities include pool, storage, tennis courts, and elevators; HOA covers common areas, structural maintenance, parking, pools, sewer, security, trash, and water
Exterior
- Parking: Assigned parking; Guest parking; Two or more spaces available
- Security: Complex is fenced; Security guard
- Utilities: Public water; Public sewer; Electric service; Has cooling; Has heating
- Home design: Attached property; 4-story building; Entry located on level 2
- Construction: Block construction; Resale property
- Exterior features: Balcony; Open balcony/porch; Fence; Storm/security shutters; Association pool
Interior
- Kitchen: Electric range; Dishwasher; Refrigerator
- Flooring: Tile
- Bathrooms: 2 full bathrooms
- Heating & cooling: Central heating; Central air
- Interior features: Second-floor entry; Entrance foyer; Elevator; French doors/atrium doors; Walk-in closets
- Laundry & utility: Washer; Dryer
Neighborhood map
What this means for you Summary
Snapshot
- This is a 2-bed/2.0-bath condo listed at $255k.
Deal economics
- At list price, monthly cash flow is $-91 ($-1k/yr) — negative.
- To cash-flow at today's rent, offer at most $239k (6.3% below list).
- To meet the 1% rule (rent ≥ 1% of price), the offer needs to be $254k (0.4% below list).
- Recommended offer: $239k (6.3% below list) — sets the bar for cash-flow.
- Cap rate 5.9% vs local median 3.6% in Kendale Lakes — top-decile yield for the area; either an underpriced asset or a hidden risk that comps aren't pricing in. Stress-test before assuming the spread holds.
Location & tenants
- Location reads 77/100 on livability (#186 in FL, #2,923 nationally) — a middle-class / working-renter tenant base. Strengths: schools A+, housing A+, crime A-; Watch: amenities F.
- Miami-Dade (suburban): math 45% / reading 54% proficiency, ranked #40 of 73 in FL (top 55%) — families likely to look elsewhere, expect single-tenant / working-renter base with shorter leases; 64% free/reduced lunch — lower-income household profile, screen leases tightly.
- Market conditions: Rents soft (-0.1%/yr); 183 active listings in the ZIP; 40 comparable units currently listed for rent nearby; rentals at typical pace (median 21d on market — plan ~3-4 weeks tenant-placement turnaround); 10,051 units permitted in Miami-Dade County in 2024 (7,758 in 5+ unit buildings).
- This rent runs 43% of the median local income ($70k/yr) — at the standard rent-burdened threshold; future hikes will face affordability resistance.
Forward outlook
- Local home prices are declining (-3.0%/yr); year-one equity from $2k of loan paydown is wiped out by about $8k of value loss. Plan a longer hold.
- Miami-Dade County population projected at +28% by 2050 — long-run rental-demand tailwind backs the buy-and-hold thesis.
Negotiation context
- It's been on market 69 days — a 6% lower offer ($240k) is reasonable based on typical stale-listing flexibility.
- Current owner paid $62k; list at $255k implies a 312% gain — meaningful room to come down on a strong offer.
Risks & watch-outs
- Watch-outs: HOA is 24% of rent.
- Climate carrying-cost: severe wind risk, 99% chance of damaging wind over 30y; extreme-heat days projected 7→30/yr by 2055 (HVAC capex compounding) — expect insurance premiums to compound above CPI over the hold.
Questions for the listing agent
- What do current leases actually rent for vs. the listed asking? Can we see a recent rent roll and the last 12 months of T-12 income?
- It's been on market 69 days. Have you received any prior offers? Is the seller open to a 6% concession, seller financing, or rate buy-down credit?
- What does the HOA fee cover, when was the last increase, and are there any pending special assessments or reserve-fund shortfalls?
- Any open or pending special assessments — roof, HVAC, plumbing, elevator, façade? What's the per-unit balance and payoff schedule, and is the seller paying it off at close or rolling it to the buyer?
- Why hasn't it sold? Are there any deal-killer items the seller is aware of (foundation, flood, title, zoning, code violations)?
- Is there a deadline driving the sale (1031 exchange, divorce, estate, relocation)? That informs how much negotiation room exists.
- Schools are A-rated — typically a magnet for longer-tenancy family renters. What's the average tenant stay here, and is there a school-zone premium baked into asking?
- The area grade is low — what's the realistic commute time and amenity access for the typical tenant pool here? Any planned neighborhood developments (good or bad) we should know about?
- What's the average days-on-market for RENTAL listings here right now (not sales)? A rising rental-DOM trend means longer vacancies and softer asking-rent achievability than the comps imply.
- What's the recent tenant-quality profile in this submarket — average credit score on applications, eviction rate, late-payment / NSF rate, and stable-employment percentage? A property-management company in the area should have these aggregated.
- How much new apartment / multifamily construction is in the pipeline within 1–3 miles? Heavy new supply (>2% of stock underway) typically softens rents 12–24 months out; light construction supports rent growth.
Investment metrics
- 1% rule
- 1.00% ✗
- Cap rate
- 5.86%
- Cash-on-cash
- -1.53%
- DSCR
- 0.93
- GRM
- 8.4
CMA / ARV
No comps found within radius.
Projected returns pro-forma
-3.0% appreciation · 0.0% rent growth · sell at horizon
- IRR
- -22.8%
- Equity multiple
- 0.24×
- Total profit
- $-54,298
- Equity at exit
- $38,006
- IRR
- -30.8%
- Equity multiple
- -0.16×
- Total profit
- $-82,515
- Equity at exit
- $22,039
Cash invested: $71,372 (down + closing). Projections, not guarantees.
Landlord ↔ Tenant lean methodology
- Overall (STATE)
- 87 Strongly Landlord-Friendly
- State Florida
- 87 Strongly Landlord-Friendly · R+3
- County
- — inherits STATE
- City
- — inherits STATE
ZIP-level market 33183
- Rents YoY
- -0.1%
- Active inventory
- 183
- Price-to-rent
- 8.4×
Monthly cashflow live
- Estimated rent
- $2,540 high interval (Pro) →
- Mortgage (P&I)
- −$1,337
- Tax from tax record
- −$57 /mo · $679/yr
- Insurance
- −$106
- HOA
- −$598
- Vacancy / Maint / Mgmt
- −$533
- Net cashflow
- $-91
Break-even live
UW: 25.0% down · 7.5% · 30yr · 1.5% tax · 5.0% vac · 8.0% maint · 8.0% mgmt
Financing live
Cash to close
- Down payment
- $63,725
- Closing costs
- $7,647
- Reserves months
- —
- Total cash needed
- —
Loan-product check · same deal, 3 products live
Conventional
25% down · 7.5% · 30yr
- Down + closing
- —
- Monthly P&I
- —
- Monthly cashflow
- —
- DSCR
- —
- Eligible?
- —
Personal DTI + credit; lowest rate.
DSCR
20% down · 8.5% · 30yr
- Down + closing
- —
- Monthly P&I
- —
- Monthly cashflow
- —
- DSCR
- —
- Eligible?
- —
No personal income docs; deal must DSCR.
Hard money
10% down · 12.0% · 12mo
- Down + closing
- —
- Monthly P&I
- —
- Monthly cashflow
- —
- DSCR
- —
- Eligible?
- —
Short-term bridge; refi at stabilization.
Rent comps 40 comps
| Address | Beds | Baths | Sqft | Rent | $/sqft | DOM | Units | Dist |
|---|---|---|---|---|---|---|---|---|
| 5700 SW 127th Ave #1407 Miami, FL | 2.0 | 2.0 | 1170 | $2,200 | $1.88 | 2d | 1 | 0.02mi |
| 5700 SW 127th Ave #1407 Miami, FL | 2.0 | 2.0 | 1170 | $2,200 | $1.88 | 16d | 1 | 0.02mi |
| 5800 SW 127th Ave Miami, FL | 2.0 | 2.0 | 1170 | $2,375 | $2.03 | 4d | 3 | 0.05mi |
| 5900 SW 127th Ave Miami, FL | 2.0 | 2.0 | 1170 | $2,475 | $2.12 | 24d | 2 | 0.11mi |
| 12775 SW 59th St Miami, FL | 3.0 | 2.0 | 1411 | $3,700 | $2.62 | 17d | 1 | 0.21mi |
| 12775 SW 59th St Miami, FL | 3.0 | 2.0 | 1411 | $3,700 | $2.62 | 24d | 1 | 0.21mi |
| 6203 SW 131st Ct #103 Miami, FL | 2.0 | 2.0 | 820 | $2,250 | $2.74 | 5d | 1 | 0.39mi |
| 6205 SW 131st Ct #203 Miami, FL | 2.0 | 2.0 | 820 | $2,300 | $2.80 | 21d | 1 | 0.41mi |
| 6230 SW 129th Pl #1210 Miami, FL | 2.0 | 2.0 | 1070 | $2,700 | $2.52 | 14d | 1 | 0.45mi |
| 6140 SW 129th Pl #2007 Miami, FL | 3.0 | 2.5 | 1355 | $2,600 | $1.92 | 14d | 1 | 0.45mi |
| 13220 SW 58th Ter Unit 16-1 Miami, FL | 3.0 | 2.5 | 1190 | $2,800 | $2.35 | 24d | 1 | 0.49mi |
| 13007 SW 50th Ln Miami, FL | 3.0 | 1.0 | 1015 | $2,800 | $2.76 | 24d | 1 | 0.49mi |
| 12990 SW 63rd Ter #605 Miami, FL | 1.0 | 1.0 | 711 | $1,950 | $2.74 | 24d | 1 | 0.50mi |
| 12705 SW 66th Terrace Dr Unit 12705 Miami, FL | 3.0 | 2.5 | 1472 | $3,100 | $2.11 | 24d | 1 | 0.53mi |
| 12736 SW 66th Terrace Dr Unit 12736 Miami, FL | 2.0 | 1.0 | 1025 | $2,450 | $2.39 | 24d | 1 | 0.55mi |
| 12955 SW 66th Ln Unit 203-2 Miami, FL | 3.0 | 2.0 | 1030 | $2,800 | $2.72 | 17d | 1 | 0.57mi |
| 12955 SW 66th Ln Unit 212-2 Miami, FL | 2.0 | 2.0 | 890 | $2,000 | $2.25 | 24d | 1 | 0.57mi |
| 6445 SW 130th Pl #610 Miami, FL | 2.0 | 2.0 | 950 | $2,300 | $2.42 | 24d | 1 | 0.58mi |
| 12960 SW 66th Ln Unit 14 Miami, FL | 2.0 | 2.0 | 890 | $2,150 | $2.42 | 24d | 1 | 0.58mi |
| 6425 SW 130th Pl #704 Miami, FL | 2.0 | 2.0 | 950 | $2,200 | $2.32 | 16d | 1 | 0.59mi |
| 6425 SW 130th Pl #704 Miami, FL | 2.0 | 2.0 | 950 | $2,200 | $2.32 | 10d | 1 | 0.59mi |
| 13330 SW 59th Ter Miami, FL | 3.0 | 2.0 | 1258 | $2,800 | $2.23 | 4d | 1 | 0.61mi |
| 13335 SW 57th Ter Unit 83 Miami, FL | 2.0 | 1.5 | 936 | $2,500 | $2.67 | 3d | 1 | 0.62mi |
| 13120 SW 64th Ter #1504 Miami, FL | 2.0 | 2.0 | 950 | $2,300 | $2.42 | 7d | 1 | 0.64mi |
| 13045 SW 68th St #102 Miami, FL | 2.0 | 2.0 | 1180 | $2,200 | $1.86 | 24d | 1 | 0.66mi |
| 6795 SW 132nd Ave #203 Miami, FL | 2.0 | 2.0 | 956 | $2,300 | $2.41 | 15d | 1 | 0.68mi |
| 13404 SW 62nd St Unit 110L Miami, FL | 3.0 | 2.5 | 1360 | $2,950 | $2.17 | 24d | 1 | 0.71mi |
| 6834 SW 128th Pl Unit 6834 Miami, FL | 3.0 | 2.5 | 1472 | $3,100 | $2.11 | 13d | 1 | 0.76mi |
| 6911 SW 129th Ave #5 Miami, FL | 2.0 | 2.0 | 812 | $2,100 | $2.59 | 24d | 1 | 0.78mi |
| 13495 SW 62nd St Miami, FL | 3.0 | 2.0 | 1150 | $3,100 | $2.70 | 24d | 1 | 0.78mi |
| 13466 SW 62nd St Unit 101B Miami, FL | 2.0 | 2.5 | 1160 | $2,600 | $2.24 | 7d | 1 | 0.79mi |
| 6921 SW 129th Ave #5 Miami, FL | 2.0 | 2.0 | 812 | $2,050 | $2.52 | 24d | 1 | 0.79mi |
| 7011 SW 129th Ave #5 Miami, FL | 2.0 | 2.0 | 812 | $2,175 | $2.68 | 20d | 1 | 0.84mi |
| 4933 SW 135th Pl Unit 4933 Miami, FL | 2.0 | 1.0 | 864 | $2,500 | $2.89 | 7d | 1 | 0.85mi |
| 13561 SW 62nd St #169 Miami, FL | 3.0 | 2.0 | 1150 | $2,750 | $2.39 | 24d | 1 | 0.86mi |
| 7121 SW 129th Ave #8 Miami, FL | 2.0 | 2.0 | 810 | $2,200 | $2.72 | 24d | 1 | 0.91mi |
| 12704 SW 71st Ter Miami, FL | 3.0 | 2.0 | 1183 | $2,900 | $2.45 | 7d | 1 | 0.92mi |
| 13311 SW 46th St Miami, FL | 3.0 | 2.0 | 1357 | $3,200 | $2.36 | 24d | 1 | 0.92mi |
| 13520 SW 64th Ln Unit 13522 Miami, FL | 3.0 | 2.0 | 1227 | $3,200 | $2.61 | 2d | 1 | 0.93mi |
| 4306 SW 131st Ave Miami, FL | 3.0 | 1.0 | 1015 | $2,700 | $2.66 | 19d | 1 | 1.03mi |
HOA detail condo
- Monthly dues
- $598 · $7,176/yr
- Likely covers
- poolsecurityparking
- Assessments
- None detected in remarks — confirm with the listing agent.
Listing history 15 events
-
2026-06-17days on market $254,900 Active 69 DOM
-
2026-06-16days on market $254,900 Active 68 DOM
-
2026-06-15days on market $254,900 Active 67 DOM
-
2026-06-13days on market $254,900 Active 65 DOM
-
2026-06-09days on market $254,900 Active 61 DOM
-
2026-06-08days on market $254,900 Active 60 DOM
-
2026-06-07days on market $254,900 Active 59 DOM
-
2026-06-04days on market $254,900 Active 56 DOM
-
2026-06-03days on market $254,900 Active 55 DOM
-
2026-06-02days on market $254,900 Active 54 DOM
-
2026-06-01days on market $254,900 Active 53 DOM
-
2026-05-31days on market $254,900 Active 52 DOM
-
2026-05-13price $254,900
-
2026-04-08$265,000 Active
-
1983-11-01soldstatus $61,900
ⓘ Source: listings_history table (triggers on properties + properties_extension) + one-shot
backfill from property_details.listing_events for pre-trigger history.
Tax reassessment forecast FL · Resets to sale price
- Current annual tax
- $679 · $57/mo
- Projected year-2 tax
- $2,116 · $176/mo
- Expected delta
- +$1,437/yr (+$120/mo · 211.8%)
ⓘ Screening estimate from a state-policy table — verify with the county assessor before closing.
Climate risk First Street
- Flood 1/10 Low FEMA zone X · 0% chance over 30 yrs
- Wildfire 1/10 Low
- Heat 10/10 Extreme 7 d/yr ≥105°F today · 30 d/yr by 30 yrs out
- Wind 10/10 Extreme 99% chance of damaging wind over 30 yrs
- Air quality 2/10 Low 1 unhealthy d/yr today · 1 by 30 yrs out
Nearby sold comps map
Loading sold comps map…
Walkable amenities ~0.75 mi
Loading nearby amenities…
Taxation est. · year 1
- Rental income
- $30,478
- − Mortgage interest
- −$14,278
- − Property taxes
- −$679
- − Insurance
- −$1,274
- − Repairs & maintenance
- −$2,438
- − Management
- −$2,438
- − HOA
- −$7,176
- − Depreciation
- −$7,415
- Taxable loss
- −$5,221
- Est. tax savings @ 24.0%
- +$1,253
- After-tax cash flow
- $161/yr
For passive investors: Depreciation is non-cash, so a rental often shows a tax loss while cash-flowing — sheltering income. Rental losses are passive: they offset passive income freely, and up to $25,000/yr can offset ordinary (W-2) income if you actively participate and your MAGI is under $100k (phasing out to $0 by $150k); unused losses carry forward. On sale, claimed depreciation is recaptured at up to 25%, and gains may owe capital-gains tax (a 1031 exchange can defer both). Figures are a year-1 estimate at your 24.0% rate — not tax advice; consult a CPA.
Schools (NCES district)
- District
- Miami-Dade
- NCES district ID
- 1200390
- Math proficiency
- 45% ▼ -16.00%
- Reading proficiency
- 54% ▼ -5.00%
- Median HH income
- $43,928
- Composite
- 41.76/100
- National rank
- #3397
- State rank
- #40 of 73 in FL
Livability — Kendale Lakes
- Score
- 77/100
- State rank
- #186
- US rank
- #2923
Category grades
Schools grade is shown separately in the Schools card above.
Census & demographics
- Census place
- Kendale Lakes, FL
- County
- Miami-Dade County · 2,697,751 people
- City population
- 33,811
- Metro
- Miami-Fort Lauderdale-Pompano Beach, FL
- Population (ZIP)
- 33,527
- Household income
- $70,218
- Rent vs Own
- Severe rent burden
- 1416.0
Population outlook (Miami-Dade County) Hauer SSP2
- Today (2025)
- 3,126,439 people
- By 2030
- 3,325,765 · +6.4%
- By 2040
- 3,697,561 · +18.3%
- By 2050
- 4,012,134 · +28.3%
- By 2075
- 4,605,612 · +47.3%
- By 2100
- 4,866,598 · +55.7%
Race, ethnicity, and origin ACS 2023
- Neighborhood character
- Predominantly Hispanic (84%)
- Race & ethnicity
- Hispanic / Latino 84% Two or more races 52% White 13% Black 1% Asian 1%
- Hispanic origin (detail)
- Mexican 1% Puerto Rican 2% Cuban 53% Dominican 1%
- Common ancestry
- Romanian 1%
- Foreign-born
- 63% · Canada, Jamaica
- Languages at home
- 15% English-only · Spanish 83% French/Haitian/Cajun 1% Other Indo-European 1%
Political lean MEDSL · Miami-Dade
- 2024 margin
- R (+11.4) · D 43.9% · R 55.4%
- 2008→2024 swing
- -27.6pp toward R · 2008: 16.1pp · 2024: -11.4pp
- All cycles
- 2024: R+11.4 2020: D+7.3 2016: D+29.6 2012: D+23.7 2008: D+16.1
Not yet ingested
- Civics
- —
Market trends
- HPI YoY
- ▼ -331.51%
- Current HPI
- 385.8798
- Rent YoY
- ▼ -0.10%
- Metro
- Miami-Fort Lauderdale-Pompano Beach, FL
- State GDP YoY
- ▲ 3.28%
- F500 in state
- 36
Industry mix (Fortune 500 HQ in FL)
| Industry | F500 HQs | Revenue |
|---|---|---|
| Industrial Technology | 2 | $29B |
|
||
| Insurance | 2 | $17B |
|
||
| Retail | 1 | $60B |
|
||
| Technology Distribution | 1 | $58B |
|
||
| Homebuilding | 1 | $35B |
|
||
| Technology Manufacturing | 1 | $35B |
|
||
Price history
+311.8% since first listed3 events — show timeline
- 2026-05-13 Price Changed $254,900 MARMLS
- 2026-04-08 Listed $265,000 MARMLS
- 1983-11-01 Sold (Public Records) $61,900 Public Records
Property tax history
+1.5%/yrLatest (2025): $679 · +4.8% YoY. Source: county tax records.
Cash-flow waterfall
monthlySold comps — $/sqft
last 12 mo · ≤1 miLoading sold comps…