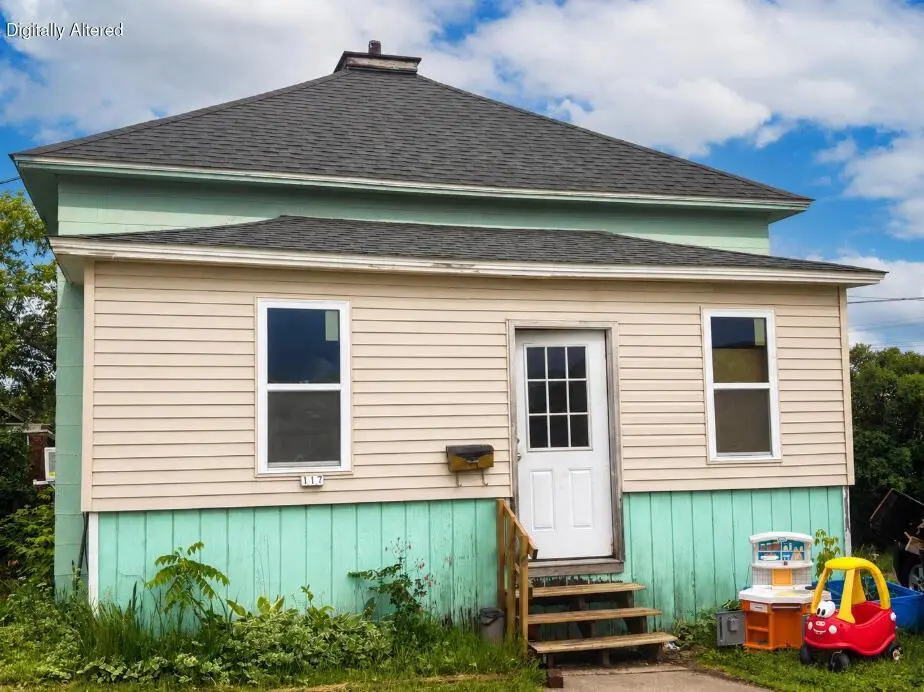
117 W Frederick St · Rhinelander, WI
Flood risk 1/10 · Minimal
- FEMA flood zone
- X (unshaded)
- Chance of flooding over 30 yrs
- 0.0%
- Est. flood insurance / yr
- $473 – $860
Fire risk 3/10 · Minor
- Est. fire insurance / yr
- $636 – $1,182
Heat risk 1/10 · Minimal
- Hot days now (above 91°F)
- 7 days/yr
- Hot days in 30 yrs
- 13 days/yr
Wind risk 1/10 · Minimal
- Chance of severe wind over 30 yrs
- —
Air-quality risk 1/10 · Minimal
- Unhealthy air days now
- 0 days/yr
- Unhealthy air days in 30 yrs
- 0 days/yr
Risk factors via First Street. Map © Google.
Why this score? — see what drove the B- grade
The composite is a weighted blend of 9 inputs, each scored 0–100. Each bar is that input's sub-score; the figure is the points it added to the 100-point composite (weight × sub-score).
- Cash flow +30.0/30.0
- 1% rule +10.0/10.0
- DSCR +10.0/10.0
- ARV discount +7.5/15.0
- Livability +3.9/5.0
- Schools +2.7/10.0
- Rent growth +2.5/5.0
- Condition / age +2.5/5.0
- Appreciation +0.0/10.0
$55,000
🖨 Deal sheet 📄 Offer letter ✓ Due diligence
Listing remarks
Opportunity awaits in this 3-bedroom, 1-bath home. This property is ready for renovation and would make a great project for investors, flippers, or buyers looking to build equity. The home requires significant repairs and updates throughout, providing the chance to restore, reimagine, or reinvent the space to fit your vision. Convenient location with plenty of potential to add value. Property is being sold strictly As-Is. Seller requires 7-14 days post closing occupancy.
Key facts
- 2,178 sq ft lot
- Built 1913
- Listed 8 days
Property features AI
Exterior
- Utilities: Municipal water; Municipal sewer
- Home design: 1.5-story single-family home; Less than 1/2 acre lot
- Construction: Built by owner (year source: owner)
- Exterior features: Vinyl and wood exterior; Sidewalks; Garden shed
Interior
- Kitchen: Range included
- Bedrooms: Master bedroom (Main) — 13 x 11; Bedroom 2 (Main) — 11 x 10; Bedroom 3 (Upper) — 12 x 10
- Bathrooms: 1 full bathroom
- Heating & cooling: Forced air heating; Natural gas heat
- Interior features: Full basement; Shower over tub
Neighborhood map
What this means for you Summary
Snapshot
- This is a 3-bed/1.0-bath other listed at $55k.
Deal economics
- At list price, monthly cash flow is $527 ($6k/yr) — positive.
- The deal already cash-flows at list — no discount required.
- Meets the 1% rule at list price ($1k rent vs $55k).
- Cap rate 17.8% vs local median 3.9% in Rhinelander — top-decile yield for the area; either an underpriced asset or a hidden risk that comps aren't pricing in. Stress-test before assuming the spread holds.
Location & tenants
- Location reads 77/100 on livability (#112 in WI, #2,876 nationally) — a middle-class / working-renter tenant base. Strengths: cost of living A+, housing A+, health & safety A+; Watch: employment D+, schools F, amenities F.
- Rhinelander School District (rural): math 31% / reading 31% proficiency, ranked #266 of 342 in WI (top 78%) — families likely to look elsewhere, expect single-tenant / working-renter base with shorter leases.
- Market conditions: 113 active listings in the ZIP; 3 comparable units currently listed for rent nearby; rentals lingering (median 44d on market — plan ~5-8 weeks vacancy on turnover, expect pricing pressure); 100% of comp listings sitting > 30 days — soft ceiling on asking rent; 307 units permitted in Oneida County in 2024 (0 in 5+ unit buildings).
Forward outlook
- Local home prices are declining (-3.0%/yr); year-one equity from $380 of loan paydown is wiped out by about $2k of value loss. Plan a longer hold.
- Oneida County population projected at -20% by 2050 — secular population decline; favor cash flow + early exit over multi-decade hold.
- At projected returns (-3.0% appreciation + 3.0% rent growth), your $15k cash investment doubles in ~3 years — after that, you're playing with house money.
Negotiation context
- Only 9 days on market — expect competitive offers; lowballing is unlikely to land.
- 2 sale attempts since 17y ago; this cycle's ask has dropped $10k (15%) from the opening price — seller is motivated, your offer sets the floor, not the list.
- Current owner paid $43k; 28% above their basis — modest negotiation headroom, anchor on the comps not their cost.
Risks & watch-outs
- Watch-outs: property tax is 3.6% of price; built in 1913 — expect roof / HVAC / electrical / plumbing capex.
Questions for the listing agent
- Built in 1913 — when were the roof, HVAC, electrical panel, plumbing, and water heater last replaced?
- Property tax is high relative to price — has the assessment been appealed recently, and will the sale trigger a re-assessment?
- Is there a deadline driving the sale (1031 exchange, divorce, estate, relocation)? That informs how much negotiation room exists.
- Schools are F-rated, which usually means shorter tenancies and higher turnover. Who's the typical renter profile here, and what's been the actual vacancy rate?
- What's the average days-on-market for RENTAL listings here right now (not sales)? A rising rental-DOM trend means longer vacancies and softer asking-rent achievability than the comps imply.
- What's the recent tenant-quality profile in this submarket — average credit score on applications, eviction rate, late-payment / NSF rate, and stable-employment percentage? A property-management company in the area should have these aggregated.
- How much new for-sale + rental construction is in the pipeline within 1–3 miles? Heavy new supply typically softens prices + rents 12–24 months out; constrained supply supports both.
Investment metrics
- 1% rule
- 2.31% ✓
- Cap rate
- 17.79%
- Cash-on-cash
- 41.07%
- DSCR
- 2.83
- GRM
- 3.6
CMA / ARV
No comps found within radius.
Projected returns pro-forma
-3.0% appreciation · 3.0% rent growth · sell at horizon
- IRR
- 37.7%
- Equity multiple
- 2.61×
- Total profit
- $24,731
- Equity at exit
- $8,201
- IRR
- 44.2%
- Equity multiple
- 5.23×
- Total profit
- $65,074
- Equity at exit
- $4,755
Cash invested: $15,400 (down + closing). Projections, not guarantees.
Landlord ↔ Tenant lean methodology
- Overall (STATE)
- 73 Landlord-Friendly
- State Wisconsin
- 73 Landlord-Friendly · R+2
- County
- — inherits STATE
- City
- — inherits STATE
ZIP-level market 54501
- Active inventory
- 113
- Price-to-rent
- 3.6×
Monthly cashflow live
- Estimated rent
- $1,269 medium interval (Pro) →
- Mortgage (P&I)
- −$288
- Tax from tax record
- −$164 /mo · $1,973/yr
- Insurance
- −$23
- HOA
- −$0
- Vacancy / Maint / Mgmt
- −$267
- Net cashflow
- $527
Break-even live
UW: 25.0% down · 7.5% · 30yr · 1.5% tax · 5.0% vac · 8.0% maint · 8.0% mgmt
Financing live
Cash to close
- Down payment
- $13,750
- Closing costs
- $1,650
- Reserves months
- —
- Total cash needed
- —
Loan-product check · same deal, 3 products live
Conventional
25% down · 7.5% · 30yr
- Down + closing
- —
- Monthly P&I
- —
- Monthly cashflow
- —
- DSCR
- —
- Eligible?
- —
Personal DTI + credit; lowest rate.
DSCR
20% down · 8.5% · 30yr
- Down + closing
- —
- Monthly P&I
- —
- Monthly cashflow
- —
- DSCR
- —
- Eligible?
- —
No personal income docs; deal must DSCR.
Hard money
10% down · 12.0% · 12mo
- Down + closing
- —
- Monthly P&I
- —
- Monthly cashflow
- —
- DSCR
- —
- Eligible?
- —
Short-term bridge; refi at stabilization.
Rent comps 3 comps
| Address | Beds | Baths | Sqft | Rent | $/sqft | DOM | Units | Dist |
|---|---|---|---|---|---|---|---|---|
| 224 Maple Park Dr Rhinelander, WI | 3.0 | 1.5 | 1000 | $1,375 | $1.38 | 43d | 1 | 0.60mi |
| 942 N Stevens St Rhinelander, WI | 2.0 | 1.0 | 800 | $1,275 | $1.59 | 43d | 1 | 0.68mi |
| 180 W Hill Rd Unit 3 Rhinelander, WI | 2.0 | 1.0 | 1000 | $1,075 | $1.07 | 43d | 1 | 1.06mi |
Listing history 9 events
-
2026-06-18days on market $55,000 Active 9 DOM
-
2026-06-18price $55,000 Active 8 DOM
-
2026-06-17days on market $65,000 Active 8 DOM
-
2026-06-16days on market $65,000 Active 7 DOM
-
2026-06-15days on market $65,000 Active 6 DOM
-
2026-06-15days on market $65,000 Active 5 DOM
-
2026-06-13days on market $65,000 Active 4 DOM
-
2026-06-12remarks 475-char remark
-
2026-06-12$65,000 Active 3 DOM
ⓘ Source: listings_history table (triggers on properties + properties_extension) + one-shot
backfill from property_details.listing_events for pre-trigger history.
Tax reassessment forecast WI · Partial reset (capped growth)
- Current annual tax
- $1,973 · $164/mo
- Projected year-2 tax
- $1,973 · $164/mo
- Expected delta
- $0/yr ($0/mo · 0.0%)
ⓘ Screening estimate from a state-policy table — verify with the county assessor before closing.
Climate risk First Street
- Flood 1/10 Low FEMA zone X (unshaded) · 0% chance over 30 yrs
- Wildfire 3/10 Moderate
- Heat 1/10 Low 7 d/yr ≥91°F today · 13 d/yr by 30 yrs out
- Wind 1/10 Low
- Air quality 1/10 Low 0 unhealthy d/yr today · 0 by 30 yrs out
Nearby sold comps map
Loading sold comps map…
Walkable amenities ~0.75 mi
Loading nearby amenities…
Taxation est. · year 1
- Rental income
- $15,232
- − Mortgage interest
- −$3,081
- − Property taxes
- −$1,973
- − Insurance
- −$275
- − Repairs & maintenance
- −$1,219
- − Management
- −$1,219
- − Depreciation
- −$1,600
- Taxable income
- $5,866
- Est. tax owed @ 24.0%
- −$1,408
- After-tax cash flow
- $4,916/yr
For passive investors: Depreciation is non-cash, so a rental often shows a tax loss while cash-flowing — sheltering income. Rental losses are passive: they offset passive income freely, and up to $25,000/yr can offset ordinary (W-2) income if you actively participate and your MAGI is under $100k (phasing out to $0 by $150k); unused losses carry forward. On sale, claimed depreciation is recaptured at up to 25%, and gains may owe capital-gains tax (a 1031 exchange can defer both). Figures are a year-1 estimate at your 24.0% rate — not tax advice; consult a CPA.
Schools (NCES district)
- District
- Rhinelander School District
- NCES district ID
- 5512720
- Math proficiency
- 31% ▼ -2.00%
- Reading proficiency
- 31% ▼ -1.00%
- Median HH income
- $47,165
- Composite
- 26.77/100
- National rank
- #7130
- State rank
- #266 of 342 in WI
Livability — Rhinelander
- Score
- 77/100
- State rank
- #112
- US rank
- #2876
Category grades
Schools grade is shown separately in the Schools card above.
Census & demographics
- Census place
- Rhinelander, WI
- Population (ZIP)
- 21,096
Population outlook (Oneida County) Hauer SSP2
- Today (2025)
- 34,468 people
- By 2030
- 33,373 · -3.2%
- By 2040
- 30,391 · -11.8%
- By 2050
- 27,438 · -20.4%
- By 2075
- 23,041 · -33.2%
- By 2100
- 18,405 · -46.6%
Race, ethnicity, and origin ACS 2023
- Neighborhood character
- Predominantly White (94%)
- Race & ethnicity
- White 94% Two or more races 4% Hispanic / Latino 2%
- Common ancestry
- Romanian 9% Portuguese 6% Lithuanian 2%
- Foreign-born
- 1% · Canada
- Languages at home
- 98% English-only · Spanish 1% Other Asian/Pacific 1%
Political lean MEDSL · Oneida
- 2024 margin
- R (+17.6) · D 40.6% · R 58.2% · Other 1.2%
- 2008→2024 swing
- -28.0pp toward R · 2008: 10.4pp · 2024: -17.6pp
- All cycles
- 2024: R+17.6 2020: R+14.8 2016: R+17.1 2012: R+2.2 2008: D+10.4
Not yet ingested
- Civics
- —
Market trends
- HPI YoY
- ▼ -187.57%
- Current HPI
- 179.0345
- Rent YoY
- —
- Metro
- —
- State GDP YoY
- ▲ 2.10%
- F500 in state
- 20
Industry mix (Fortune 500 HQ in WI)
| Industry | F500 HQs | Revenue |
|---|---|---|
| Industrial Machinery | 4 | $23B |
|
||
| Industrial Technology | 2 | $36B |
|
||
| Insurance | 1 | $36B |
|
||
| Professional Services | 1 | $19B |
|
||
| Utilities | 1 | $9B |
|
||
| Consumer Goods | 1 | $3B |
|
||
Price history
+209.5% since first listed4 events — show timeline
- 2026-06-09 Listed $65,000 METROMLS
- 2010-04-20 Sold (Public Records) $43,000 Public Records
- 2009-07-02 Listed $51,900 GNMLS
- 2008-07-01 Sold (Public Records) $21,000 Public Records
Property tax history
+7.0%/yrLatest (2025): $1,973 · +135.5% YoY. Source: county tax records.
Cash-flow waterfall
monthlySold comps — $/sqft
last 12 mo · ≤1 miLoading sold comps…