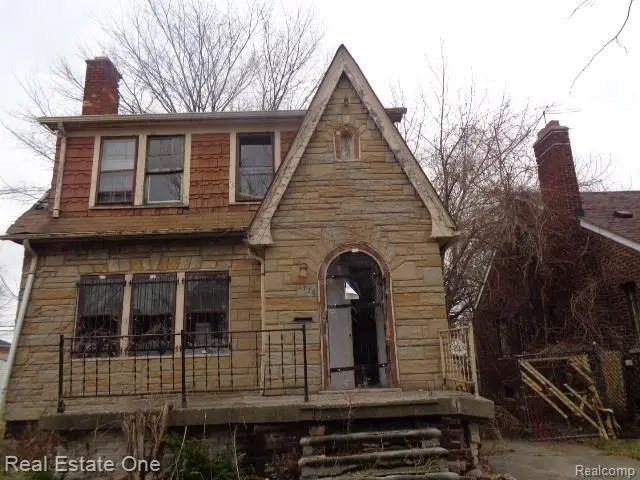
5776 Lakeview St · Detroit, MI
Flood risk 1/10 · Minimal
- FEMA flood zone
- X (unshaded)
- Chance of flooding over 30 yrs
- 0.0%
- Est. flood insurance / yr
- $473 – $860
Fire risk 1/10 · Minimal
- Est. fire insurance / yr
- $784 – $1,456
Heat risk 3/10 · Minor
- Hot days now (above 96°F)
- 7 days/yr
- Hot days in 30 yrs
- 15 days/yr
Wind risk 2/10 · Minimal
- Chance of severe wind over 30 yrs
- —
Air-quality risk 3/10 · Minor
- Unhealthy air days now
- 2 days/yr
- Unhealthy air days in 30 yrs
- 5 days/yr
Risk factors via First Street. Map © Google.
Why this score? — see what drove the D grade
The composite is a weighted blend of 9 inputs, each scored 0–100. Each bar is that input's sub-score; the figure is the points it added to the 100-point composite (weight × sub-score).
- Cash flow +15.0/30.0
- ARV discount +7.5/15.0
- 1% rule +5.0/10.0
- DSCR +5.0/10.0
- Livability +3.7/5.0
- Rent growth +2.5/5.0
- Condition / age +2.5/5.0
- Schools +1.3/10.0
- Appreciation +0.0/10.0
$12,500
🖨 Deal sheet 📄 Offer letter ✓ Due diligence
Listing remarks MLS
Welcome to the latest offering from the Detroit Land Bank Authority. This 3 bedroom brick colonial is being offered in the historic Chandler Park community. This home needs a full rehab but once complete will make a very good investment. Be advised that this home also includes vacant lots located at 5782 and 5790 Lakeview for an additional 8000 sqft. of buildable space. Please note that the Detroit Land bank Authority is entitled to a tax capture for the 5 tax years subsequent to transferring ownership of the property. The tax capture may be incompatible with tax abatements and/or lot combinations that are otherwise available to the selected purchaser. DLBA will review requests to waive its tax capture rights and may require a payment in lieu of taxes to approve such requests. The payment will be determined upon reviewing the development proforma and effect of any tax abatements on the purchase and development financing. Please refer to DLBA proposal guidelines
Key facts
- Buildable space
- 3,920 sq ft lot
- 2 garage spots
Tags
Neighborhood map
What this means for you Summary
Snapshot
- This is a 3-bed/1.0-bath single-family listed at $12k.
Deal economics
- At list price, monthly cash flow is $1k ($12k/yr) — positive.
- The deal already cash-flows at list — no discount required.
- Meets the 1% rule at list price ($1k rent vs $12k).
- Recommended offer: $11k (12.0% below list) — sets the bar for market timing.
- Cap rate 104.3% vs local median 10.2% in Detroit — top-decile yield for the area; either an underpriced asset or a hidden risk that comps aren't pricing in. Stress-test before assuming the spread holds.
Location & tenants
- Location reads 73/100 on livability (#218 in MI) — a middle-class / working-renter tenant base. Strengths: amenities A+, commute A+, cost of living A+; Watch: schools F, crime F, employment F.
- Detroit Public Schools Community District (urban): math 10% / reading 24% proficiency, ranked #499 of 540 in MI (top 92%) — low school quality limits family demand, transient renter base, plan for 1-2y turnover; 90% free/reduced lunch — lower-income household profile, screen leases tightly.
- Market conditions: 190 active listings in the ZIP; 38 comparable units currently listed for rent nearby; rentals at typical pace (median 17d on market — plan ~3-4 weeks tenant-placement turnaround); lower-income renter base — watch delinquency; 2,639 units permitted in Wayne County in 2024 (1,216 in 5+ unit buildings).
- At $1,402/mo this rent would consume 49% of the median local household income ($34k/yr) (locally 1202% of renters already pay >50% of income on rent) — very limited rent-growth headroom before tenants either downsize or default.
Forward outlook
- Local home prices are declining (-3.0%/yr); year-one equity from $86 of loan paydown is wiped out by about $375 of value loss. Plan a longer hold.
- Wayne County population projected at -17% by 2050 — secular population decline; favor cash flow + early exit over multi-decade hold.
- At projected returns (-3.0% appreciation + 3.0% rent growth), your $4k cash investment doubles in ~1 year — after that, you're playing with house money.
Negotiation context
- It's been on market 153 days — a 12% lower offer ($11k) is reasonable based on typical stale-listing flexibility.
- 11 sale attempts since 20y ago with the ask held roughly flat each time — persistent listings suggest the price (not the market) is what's stuck; bring a comps-based counter.
Risks & watch-outs
- Watch-outs: built in 1927 — expect roof / HVAC / electrical / plumbing capex.
Questions for the listing agent
- It's been on market 153 days. Have you received any prior offers? Is the seller open to a 12% concession, seller financing, or rate buy-down credit?
- Built in 1927 — when were the roof, HVAC, electrical panel, plumbing, and water heater last replaced?
- Why hasn't it sold? Are there any deal-killer items the seller is aware of (foundation, flood, title, zoning, code violations)?
- Is there a deadline driving the sale (1031 exchange, divorce, estate, relocation)? That informs how much negotiation room exists.
- Schools are F-rated, which usually means shorter tenancies and higher turnover. Who's the typical renter profile here, and what's been the actual vacancy rate?
- Crime grade is F in this area — have there been break-ins, vandalism, or insurance claims at this property in the last 3 years? What carrier currently insures it and at what premium?
- The area grade is low — what's the realistic commute time and amenity access for the typical tenant pool here? Any planned neighborhood developments (good or bad) we should know about?
- What's the average days-on-market for RENTAL listings here right now (not sales)? A rising rental-DOM trend means longer vacancies and softer asking-rent achievability than the comps imply.
- What's the recent tenant-quality profile in this submarket — average credit score on applications, eviction rate, late-payment / NSF rate, and stable-employment percentage? A property-management company in the area should have these aggregated.
- How much new for-sale + rental construction is in the pipeline within 1–3 miles? Heavy new supply typically softens prices + rents 12–24 months out; constrained supply supports both.
Investment metrics
- 1% rule
- 11.22% ✓
- Cap rate
- 104.33%
- Cash-on-cash
- 350.15%
- DSCR
- 16.58
- GRM
- 0.7
CMA / ARV
- ARV (median comp)
- $64,569
- List price
- $12,500
- Delta
- -80.64%
- Verdict
- UNDERPRICED
- Comps
- 20 within 1.0 mi
Show comp detail 12 sales within ~0.75 mi
| Address | Dist | Beds/Ba | Sqft | Sold | Price | $/sf | Match |
|---|---|---|---|---|---|---|---|
| 5557 Lakeview St | 0.14mi | 3/1.0 | 1,233 (-5%) | 4mo | $40,000 | $32 | 82 |
| 13113 Camden St | 0.46mi | 3/1.0 | 1,224 (-6%) | 2mo | $88,000 | $72 | 67 |
| 5794 Dickerson St | 0.21mi | 3/1.0 | 1,467 (+13%) | 4mo | $118,000 | $80 | 65 |
| 13334 Elmdale St | 0.66mi | 3/1.0 | 1,221 (-6%) | 3mo | $89,254 | $73 | 57 |
| 5545 Maryland St | 0.61mi | 4/1.0 (+1) | 1,251 (-4%) | 6mo | $140,000 | $112 | 56 |
| 9131 Wayburn St | 0.65mi | 3/1.5 | 1,222 (-6%) | 6mo | $100,000 | $82 | 53 |
| 13136 Maiden St | 0.53mi | 4/1.0 (+1) | 1,144 (-12%) | 1mo | $10,000 | $9 | 50 |
| 9200 Manistique St | 0.60mi | 3/1.0 | 1,135 (-13%) | 4mo | $69,500 | $61 | 48 |
| 14480 Wade St | 0.59mi | 2/2.0 (-1) | 1,406 (+8%) | 6mo | $122,500 | $87 | 44 |
| 11156 E Outer Dr | 0.71mi | 3/1.5 | 1,153 (-11%) | 7mo | $55,000 | $48 | 40 |
| 12798 Corbett St | 0.65mi | 3/1.5 | 1,124 (-14%) | 6mo | $75,000 | $67 | 40 |
| 5566 LAKEPOINTE S S. Chandler Park St | 0.69mi | 3/1.5 | 1,108 (-15%) | 3mo | $57,000 | $51 | 39 |
Match score weights: distance 35% · size 25% · config 20% · recency 20%. Top-matched comps best support the ARV.
Projected returns pro-forma
-3.0% appreciation · 3.0% rent growth · sell at horizon
- IRR
- —
- Equity multiple
- 19.01×
- Total profit
- $63,041
- Equity at exit
- $1,864
- IRR
- —
- Equity multiple
- 40.64×
- Total profit
- $138,736
- Equity at exit
- $1,081
Cash invested: $3,500 (down + closing). Projections, not guarantees.
Landlord ↔ Tenant lean methodology
- Overall (STATE)
- 62 Landlord-Friendly
- State Michigan
- 62 Landlord-Friendly · EVEN
- County
- — inherits STATE
- City
- — inherits STATE
ZIP-level market 48213
- Active inventory
- 190
- Price-to-rent
- 0.7×
Monthly cashflow live
- Estimated rent
- $1,402 high interval (Pro) →
- Mortgage (P&I)
- −$66
- Tax est. 1.5%
- −$16 /mo · $188/yr
- Insurance
- −$5
- HOA
- −$0
- Vacancy / Maint / Mgmt
- −$294
- Net cashflow
- $1,021
Break-even live
UW: 25.0% down · 7.5% · 30yr · 1.5% tax · 5.0% vac · 8.0% maint · 8.0% mgmt
Financing live
Cash to close
- Down payment
- $3,125
- Closing costs
- $375
- Reserves months
- —
- Total cash needed
- —
Loan-product check · same deal, 3 products live
Conventional
25% down · 7.5% · 30yr
- Down + closing
- —
- Monthly P&I
- —
- Monthly cashflow
- —
- DSCR
- —
- Eligible?
- —
Personal DTI + credit; lowest rate.
DSCR
20% down · 8.5% · 30yr
- Down + closing
- —
- Monthly P&I
- —
- Monthly cashflow
- —
- DSCR
- —
- Eligible?
- —
No personal income docs; deal must DSCR.
Hard money
10% down · 12.0% · 12mo
- Down + closing
- —
- Monthly P&I
- —
- Monthly cashflow
- —
- DSCR
- —
- Eligible?
- —
Short-term bridge; refi at stabilization.
Rent comps 38 comps
| Address | Beds | Baths | Sqft | Rent | $/sqft | DOM | Units | Dist |
|---|---|---|---|---|---|---|---|---|
| 5966 Eastlawn St Unit NA Detroit, MI | 3.0 | 1.5 | 1366 | $1,500 | $1.10 | 24d | 1 | 0.13mi |
| 5747 Lakepointe St Detroit, MI | 3.0 | 1.5 | 1316 | $1,473 | $1.12 | 43d | 1 | 0.65mi |
| 13137 Elmdale St Detroit, MI | 3.0 | 1.0 | 1115 | $1,400 | $1.26 | 24d | 1 | 0.68mi |
| 9168 Wayburn St Detroit, MI | 3.0 | 1.0 | 1274 | $1,300 | $1.02 | 20d | 1 | 0.69mi |
| 13400 Longview St Detroit, MI | 3.0 | 1.5 | 1000 | $1,400 | $1.40 | 43d | 1 | 0.72mi |
| 9400 Lakepointe St Detroit, MI | 3.0 | 1.0 | 1300 | $1,150 | $0.88 | 4d | 1 | 0.77mi |
| 5751 Nottingham Rd Unit 5/21/26 Detroit, MI | 3.0 | 1.0 | 1100 | $1,250 | $1.14 | 14d | 1 | 0.79mi |
| 5791 Somerset Ave Detroit, MI | 3.0 | 2.0 | 1660 | $1,400 | $0.84 | 17d | 1 | 0.85mi |
| 9755 Wayburn St Detroit, MI | 3.0 | 2.0 | 1498 | $1,400 | $0.93 | 3d | 1 | 0.87mi |
| 9409 Balfour Rd Detroit, MI | 3.0 | 1.0 | 1195 | $1,200 | $1.00 | 43d | 1 | 0.96mi |
| 12210 Longview St Detroit, MI | 3.0 | 1.0 | 1020 | $1,100 | $1.08 | 43d | 1 | 0.98mi |
| 9927 Beaconsfield St Detroit, MI | 3.0 | 1.0 | 942 | $1,375 | $1.46 | 14d | 1 | 0.99mi |
| 10141 Roxbury St Detroit, MI | 3.0 | 1.0 | 1115 | $1,000 | $0.90 | 43d | 1 | 1.00mi |
| 5235 Chatsworth St Detroit, MI | 2.0 | 1.0 | 900 | $1,050 | $1.17 | 43d | 1 | 1.02mi |
| 4251 Wayburn St Detroit, MI | 3.0 | 1.5 | 1326 | $1,650 | $1.24 | 43d | 1 | 1.03mi |
| 9984 Beaconsfield St Detroit, MI | 3.0 | 1.0 | 1222 | $1,575 | $1.29 | 43d | 1 | 1.05mi |
| 15857 Evanston St Detroit, MI | 3.0 | 1.5 | 1232 | $1,250 | $1.01 | 4d | 1 | 1.09mi |
| 4391 Nottingham Rd Unit 4393 Detroit, MI | 2.0 | 1.0 | 1038 | $950 | $0.92 | 4d | 1 | 1.09mi |
| 10724 Whitehill St Detroit, MI | 3.0 | 3.0 | 1425 | $1,550 | $1.09 | 17d | 1 | 1.12mi |
| 5574 Buckingham Ave Detroit, MI | 3.0 | 1.0 | 1430 | $1,450 | $1.01 | 4d | 1 | 1.12mi |
| 10644 Stratman St Detroit, MI | 2.0 | 1.0 | 1000 | $1,200 | $1.20 | 17d | 1 | 1.13mi |
| 12840 Kilbourne St Detroit, MI | 3.0 | 1.0 | 1136 | $1,350 | $1.19 | 17d | 1 | 1.16mi |
| 5267 Haverhill St Detroit, MI | 3.0 | 1.5 | 1458 | $1,300 | $0.89 | 16d | 1 | 1.17mi |
| 5267 Haverhill St Detroit, MI | 3.0 | 1.5 | 1458 | $1,300 | $0.89 | 17d | 1 | 1.17mi |
| 10813 Whitehill St Detroit, MI | 3.0 | 1.0 | 1392 | $1,350 | $0.97 | 17d | 1 | 1.17mi |
| 12051 Wilshire Dr Detroit, MI | 3.0 | 1.5 | 1224 | $1,250 | $1.02 | 17d | 1 | 1.19mi |
| 4151 Nottingham Rd Detroit, MI | 2.0 | 1.0 | 1022 | $1,275 | $1.25 | 17d | 1 | 1.21mi |
| 5112 Haverhill St Unit 1 Detroit, MI | 2.0 | 1.0 | 1000 | $1,100 | $1.10 | 43d | 1 | 1.21mi |
| 11018 Whitehill St Detroit, MI | 3.0 | 1.0 | 1146 | $1,450 | $1.27 | 10d | 1 | 1.28mi |
| 5031 Bedford St Detroit, MI | 2.0 | 1.0 | 876 | $1,870 | $2.13 | 1d | 1 | 1.31mi |
| 5028 Bedford St Detroit, MI | 3.0 | 1.0 | 1000 | $1,400 | $1.40 | 4d | 1 | 1.34mi |
| 5045 Fairview St Detroit, MI | 3.0 | 1.0 | 1303 | $1,200 | $0.92 | 43d | 1 | 1.42mi |
| 4627 Bedford St Unit 1 Detroit, MI | 2.0 | 1.0 | 1050 | $945 | $0.90 | 20d | 1 | 1.42mi |
| 8205 E Outer Dr Detroit, MI | 3.0 | 1.5 | 1874 | $1,400 | $0.75 | 17d | 1 | 1.43mi |
| 10803 Roxbury St Detroit, MI | 3.0 | 1.0 | 1150 | $900 | $0.78 | 20d | 1 | 1.48mi |
| 4055 Beniteau St Detroit, MI | 2.0 | 1.0 | 1000 | $900 | $0.90 | 17d | 1 | 1.48mi |
| 9635 Everts St Detroit, MI | 4.0 | 2.0 | 1450 | $1,650 | $1.14 | 43d | 1 | 1.49mi |
| 10404 Somerset Ave Detroit, MI | 3.0 | 1.0 | 1108 | $1,475 | $1.33 | 3d | 1 | 1.50mi |
Listing history 35 events
-
2026-06-18days on market $12,500 Active 153 DOM
-
2026-06-17days on market $12,500 Active 152 DOM
-
2026-06-15days on market $12,500 Active 150 DOM
-
2026-06-13days on market $12,500 Active 148 DOM
-
2026-06-13days on market $12,500 Active 147 DOM
-
2026-06-09days on market $12,500 Active 144 DOM
-
2026-06-08days on market $12,500 Active 143 DOM
-
2026-06-07days on market $12,500 Active 142 DOM
-
2026-06-04days on market $12,500 Active 139 DOM
-
2026-06-03days on market $12,500 Active 138 DOM
-
2026-06-01days on market $12,500 Active 136 DOM
-
2026-05-31days on market $12,500 Active 135 DOM
-
2026-01-16$12,500 Active 975-char remark
Show marketing remark (975 chars)
Welcome to the latest offering from the Detroit Land Bank Authority. This 3 bedroom brick colonial is being offered in the historic Chandler Park community. This home needs a full rehab but once complete will make a very good investment. Be advised that this home also includes vacant lots located at 5782 and 5790 Lakeview for an additional 8000 sqft. of buildable space. Please note that the Detroit Land bank Authority is entitled to a tax capture for the 5 tax years subsequent to transferring ownership of the property. The tax capture may be incompatible with tax abatements and/or lot combinations that are otherwise available to the selected purchaser. DLBA will review requests to waive its tax capture rights and may require a payment in lieu of taxes to approve such requests. The payment will be determined upon reviewing the development proforma and effect of any tax abatements on the purchase and development financing. Please refer to DLBA proposal guidelines
-
2023-12-17historical
-
2023-12-16historical
-
2023-09-09price $19,500
-
2023-09-08price $19,500
-
2023-08-07$24,000 Active
-
2023-08-07$24,000 Active
-
2019-09-01historical
-
2019-09-01historical
-
2019-06-01$10,000
-
2019-06-01$10,000
-
2019-05-31historical
-
2019-05-31historical
-
2019-02-01$9,500
-
2019-02-01$9,500
-
2019-01-31historical
-
2019-01-31historical
-
2018-06-12$10,000
-
2018-06-12$10,000
-
2006-06-30historical
-
2006-01-18$92,000
-
2005-03-02soldstatus $84,000
ⓘ Source: listings_history table (triggers on properties + properties_extension) + one-shot
backfill from property_details.listing_events for pre-trigger history.
Climate risk First Street
- Flood 1/10 Low FEMA zone X (unshaded) · 0% chance over 30 yrs
- Wildfire 1/10 Low
- Heat 3/10 Moderate 7 d/yr ≥96°F today · 15 d/yr by 30 yrs out
- Wind 2/10 Low
- Air quality 3/10 Moderate 2 unhealthy d/yr today · 5 by 30 yrs out
Nearby sold comps map
Loading sold comps map…
Walkable amenities ~0.75 mi
Loading nearby amenities…
Taxation est. · year 1
- Rental income
- $16,825
- − Mortgage interest
- −$700
- − Property taxes
- −$188
- − Insurance
- −$62
- − Repairs & maintenance
- −$1,346
- − Management
- −$1,346
- − Depreciation
- −$364
- Taxable income
- $12,819
- Est. tax owed @ 24.0%
- −$3,077
- After-tax cash flow
- $9,179/yr
For passive investors: Depreciation is non-cash, so a rental often shows a tax loss while cash-flowing — sheltering income. Rental losses are passive: they offset passive income freely, and up to $25,000/yr can offset ordinary (W-2) income if you actively participate and your MAGI is under $100k (phasing out to $0 by $150k); unused losses carry forward. On sale, claimed depreciation is recaptured at up to 25%, and gains may owe capital-gains tax (a 1031 exchange can defer both). Figures are a year-1 estimate at your 24.0% rate — not tax advice; consult a CPA.
Schools (NCES district)
- District
- Detroit Public Schools Community District
- NCES district ID
- 2601103
- Math proficiency
- 10% ▼ -2.00%
- Reading proficiency
- 24% ▲ 6.00%
- Median HH income
- $25,815
- Composite
- 13.06/100
- National rank
- #9564
- State rank
- #499 of 540 in MI
Livability — Detroit
- Score
- 73/100
- State rank
- #218
- US rank
- #5427
Category grades
Schools grade is shown separately in the Schools card above.
Census & demographics
- Census place
- Detroit, MI
- County
- Wayne County · 1,562,939 people
- City population
- 572,865
- Metro
- Detroit-Warren-Dearborn, MI
- Population (ZIP)
- 20,075
- Household income
- $34,003
- Rent vs Own
- Severe rent burden
- 1202.0
Population outlook (Wayne County) Hauer SSP2
- Today (2025)
- 1,675,273 people
- By 2030
- 1,620,300 · -3.3%
- By 2040
- 1,502,341 · -10.3%
- By 2050
- 1,384,039 · -17.4%
- By 2075
- 1,124,592 · -32.9%
- By 2100
- 881,193 · -47.4%
Race, ethnicity, and origin ACS 2023
- Neighborhood character
- Predominantly Black (92%)
- Race & ethnicity
- Black 92% White 4% Hispanic / Latino 2% Two or more races 1%
- Common ancestry
- Slovak 1%
- Foreign-born
- 2% · Canada
- Languages at home
- 97% English-only · Arabic 1% Spanish 1%
Political lean MEDSL · Wayne
- 2024 margin
- Strong D (+29.0) · D 62.7% · R 33.7% · Other 3.6%
- 2008→2024 swing
- -20.5pp toward R · 2008: 49.5pp · 2024: 29.0pp
- All cycles
- 2024: D+29.0 2020: D+38.1 2016: D+37.3 2012: D+46.9 2008: D+49.5
Not yet ingested
- Civics
- —
Market trends
- HPI YoY
- ▼ -122.86%
- Current HPI
- 217.2037
- Rent YoY
- —
- Metro
- Detroit-Warren-Dearborn, MI
- State GDP YoY
- ▲ 1.37%
- F500 in state
- 28
Industry mix (Fortune 500 HQ in MI)
| Industry | F500 HQs | Revenue |
|---|---|---|
| Automotive Parts | 3 | $48B |
|
||
| Automotive | 2 | $372B |
|
||
| Chemicals | 1 | $45B |
|
||
| Automotive Retail | 1 | $29B |
|
||
| Healthcare / Medical Devices | 1 | $23B |
|
||
| Automotive Technology | 1 | $20B |
|
||
Price history
-85.1% since first listed23 events — show timeline
- 2026-01-16 Listed $12,500 REALCOMP
- 2026-01-16 Listed $12,500 MiRealSource-MiMLS
- 2023-12-17 Listing Removed — MiRealSource-MiMLS
- 2023-12-16 Listing Removed — REALCOMP
- 2023-09-09 Price Changed $19,500 MiRealSource-MiMLS
- 2023-09-08 Price Changed $19,500 REALCOMP
- 2023-08-07 Listed $24,000 MiRealSource-MiMLS
- 2023-08-07 Listed $24,000 REALCOMP
- 2019-09-01 Listing Removed — MiRealSource-MiMLS
- 2019-09-01 Listing Removed — REALCOMP
- 2019-06-01 Listed $10,000 MiRealSource-MiMLS
- 2019-06-01 Listed $10,000 REALCOMP
- 2019-05-31 Listing Removed — MiRealSource-MiMLS
- 2019-05-31 Listing Removed — REALCOMP
- 2019-02-01 Listed $9,500 MiRealSource-MiMLS
- 2019-02-01 Listed $9,500 REALCOMP
- 2019-01-31 Listing Removed — MiRealSource-MiMLS
- 2019-01-31 Listing Removed — REALCOMP
- 2018-06-12 Listed $10,000 MiRealSource-MiMLS
- 2018-06-12 Listed $10,000 REALCOMP
- 2006-06-30 Listing Removed — REALCOMP
- 2006-01-18 Listed $92,000 REALCOMP
- 2005-03-02 Sold (Public Records) $84,000 Public Records
Property tax history
+4.5%/yrLatest (2025): $1,350 · -24.7% YoY. Source: county tax records.
Cash-flow waterfall
monthlySold comps — $/sqft
last 12 mo · ≤1 miLoading sold comps…