813 Woodhaven Lakes Dr · La Marque, TX
Flood risk No data
- FEMA flood zone
- —
- Chance of flooding over 30 yrs
- —
- Est. flood insurance / yr
- —
Fire risk No data
- Est. fire insurance / yr
- —
Heat risk No data
- Hot days now (above threshold)
- —
- Hot days in 30 yrs
- —
Wind risk No data
- Chance of severe wind over 30 yrs
- —
Air-quality risk No data
- Unhealthy air days now
- —
- Unhealthy air days in 30 yrs
- —
Risk factors via First Street. Map © Google.
Why this score? — see what drove the D grade
The composite is a weighted blend of 9 inputs, each scored 0–100. Each bar is that input's sub-score; the figure is the points it added to the 100-point composite (weight × sub-score).
- Cash flow +11.9/30.0
- ARV discount +9.1/15.0
- Condition / age +4.0/5.0
- 1% rule +3.7/10.0
- DSCR +3.5/10.0
- Rent growth +3.5/5.0
- Livability +3.0/5.0
- Schools +2.6/10.0
- Appreciation +0.0/10.0
$260,000
🖨 Deal sheet 📄 Offer letter ✓ Due diligence
Listing remarks
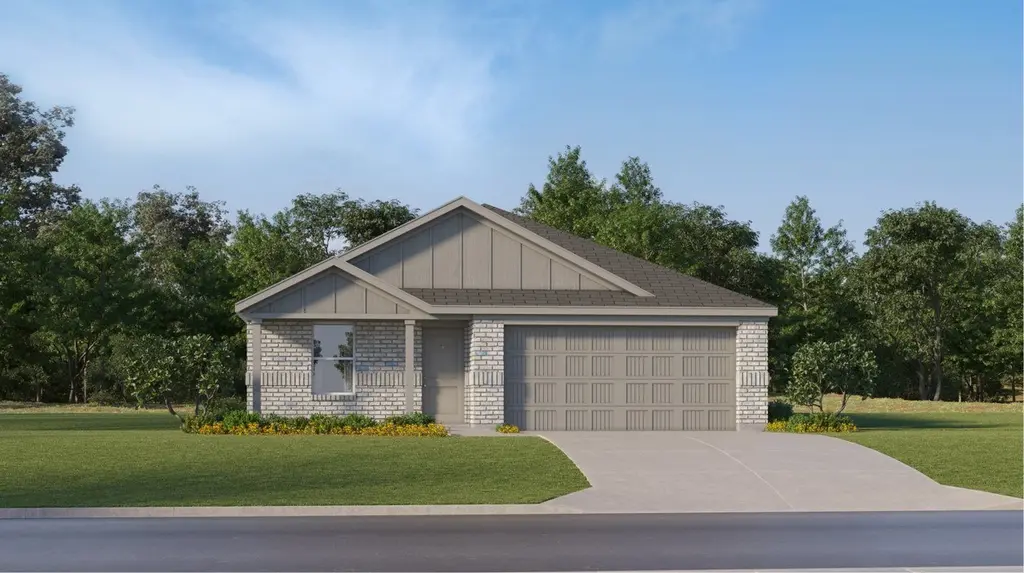
The Ramsey Floor Plan - This new single-story design makes smart use of the space available. At the front are all three secondary bedrooms arranged near a convenient full-sized bathroom. Down the foyer is a modern layout connecting a peninsula-style kitchen made for inspired meals, an intimate dining area and a family room ideal for gatherings. Tucked in a quiet corner is the owner’s suite with an attached bathroom and walk-in closet. The completion date, prices and features may vary and are subject to change. Please verify with Lennar directly. Photos are for illustrative purposes only.
Key facts
- Intimate dining area
- Walk-in closet
- Single-story design
Tags
Property features AI
Finance
- Financial info: Listing price $260,000
Exterior
- Parking: 2 garage spaces (2 total parking spaces)
- Home design: Single-family property (new construction spec home)
- Exterior features: Spec new construction (Ramsey plan); Address: 813 Woodhaven Lakes Dr, La Marque, TX 77568
Interior
- Bedrooms: 4 bedrooms
- Bathrooms: 2 full bathrooms
- Interior features: Open living area (1,676 total living area)
Neighborhood map
What this means for you Summary
Snapshot
- This is a 4-bed/2.0-bath single-family listed at $260k. Condition is rated good.
Deal economics
- At list price, monthly cash flow is $-67 ($-808/yr) — negative.
- To cash-flow at today's rent, offer at most $250k (3.7% below list).
- To meet the 1% rule (rent ≥ 1% of price), the offer needs to be $227k (12.7% below list).
- Recommended offer: $227k (12.7% below list) — sets the bar for 1% rule.
Location & tenants
- Location reads 59/100 on livability (#1,136 in TX) — a working-class tenant base; expect higher turnover. Strengths: cost of living A+, housing A+; Watch: employment D, schools F, crime F.
- Hitchcock ISD (suburban): math 28% / reading 31% proficiency, ranked #628 of 826 in TX (top 76%) — low school quality limits family demand, transient renter base, plan for 1-2y turnover; 72% free/reduced lunch — lower-income household profile, screen leases tightly.
- Market conditions: Rents rising (+4.0%/yr); 654 active listings in the ZIP; 1 comparable units currently listed for rent nearby; 3,258 units permitted in Galveston County in 2024 (0 in 5+ unit buildings).
- This rent runs 36% of the median local income ($75k/yr) — at the standard rent-burdened threshold; future hikes will face affordability resistance.
Forward outlook
- Local home prices are declining (-3.0%/yr); year-one equity from $2k of loan paydown is wiped out by about $8k of value loss. Plan a longer hold.
- Galveston County population projected at +43% by 2050 — long-run rental-demand tailwind backs the buy-and-hold thesis.
Negotiation context
- Only 12 days on market — expect competitive offers; lowballing is unlikely to land.
Questions for the listing agent
- What do current leases actually rent for vs. the listed asking? Can we see a recent rent roll and the last 12 months of T-12 income?
- What does the HOA fee cover, when was the last increase, and are there any pending special assessments or reserve-fund shortfalls?
- Is there a deadline driving the sale (1031 exchange, divorce, estate, relocation)? That informs how much negotiation room exists.
- Schools are F-rated, which usually means shorter tenancies and higher turnover. Who's the typical renter profile here, and what's been the actual vacancy rate?
- Crime grade is F in this area — have there been break-ins, vandalism, or insurance claims at this property in the last 3 years? What carrier currently insures it and at what premium?
- The area grade is low — what's the realistic commute time and amenity access for the typical tenant pool here? Any planned neighborhood developments (good or bad) we should know about?
- What's the average days-on-market for RENTAL listings here right now (not sales)? A rising rental-DOM trend means longer vacancies and softer asking-rent achievability than the comps imply.
- What's the recent tenant-quality profile in this submarket — average credit score on applications, eviction rate, late-payment / NSF rate, and stable-employment percentage? A property-management company in the area should have these aggregated.
- How much new for-sale + rental construction is in the pipeline within 1–3 miles? Heavy new supply typically softens prices + rents 12–24 months out; constrained supply supports both.
Investment metrics
- 1% rule
- 0.87% ✗
- Cap rate
- 5.98%
- Cash-on-cash
- -1.11%
- DSCR
- 0.95
- GRM
- 9.5
CMA / ARV
- ARV (on-the-fly)
- $269,836
- Comps found
- 12
Show comp detail 12 sales within ~0.75 mi
| Address | Dist | Beds/Ba | Sqft | Sold | Price | $/sf | Match |
|---|---|---|---|---|---|---|---|
| 648 Burlina Rd | 0.21mi | 4/2.0 | 1,676 (0%) | 1mo | $249,990 | $149 | 90 |
| 652 Burlina Rd | 0.21mi | 4/2.0 | 1,716 (+2%) | 1mo | $255,190 | $149 | 86 |
| 644 Burlina Rd | 0.21mi | 4/2.0 | 1,716 (+2%) | 1mo | $275,990 | $161 | 86 |
| 804 Indigo Springs Ln | 0.29mi | 3/2.0 (-1) | 1,639 (-2%) | 1mo | $249,800 | $152 | 77 |
| 805 Apple Blossom Dr | 0.16mi | 3/2.0 (-1) | 1,501 (-10%) | 1mo | $269,990 | $180 | 70 |
| 862 Sand Crab Ln | 0.25mi | 3/2.0 (-1) | 1,873 (+12%) | 1mo | $255,000 | $136 | 63 |
| 1074 Garnet Star Dr | 0.63mi | 3/2.0 (-1) | 1,732 (+3%) | 0mo | $295,990 | $171 | 60 |
| 996 Camellia Hills Ln | 0.43mi | 3/2.0 (-1) | 1,526 (-9%) | 1mo | $239,000 | $157 | 59 |
| 1109 Black Rail St | 0.47mi | 3/2.0 (-1) | 1,526 (-9%) | 1mo | $245,000 | $161 | 58 |
| 1106 Radiant Ave | 0.56mi | 3/2.0 (-1) | 1,548 (-8%) | 1mo | $265,990 | $172 | 56 |
| 1341 Blue Moon Ln | 0.65mi | 4/2.0 | 1,872 (+12%) | 1mo | $295,990 | $158 | 49 |
| 1305 Blue Moon Ln | 0.67mi | 3/2.0 (-1) | 1,491 (-11%) | 1mo | $257,990 | $173 | 45 |
Match score weights: distance 35% · size 25% · config 20% · recency 20%. Top-matched comps best support the ARV.
Projected returns pro-forma
-3.0% appreciation · 3.95% rent growth · sell at horizon
- IRR
- -17.0%
- Equity multiple
- 0.39×
- Total profit
- $-44,155
- Equity at exit
- $38,767
- IRR
- -7.1%
- Equity multiple
- 0.53×
- Total profit
- $-34,508
- Equity at exit
- $22,480
Cash invested: $72,800 (down + closing). Projections, not guarantees.
Landlord ↔ Tenant lean methodology
- Overall (STATE)
- 87 Strongly Landlord-Friendly
- State Texas
- 87 Strongly Landlord-Friendly · R+5
- County
- — inherits STATE
- City
- — inherits STATE
ZIP-level market 77568
- Home prices YoY
- -22.7%
- Rents YoY
- 4.0%
- Active inventory
- 654
- Price-to-rent
- 9.5×
Monthly cashflow live
- Estimated rent
- $2,270 medium interval (Pro) →
- Mortgage (P&I)
- −$1,363
- Tax est. 1.5%
- −$325 /mo · $3,900/yr
- Insurance
- −$108
- HOA
- −$64
- Vacancy / Maint / Mgmt
- −$477
- Net cashflow
- $-67
Break-even live
UW: 25.0% down · 7.5% · 30yr · 1.5% tax · 5.0% vac · 8.0% maint · 8.0% mgmt
Financing live
Cash to close
- Down payment
- $65,000
- Closing costs
- $7,800
- Reserves months
- —
- Total cash needed
- —
Loan-product check · same deal, 3 products live
Conventional
25% down · 7.5% · 30yr
- Down + closing
- —
- Monthly P&I
- —
- Monthly cashflow
- —
- DSCR
- —
- Eligible?
- —
Personal DTI + credit; lowest rate.
DSCR
20% down · 8.5% · 30yr
- Down + closing
- —
- Monthly P&I
- —
- Monthly cashflow
- —
- DSCR
- —
- Eligible?
- —
No personal income docs; deal must DSCR.
Hard money
10% down · 12.0% · 12mo
- Down + closing
- —
- Monthly P&I
- —
- Monthly cashflow
- —
- DSCR
- —
- Eligible?
- —
Short-term bridge; refi at stabilization.
Rent comps 1 comps
| Address | Beds | Baths | Sqft | Rent | $/sqft | DOM | Units | Dist |
|---|---|---|---|---|---|---|---|---|
| 453 Maple Bend Ln La Marque, TX | 3.0 | 2.0 | 1860 | $2,071 | $1.11 | 20d | 1 | 0.68mi |
HOA detail
- Monthly dues
- $64 · $768/yr
Listing history 9 events
-
2026-06-13statusdays on market $260,000 Pending 12 DOM
-
2026-06-09days on market $260,000 Active 11 DOM
-
2026-06-08days on market $260,000 Active 10 DOM
-
2026-06-07days on market $260,000 Active 9 DOM
-
2026-06-04days on market $260,000 Active 6 DOM
-
2026-06-03days on market $260,000 Active 5 DOM
-
2026-06-02days on market $260,000 Active 4 DOM
-
2026-06-01days on market $260,000 Active 3 DOM
-
2026-05-31days on market $260,000 Active 2 DOM
ⓘ Source: listings_history table (triggers on properties + properties_extension) + one-shot
backfill from property_details.listing_events for pre-trigger history.
Nearby sold comps map
Loading sold comps map…
Walkable amenities ~0.75 mi
Loading nearby amenities…
Taxation est. · year 1
- Rental income
- $27,243
- − Mortgage interest
- −$14,564
- − Property taxes
- −$3,900
- − Insurance
- −$1,300
- − Repairs & maintenance
- −$2,179
- − Management
- −$2,179
- − HOA
- −$768
- − Depreciation
- −$7,564
- Taxable loss
- −$5,212
- Est. tax savings @ 24.0%
- +$1,251
- After-tax cash flow
- $443/yr
For passive investors: Depreciation is non-cash, so a rental often shows a tax loss while cash-flowing — sheltering income. Rental losses are passive: they offset passive income freely, and up to $25,000/yr can offset ordinary (W-2) income if you actively participate and your MAGI is under $100k (phasing out to $0 by $150k); unused losses carry forward. On sale, claimed depreciation is recaptured at up to 25%, and gains may owe capital-gains tax (a 1031 exchange can defer both). Figures are a year-1 estimate at your 24.0% rate — not tax advice; consult a CPA.
Condition & rehab AI · 12 photos
This single-story home is in good condition with a modern design and well-maintained exterior. It offers a good investment opportunity with potential for both resale and rental value through minor updates and improvements.
Value-add opportunities
- Both Painting the exterior — Fresh paint can enhance curb appeal and property value.
- Both Landscaping improvements — Enhanced landscaping can attract more buyers and renters.
- Both Adding smart home features — Modern technology can increase both resale and rental value.
- Resale Upgrading appliances — Newer, more energy-efficient appliances can attract more buyers.
- Rental Adding a smart thermostat — Smart thermostats can reduce energy costs and attract renters looking for energy-efficient homes.
Renovation cost estimate screening
Value-add ROI direction
- Both Painting the exterior — Fresh paint can enhance curb appeal and property value. ↑
- Both Landscaping improvements — Enhanced landscaping can attract more buyers and renters. ↑
- Both Adding smart home features — Modern technology can increase both resale and rental value. ↑
- Resale Upgrading appliances — Newer, more energy-efficient appliances can attract more buyers. ↑
- Rental Adding a smart thermostat — Smart thermostats can reduce energy costs and attract renters looking for energy-efficient homes. ↑
ⓘ Cost ranges are severity-bucket heuristics (US national rule-of-thumb). Get contractor quotes + a written scope before underwriting a rehab budget.
Schools (NCES district)
- District
- Hitchcock ISD
- NCES district ID
- 4823310
- Math proficiency
- 28% ▼ -2.00%
- Reading proficiency
- 31% ▼ -4.00%
- Median HH income
- $47,041
- Composite
- 25.5/100
- National rank
- #7439
- State rank
- #628 of 826 in TX
Livability — La Marque
- Score
- 59/100
- State rank
- #1136
- US rank
- #20037
Category grades
Schools grade is shown separately in the Schools card above.
Census & demographics
- Census place
- La Marque, TX
- County
- Galveston County · 357,330 people
- City population
- 23,083
- Metro
- Houston-The Woodlands-Sugar Land, TX
- Population (ZIP)
- 23,083
- Household income
- $74,694
- Rent vs Own
- Severe rent burden
- 700.0
Population outlook (Galveston County) Hauer SSP2
- Today (2025)
- 390,640 people
- By 2030
- 425,226 · +8.9%
- By 2040
- 493,765 · +26.4%
- By 2050
- 559,698 · +43.3%
- By 2075
- 719,260 · +84.1%
- By 2100
- 819,628 · +109.8%
Race, ethnicity, and origin ACS 2023
- Neighborhood character
- Highly diverse neighborhood (Simpson 0.71)
- Race & ethnicity
- White 37% Hispanic / Latino 29% Black 26% Two or more races 17% Asian 3%
- Hispanic origin (detail)
- Mexican 22% Puerto Rican 1%
- Common ancestry
- Lithuanian 1% Italian 1% Serbian 1%
- Foreign-born
- 8% · Canada
- Languages at home
- 77% English-only · Spanish 21% Tagalog/Filipino 1% Other Asian/Pacific 1%
Political lean MEDSL · Galveston
- 2024 margin
- Strong R (+27.4) · D 35.7% · R 63.1% · Other 1.2%
- 2008→2024 swing
- -7.9pp toward R · 2008: -19.5pp · 2024: -27.4pp
- All cycles
- 2024: R+27.4 2020: R+22.6 2016: R+22.6 2012: R+26.9 2008: R+19.5
Not yet ingested
- Civics
- —
Market trends
- HPI YoY
- ▼ -69.39%
- Current HPI
- 236.0239
- Rent YoY
- ▲ 3.95%
- Metro
- Houston-The Woodlands-Sugar Land, TX
- State GDP YoY
- ▲ 3.95%
- F500 in state
- 110
Industry mix (Fortune 500 HQ in TX)
| Industry | F500 HQs | Revenue |
|---|---|---|
| Energy | 16 | $1,198B |
|
||
| Technology | 5 | $198B |
|
||
| Engineering / Construction | 4 | $72B |
|
||
| Energy Services | 3 | $60B |
|
||
| Utilities | 3 | $41B |
|
||
| Healthcare | 2 | $330B |
|
||
Cash-flow waterfall
monthlySold comps — $/sqft
last 12 mo · ≤1 miLoading sold comps…