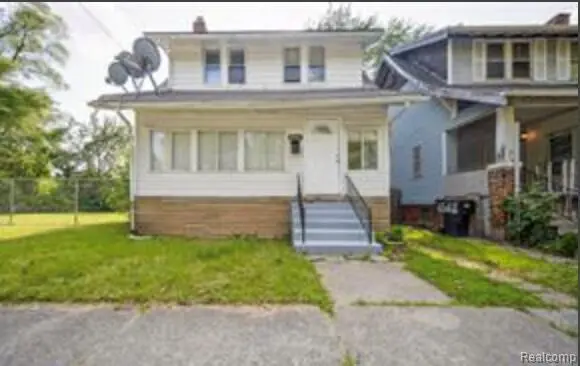
6561 Firwood St · Detroit, MI
Flood risk 1/10 · Minimal
- FEMA flood zone
- X (unshaded)
- Chance of flooding over 30 yrs
- 0.0%
- Est. flood insurance / yr
- $507 – $1,088
Fire risk 1/10 · Minimal
- Est. fire insurance / yr
- $784 – $1,456
Heat risk 3/10 · Minor
- Hot days now (above 97°F)
- 7 days/yr
- Hot days in 30 yrs
- 14 days/yr
Wind risk 2/10 · Minimal
- Chance of severe wind over 30 yrs
- —
Air-quality risk 4/10 · Minor
- Unhealthy air days now
- 4 days/yr
- Unhealthy air days in 30 yrs
- 6 days/yr
Risk factors via First Street. Map © Google.
Why this score? — see what drove the C grade
The composite is a weighted blend of 9 inputs, each scored 0–100. Each bar is that input's sub-score; the figure is the points it added to the 100-point composite (weight × sub-score).
- Cash flow +25.2/30.0
- DSCR +8.3/10.0
- ARV discount +7.5/15.0
- 1% rule +7.3/10.0
- Livability +3.7/5.0
- Rent growth +2.5/5.0
- Condition / age +2.5/5.0
- Schools +1.3/10.0
- Appreciation +0.0/10.0
$95,999
🖨 Deal sheet 📄 Offer letter ✓ Due diligence
Listing remarks MLS
* * CASH-FLOWING DETROIT INVESTMENT OPPORTUNITY - TURNKEY & TENANT OCCUPIED! * * On the market and ready for its next owner - this spacious 3-bedroom colonial offers immediate rental income, updated mechanicals, and a prime location just minutes from Downtown Detroit. * * Investor Highlights: * * * Tenant occupied at * * $1,250/month * * * Annual Gross Income: * * $15,000 * * * Approx. * * 15.6% Gross ROI * * * Month-to-month tenant provides flexibility for investors or future owner-occupants PLEASE DO NOT DISTURB TENANTS. This is the type of property investors are actively searching for - updated, income-producing, and located near some of Detroit's hottest growth areas. --- PROPERTY FEATURES: ? Updated kitchen ? Updated bathroom ? Updated plumbing, electrical & mechanical systems ? Fresh carpet throughout ? Neutral paint colors ? Bright living room with abundant natural light ? Formal dining room ? Spacious kitchen with additional storage potential ? Enclosed front porch perfect for relaxing ? Unique upper-level four-seasons room ideal for: * Home office * Nursery * Reading nook * Lounge/flex space --- PRIME LOCATION: Located just minutes from: * Downtown Detroit * Corktown * Midtown * Wayne State University * Major freeways * Restaurants, entertainment & nightlife --- Whether you're looking for: * Immediate cash flow * A portfolio addition * A long-term appreciation play * Or a future owner-occupant opportunity This property checks all the boxes. Listed and priced to move - schedule your showing today before it's gone!
Key facts
- 3,049 sq ft lot
- Built 1917
- Listed 41 days
Property features AI
Finance
- Other: Lot approximately 0.07 acres (30 x 108); Subdivision: KREMERS; Cross street: Tireman and West Grand Blvd; Directions available
Exterior
- Parking: No garage
- Security: Smoke detectors; Closed-circuit cameras
- Utilities: Circuit breaker electrical panel; Water available; Sewer available
- Home design: Single-family residence; Two levels; Ground-level entry with steps
- Construction: Vinyl siding; Block foundation; Asphalt roof; Built as residential single-family
- Exterior features: Enclosed porch; Porch; Terrace; Paved road access
Interior
- Bathrooms: 1 full bathroom
- Heating & cooling: Forced air heating (natural gas); No cooling
- Interior features: Full, unfinished basement; 9 total rooms
Neighborhood map
What this means for you Summary
Snapshot
- This is a 3-bed/1.0-bath single-family listed at $96k.
Deal economics
- At list price, monthly cash flow is $216 ($3k/yr) — positive.
- The deal already cash-flows at list — no discount required.
- Meets the 1% rule at list price ($1k rent vs $96k).
- Recommended offer: $93k (3.0% below list) — sets the bar for market timing.
Location & tenants
- Location reads 73/100 on livability (#218 in MI) — a middle-class / working-renter tenant base. Strengths: amenities A+, commute A+, cost of living A+; Watch: schools F, crime F, employment F.
- Detroit Public Schools Community District (urban): math 10% / reading 24% proficiency, ranked #499 of 540 in MI (top 92%) — low school quality limits family demand, transient renter base, plan for 1-2y turnover; 90% free/reduced lunch — lower-income household profile, screen leases tightly.
- Market conditions: 94 active listings in the ZIP; 34 comparable units currently listed for rent nearby; rentals at typical pace (median 24d on market — plan ~3-4 weeks tenant-placement turnaround); 47% of comp listings sitting > 30 days — soft ceiling on asking rent; 2,639 units permitted in Wayne County in 2024 (1,216 in 5+ unit buildings).
Forward outlook
- Local home prices are declining (-3.0%/yr); year-one equity from $663 of loan paydown is wiped out by about $3k of value loss. Plan a longer hold.
- Wayne County population projected at -17% by 2050 — secular population decline; favor cash flow + early exit over multi-decade hold.
Negotiation context
- It's been on market 42 days — a 3% lower offer ($93k) is reasonable based on typical stale-listing flexibility.
- 9 sale attempts since 2y ago with the ask held roughly flat each time — persistent listings suggest the price (not the market) is what's stuck; bring a comps-based counter.
Risks & watch-outs
- Watch-outs: built in 1917 — expect roof / HVAC / electrical / plumbing capex.
Questions for the listing agent
- It's been on market 42 days. Have you received any prior offers? Is the seller open to a 3% concession, seller financing, or rate buy-down credit?
- Built in 1917 — when were the roof, HVAC, electrical panel, plumbing, and water heater last replaced?
- Is there a deadline driving the sale (1031 exchange, divorce, estate, relocation)? That informs how much negotiation room exists.
- Schools are F-rated, which usually means shorter tenancies and higher turnover. Who's the typical renter profile here, and what's been the actual vacancy rate?
- Crime grade is F in this area — have there been break-ins, vandalism, or insurance claims at this property in the last 3 years? What carrier currently insures it and at what premium?
- What's the average days-on-market for RENTAL listings here right now (not sales)? A rising rental-DOM trend means longer vacancies and softer asking-rent achievability than the comps imply.
- What's the recent tenant-quality profile in this submarket — average credit score on applications, eviction rate, late-payment / NSF rate, and stable-employment percentage? A property-management company in the area should have these aggregated.
- How much new for-sale + rental construction is in the pipeline within 1–3 miles? Heavy new supply typically softens prices + rents 12–24 months out; constrained supply supports both.
Investment metrics
- 1% rule
- 1.23% ✓
- Cap rate
- 8.99%
- Cash-on-cash
- 9.64%
- DSCR
- 1.43
- GRM
- 6.8
CMA / ARV
- ARV (median comp)
- $42,155
- List price
- $95,999
- Delta
- 127.73%
- Verdict
- OVERPRICED
- Comps
- 20 within 1.0 mi
Show comp detail 12 sales within ~0.75 mi
| Address | Dist | Beds/Ba | Sqft | Sold | Price | $/sf | Match |
|---|---|---|---|---|---|---|---|
| 5362 Allendale St | 0.51mi | 3/1.0 | 1,200 (-2%) | 2mo | $70,000 | $58 | 71 |
| 6410 Scotten St | 0.22mi | 3/1.0 | 1,354 (+10%) | 3mo | $47,000 | $35 | 70 |
| 3532 Moore Pl Pl | 0.53mi | 3/1.5 | 1,181 (-4%) | 1mo | $12,000 | $10 | 66 |
| 6419 Roosevelt St | 0.48mi | 3/1.0 | 1,143 (-7%) | 1mo | $15,000 | $13 | 65 |
| 5327 Vancouver St | 0.60mi | 3/1.0 | 1,274 (+4%) | 5mo | $40,000 | $31 | 62 |
| 3005 Lothrop St | 0.73mi | 3/1.0 | 1,200 (-2%) | 2mo | $48,900 | $41 | 60 |
| 3286 Columbus St | 0.71mi | 3/1.0 | 1,272 (+3%) | 6mo | $13,600 | $11 | 56 |
| 5357 Spokane Ave | 0.71mi | 3/1.5 | 1,288 (+5%) | 6mo | $47,997 | $37 | 52 |
| 4497 Vancouver St | 0.47mi | 3/1.5 | 1,412 (+15%) | 1mo | $150,000 | $106 | 51 |
| 5524 Seebaldt St | 0.55mi | 4/2.5 (+1) | 1,323 (+8%) | 5mo | $144,000 | $109 | 47 |
| 5297 Vancouver St | 0.58mi | 4/1.5 (+1) | 1,363 (+11%) | 4mo | $60,000 | $44 | 45 |
| 3299 Montgomery St | 0.72mi | 4/1.5 (+1) | 1,308 (+6%) | 5mo | $79,000 | $60 | 45 |
Match score weights: distance 35% · size 25% · config 20% · recency 20%. Top-matched comps best support the ARV.
Projected returns pro-forma
-3.0% appreciation · 3.0% rent growth · sell at horizon
- IRR
- -1.7%
- Equity multiple
- 0.93×
- Total profit
- $-1,753
- Equity at exit
- $14,314
- IRR
- 8.0%
- Equity multiple
- 1.61×
- Total profit
- $16,388
- Equity at exit
- $8,300
Cash invested: $26,880 (down + closing). Projections, not guarantees.
Landlord ↔ Tenant lean methodology
- Overall (STATE)
- 62 Landlord-Friendly
- State Michigan
- 62 Landlord-Friendly · EVEN
- County
- — inherits STATE
- City
- — inherits STATE
ZIP-level market 48210
- Home prices YoY
- -22.3%
- Active inventory
- 94
- Price-to-rent
- 6.8×
Monthly cashflow live
- Estimated rent
- $1,181 high interval (Pro) →
- Mortgage (P&I)
- −$503
- Tax from tax record
- −$174 /mo · $2,088/yr
- Insurance
- −$40
- HOA
- −$0
- Vacancy / Maint / Mgmt
- −$248
- Net cashflow
- $216
Break-even live
UW: 25.0% down · 7.5% · 30yr · 1.5% tax · 5.0% vac · 8.0% maint · 8.0% mgmt
Financing live
Cash to close
- Down payment
- $24,000
- Closing costs
- $2,880
- Reserves months
- —
- Total cash needed
- —
Loan-product check · same deal, 3 products live
Conventional
25% down · 7.5% · 30yr
- Down + closing
- —
- Monthly P&I
- —
- Monthly cashflow
- —
- DSCR
- —
- Eligible?
- —
Personal DTI + credit; lowest rate.
DSCR
20% down · 8.5% · 30yr
- Down + closing
- —
- Monthly P&I
- —
- Monthly cashflow
- —
- DSCR
- —
- Eligible?
- —
No personal income docs; deal must DSCR.
Hard money
10% down · 12.0% · 12mo
- Down + closing
- —
- Monthly P&I
- —
- Monthly cashflow
- —
- DSCR
- —
- Eligible?
- —
Short-term bridge; refi at stabilization.
Rent comps 34 comps
| Address | Beds | Baths | Sqft | Rent | $/sqft | DOM | Units | Dist |
|---|---|---|---|---|---|---|---|---|
| 4566 Seebaldt St Detroit, MI | 2.0 | 1.0 | 1200 | $1,250 | $1.04 | 21d | 1 | 0.23mi |
| 6307 Woodrow St Detroit, MI | 2.0 | 1.0 | 1000 | $750 | $0.75 | 43d | 1 | 0.23mi |
| 4016 Hogarth St Unit 4018 Hogarth Lower Detroit, MI | 2.0 | 1.0 | 1200 | $1,100 | $0.92 | 3d | 1 | 0.43mi |
| 5101 Oregon St Detroit, MI | 2.0 | 1.0 | 1000 | $1,049 | $1.05 | 43d | 1 | 0.46mi |
| 5440 Milford St Unit 1 Detroit, MI | 2.0 | 1.0 | 850 | $1,150 | $1.35 | 43d | 1 | 0.46mi |
| 4426 McGraw Ave Unit 1 Detroit, MI | 3.0 | 1.0 | 1400 | $1,200 | $0.86 | 43d | 1 | 0.48mi |
| 5398 Allendale St Detroit, MI | 2.0 | 1.0 | 1100 | $1,200 | $1.09 | 23d | 1 | 0.54mi |
| 4345 W Euclid St Unit 2 Detroit, MI | 3.0 | 1.0 | 1300 | $1,450 | $1.12 | 24d | 1 | 0.62mi |
| 4345 W Euclid St Unit 1 Detroit, MI | 3.0 | 1.0 | 1300 | $1,400 | $1.08 | 24d | 1 | 0.62mi |
| 4915 Maplewood St Detroit, MI | 3.0 | 1.0 | 1324 | $1,100 | $0.83 | 16d | 1 | 0.64mi |
| 1565 W Grand Blvd Unit 1 Detroit, MI | 2.0 | 1.0 | 910 | $700 | $0.77 | 21d | 1 | 0.64mi |
| 1565 W Grand Blvd Unit 1 Detroit, MI | 2.0 | 1.0 | 910 | $700 | $0.77 | 24d | 1 | 0.64mi |
| 1493 W Grand Blvd Detroit, MI | 2.0 | 1.0 | 1250 | $1,145 | $0.92 | 43d | 1 | 0.78mi |
| 3757 Blaine St Detroit, MI | 3.0 | 1.0 | 1169 | $1,480 | $1.27 | 16d | 1 | 0.86mi |
| 3259 W Philadelphia St Detroit, MI | 3.0 | 1.0 | 1293 | $1,400 | $1.08 | 16d | 1 | 0.87mi |
| 3786 Carter St Unit 2 Detroit, MI | 3.0 | 1.0 | 1400 | $1,100 | $0.79 | 24d | 1 | 0.92mi |
| 6077 Linwood St Detroit, MI | 2.0 | 1.0 | 1200 | $2,000 | $1.67 | 43d | 1 | 1.00mi |
| 8762 Epworth St Unit 8768 Detroit, MI | 2.0 | 1.0 | 900 | $1,000 | $1.11 | 24d | 1 | 1.08mi |
| 3220 Gladstone St Detroit, MI | 3.0 | 1.0 | 1248 | $1,200 | $0.96 | 43d | 1 | 1.09mi |
| 6144 16th St Detroit, MI | 3.0 | 1.0 | 1284 | $1,200 | $0.93 | 43d | 1 | 1.14mi |
| 3759 Atkinson St Unit 2 Detroit, MI | 2.0 | 1.0 | 919 | $1,200 | $1.31 | 24d | 1 | 1.20mi |
| 2504 W Euclid St Unit 2504 Detroit, MI | 3.0 | 1.0 | 1475 | $1,650 | $1.12 | 43d | 1 | 1.21mi |
| 2506 W Euclid St Detroit, MI | 3.0 | 1.0 | 1475 | $1,675 | $1.14 | 43d | 1 | 1.21mi |
| 2504 W Euclid St Unit 2506 Detroit, MI | 3.0 | 1.0 | 1475 | $1,675 | $1.14 | 43d | 1 | 1.21mi |
| 2531 Pingree St Unit 2 (FL 2) Detroit, MI | 3.0 | 1.0 | 893 | $1,100 | $1.23 | 1d | 1 | 1.25mi |
| 9376 Otsego St Detroit, MI | 3.0 | 1.0 | 873 | $1,396 | $1.60 | 43d | 1 | 1.28mi |
| 7424 Wykes St Detroit, MI | 3.0 | 1.0 | 1200 | $1,100 | $0.92 | 43d | 1 | 1.36mi |
| 3422 Edison St Detroit, MI | 3.0 | 1.0 | 1300 | $1,295 | $1.00 | 16d | 1 | 1.37mi |
| 2047 Seward St Detroit, MI | 3.0 | 1.0 | 1421 | $1,523 | $1.07 | 4d | 1 | 1.41mi |
| 2463 Taylor St Detroit, MI | 3.0 | 1.0 | 1350 | $1,100 | $0.81 | 43d | 1 | 1.45mi |
| 4031 Wesson St Apt 109 Detroit, MI | 2.0 | 1.0 | 1000 | $1,190 | $1.19 | 43d | 1 | 1.48mi |
| 3295 Rochester St Unit 2 Detroit, MI | 2.0 | 1.0 | 800 | $1,000 | $1.25 | 4d | 1 | 1.50mi |
| 3295 Rochester St Unit 2 Detroit, MI | 2.0 | 1.0 | 782 | $850 | $1.09 | 43d | 1 | 1.50mi |
| 9789 Chenlot St Unit 1 Detroit, MI | 2.0 | 1.0 | 1000 | $1,000 | $1.00 | 4d | 1 | 1.50mi |
Listing history 35 events
-
2026-06-18days on market $95,999 Active 42 DOM
-
2026-06-17days on market $95,999 Active 41 DOM
-
2026-06-15days on market $95,999 Active 39 DOM
-
2026-06-13days on market $95,999 Active 37 DOM
-
2026-06-13days on market $95,999 Active 36 DOM
-
2026-06-09days on market $95,999 Active 33 DOM
-
2026-06-08days on market $95,999 Active 32 DOM
-
2026-06-07days on market $95,999 Active 31 DOM
-
2026-06-04days on market $95,999 Active 28 DOM
-
2026-06-03days on market $95,999 Active 27 DOM
-
2026-06-02days on market $95,999 Active 26 DOM
-
2026-06-01days on market $95,999 Active 25 DOM
-
2026-05-31days on market $95,999 Active 24 DOM
-
2026-05-07$95,999 Active 1626-char remark
Show marketing remark (1626 chars)
* * CASH-FLOWING DETROIT INVESTMENT OPPORTUNITY - TURNKEY & TENANT OCCUPIED! * * On the market and ready for its next owner - this spacious 3-bedroom colonial offers immediate rental income, updated mechanicals, and a prime location just minutes from Downtown Detroit. * * Investor Highlights: * * * Tenant occupied at * * $1,250/month * * * Annual Gross Income: * * $15,000 * * * Approx. * * 15.6% Gross ROI * * * Month-to-month tenant provides flexibility for investors or future owner-occupants PLEASE DO NOT DISTURB TENANTS. This is the type of property investors are actively searching for - updated, income-producing, and located near some of Detroit's hottest growth areas. --- PROPERTY FEATURES: ? Updated kitchen ? Updated bathroom ? Updated plumbing, electrical & mechanical systems ? Fresh carpet throughout ? Neutral paint colors ? Bright living room with abundant natural light ? Formal dining room ? Spacious kitchen with additional storage potential ? Enclosed front porch perfect for relaxing ? Unique upper-level four-seasons room ideal for: * Home office * Nursery * Reading nook * Lounge/flex space --- PRIME LOCATION: Located just minutes from: * Downtown Detroit * Corktown * Midtown * Wayne State University * Major freeways * Restaurants, entertainment & nightlife --- Whether you're looking for: * Immediate cash flow * A portfolio addition * A long-term appreciation play * Or a future owner-occupant opportunity This property checks all the boxes. Listed and priced to move - schedule your showing today before it's gone!
-
2026-05-07$95,999 Active 1677-char remark
Show marketing remark (1626 chars)
* * CASH-FLOWING DETROIT INVESTMENT OPPORTUNITY - TURNKEY & TENANT OCCUPIED! * * On the market and ready for its next owner - this spacious 3-bedroom colonial offers immediate rental income, updated mechanicals, and a prime location just minutes from Downtown Detroit. * * Investor Highlights: * * * Tenant occupied at * * $1,250/month * * * Annual Gross Income: * * $15,000 * * * Approx. * * 15.6% Gross ROI * * * Month-to-month tenant provides flexibility for investors or future owner-occupants PLEASE DO NOT DISTURB TENANTS. This is the type of property investors are actively searching for - updated, income-producing, and located near some of Detroit's hottest growth areas. --- PROPERTY FEATURES: ? Updated kitchen ? Updated bathroom ? Updated plumbing, electrical & mechanical systems ? Fresh carpet throughout ? Neutral paint colors ? Bright living room with abundant natural light ? Formal dining room ? Spacious kitchen with additional storage potential ? Enclosed front porch perfect for relaxing ? Unique upper-level four-seasons room ideal for: * Home office * Nursery * Reading nook * Lounge/flex space --- PRIME LOCATION: Located just minutes from: * Downtown Detroit * Corktown * Midtown * Wayne State University * Major freeways * Restaurants, entertainment & nightlife --- Whether you're looking for: * Immediate cash flow * A portfolio addition * A long-term appreciation play * Or a future owner-occupant opportunity This property checks all the boxes. Listed and priced to move - schedule your showing today before it's gone!
-
2026-04-04historical
-
2026-04-04historical
-
2025-07-31status Active
-
2025-07-31status Active
-
2025-07-27historical Accepting Backup Offers
-
2025-07-27historical Active Under Contract
-
2025-06-30price $95,999
-
2025-06-30price $95,999
-
2025-06-12$105,999 Active
-
2025-06-12$105,999 Active
-
2025-06-08historical
-
2025-06-01historical
-
2025-06-01historical
-
2025-04-17status Active
-
2025-04-09historical
-
2025-03-24price $110,000
-
2025-03-24price $110,000
-
2024-12-19$119,000 Active
-
2024-12-19$119,000 Active
-
2021-11-04soldstatus $86,900
ⓘ Source: listings_history table (triggers on properties + properties_extension) + one-shot
backfill from property_details.listing_events for pre-trigger history.
Tax reassessment forecast MI · Partial reset (capped growth)
- Current annual tax
- $2,088 · $174/mo
- Projected year-2 tax
- $2,088 · $174/mo
- Expected delta
- $0/yr ($0/mo · 0.0%)
ⓘ Screening estimate from a state-policy table — verify with the county assessor before closing.
Climate risk First Street
- Flood 1/10 Low FEMA zone X (unshaded) · 0% chance over 30 yrs
- Wildfire 1/10 Low
- Heat 3/10 Moderate 7 d/yr ≥97°F today · 14 d/yr by 30 yrs out
- Wind 2/10 Low
- Air quality 4/10 Moderate 4 unhealthy d/yr today · 6 by 30 yrs out
Nearby sold comps map
Loading sold comps map…
Walkable amenities ~0.75 mi
Loading nearby amenities…
Taxation est. · year 1
- Rental income
- $14,177
- − Mortgage interest
- −$5,377
- − Property taxes
- −$2,088
- − Insurance
- −$480
- − Repairs & maintenance
- −$1,134
- − Management
- −$1,134
- − Depreciation
- −$2,793
- Taxable income
- $1,171
- Est. tax owed @ 24.0%
- −$281
- After-tax cash flow
- $2,310/yr
For passive investors: Depreciation is non-cash, so a rental often shows a tax loss while cash-flowing — sheltering income. Rental losses are passive: they offset passive income freely, and up to $25,000/yr can offset ordinary (W-2) income if you actively participate and your MAGI is under $100k (phasing out to $0 by $150k); unused losses carry forward. On sale, claimed depreciation is recaptured at up to 25%, and gains may owe capital-gains tax (a 1031 exchange can defer both). Figures are a year-1 estimate at your 24.0% rate — not tax advice; consult a CPA.
Schools (NCES district)
- District
- Detroit Public Schools Community District
- NCES district ID
- 2601103
- Math proficiency
- 10% ▼ -2.00%
- Reading proficiency
- 24% ▲ 6.00%
- Median HH income
- $25,815
- Composite
- 13.06/100
- National rank
- #9564
- State rank
- #499 of 540 in MI
Livability — Detroit
- Score
- 73/100
- State rank
- #218
- US rank
- #5427
Category grades
Schools grade is shown separately in the Schools card above.
Census & demographics
- Census place
- Detroit, MI
- City population
- 572,865
- Population (ZIP)
- 26,925
Population outlook (Wayne County) Hauer SSP2
- Today (2025)
- 1,675,273 people
- By 2030
- 1,620,300 · -3.3%
- By 2040
- 1,502,341 · -10.3%
- By 2050
- 1,384,039 · -17.4%
- By 2075
- 1,124,592 · -32.9%
- By 2100
- 881,193 · -47.4%
Race, ethnicity, and origin ACS 2023
- Neighborhood character
- Diverse neighborhood (Simpson 0.58)
- Race & ethnicity
- Hispanic / Latino 59% White 20% Black 17% Two or more races 16% Native American 1%
- Hispanic origin (detail)
- Mexican 44% Puerto Rican 5% Dominican 1%
- Common ancestry
- Romanian 2% Danish 1%
- Foreign-born
- 27% · Canada, Jamaica
- Languages at home
- 39% English-only · Spanish 50% Arabic 10%
Political lean MEDSL · Wayne
- 2024 margin
- Strong D (+29.0) · D 62.7% · R 33.7% · Other 3.6%
- 2008→2024 swing
- -20.5pp toward R · 2008: 49.5pp · 2024: 29.0pp
- All cycles
- 2024: D+29.0 2020: D+38.1 2016: D+37.3 2012: D+46.9 2008: D+49.5
Not yet ingested
- Civics
- —
Market trends
- HPI YoY
- ▼ -85.82%
- Current HPI
- 299.5909
- Rent YoY
- —
- Metro
- —
- State GDP YoY
- ▲ 1.37%
- F500 in state
- 28
Industry mix (Fortune 500 HQ in MI)
| Industry | F500 HQs | Revenue |
|---|---|---|
| Automotive Parts | 3 | $48B |
|
||
| Automotive | 2 | $372B |
|
||
| Chemicals | 1 | $45B |
|
||
| Automotive Retail | 1 | $29B |
|
||
| Healthcare / Medical Devices | 1 | $23B |
|
||
| Automotive Technology | 1 | $20B |
|
||
Price history
+10.5% since first listed22 events — show timeline
- 2026-05-07 Listed $95,999 REALCOMP
- 2026-05-07 Listed $95,999 MiRealSource-MiMLS
- 2026-04-04 Listing Removed — REALCOMP
- 2026-04-04 Listing Removed — MiRealSource-MiMLS
- 2025-07-31 Relisted — MiRealSource-MiMLS
- 2025-07-31 Relisted — REALCOMP
- 2025-07-27 Contingent — MiRealSource-MiMLS
- 2025-07-27 Contingent — REALCOMP
- 2025-06-30 Price Changed $95,999 MiRealSource-MiMLS
- 2025-06-30 Price Changed $95,999 REALCOMP
- 2025-06-12 Listed $105,999 MiRealSource-MiMLS
- 2025-06-12 Listed $105,999 REALCOMP
- 2025-06-08 Coming Soon — MiRealSource-MiMLS
- 2025-06-01 Listing Removed — REALCOMP
- 2025-06-01 Listing Removed — MiRealSource-MiMLS
- 2025-04-17 Relisted — REALCOMP
- 2025-04-09 Listing Removed — REALCOMP
- 2025-03-24 Price Changed $110,000 MiRealSource-MiMLS
- 2025-03-24 Price Changed $110,000 REALCOMP
- 2024-12-19 Listed $119,000 REALCOMP
- 2024-12-19 Listed $119,000 MiRealSource-MiMLS
- 2021-11-04 Sold (Public Records) $86,900 Public Records
Property tax history
+2.4%/yrLatest (2025): $2,088 · +100.7% YoY. Source: county tax records.
Cash-flow waterfall
monthlySold comps — $/sqft
last 12 mo · ≤1 miLoading sold comps…