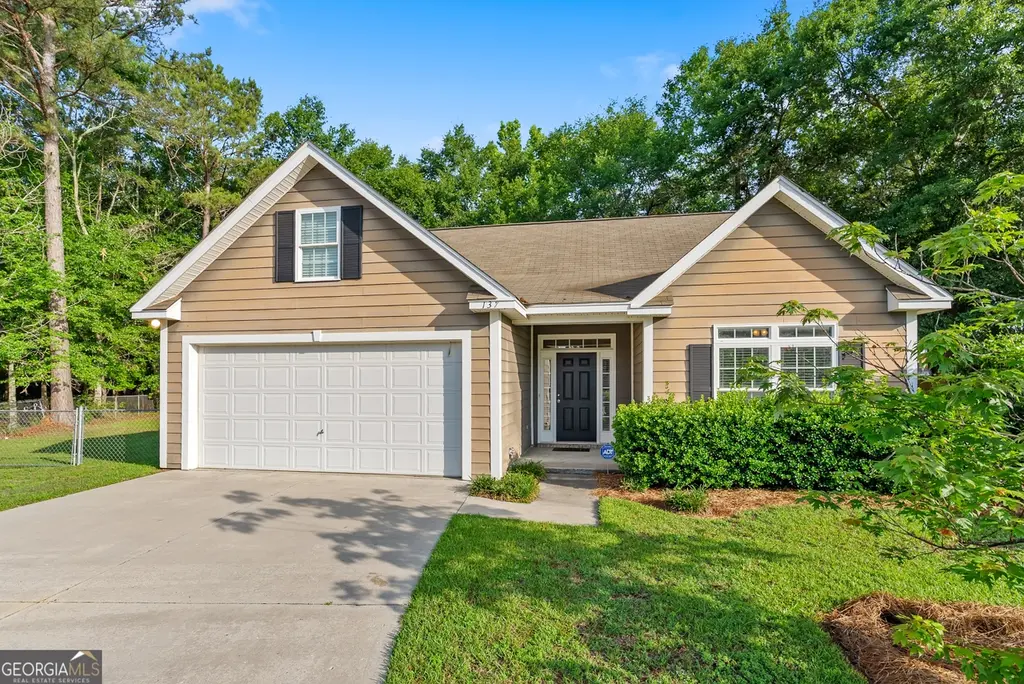
137 Brookfair Ln · Leesburg, GA
Flood risk 1/10 · Minimal
- FEMA flood zone
- X (unshaded)
- Chance of flooding over 30 yrs
- 0.0%
- Est. flood insurance / yr
- $507 – $1,088
Fire risk 5/10 · Moderate
- Est. fire insurance / yr
- $963 – $1,789
Heat risk 8/10 · Major
- Hot days now (above 108°F)
- 7 days/yr
- Hot days in 30 yrs
- 19 days/yr
Wind risk 8/10 · Major
- Chance of severe wind over 30 yrs
- 90.0%
Air-quality risk 4/10 · Minor
- Unhealthy air days now
- 6 days/yr
- Unhealthy air days in 30 yrs
- 6 days/yr
Risk factors via First Street. Map © Google.
Why this score? — see what drove the D- grade
The composite is a weighted blend of 9 inputs, each scored 0–100. Each bar is that input's sub-score; the figure is the points it added to the 100-point composite (weight × sub-score).
- Cash flow +12.9/30.0
- ARV discount +7.5/15.0
- Schools +3.9/10.0
- DSCR +3.8/10.0
- Livability +3.4/5.0
- Rent growth +3.1/5.0
- 1% rule +2.9/10.0
- Condition / age +2.5/5.0
- Appreciation +0.0/10.0
$209,900
🖨 Deal sheet 📄 Offer letter ✓ Due diligence
Listing remarks
Welcome home to the heart of Leesburg - where small-town charm, community spirit, and peaceful living come together beautifully. Nestled in one of the area's most desirable neighborhoods, this home offers the rare opportunity to enjoy "Small Town USA" living with everyday conveniences just steps away. Stroll to local boutiques, favorite eateries, the library, and city and county offices, all while enjoying the warmth and walkability that make downtown Leesburg so special. Located just behind Lee County High School, you'll love Friday nights filled with Trojan pride and hometown football traditions. A natural green space creates a serene buffer between the school and surrounding ho
Key facts
- Wildlife sightings
- Private retreat
- Natural green space
Tags
Property features AI
Finance
- Other: Located in Indian Oaks Plantation subdivision; Lot approximately 0.39 acres; Directions available to property
- Financial info: Accepts Cash, Conventional, FHA, USDA Loan, and VA Loan
- HOA & community: No homeowners association; Community features include street lights, walk-to-schools, and nearby shopping
Exterior
- Parking: Garage with garage door opener; Off-street parking
- Security: Smoke detector(s)
- Utilities: Public water; Public sewer; Electricity available; High-speed internet available; Cable available; Phone service available
- Home design: Single-family house; One story; Built in 2010; Resale property; Facing direction not specified
- Construction: Built in 2010; Concrete and vinyl siding; Composition roof
- Exterior features: Composition roof; Concrete and vinyl siding construction; Chain link fencing in backyard; Located on a cul-de-sac; Has a spa (bath)
Interior
- Kitchen: Breakfast area; Breakfast bar; Pantry; Dishwasher; Microwave; Refrigerator; Ice maker; Stainless steel appliances
- Bedrooms: 3 bedrooms on the main level
- Flooring: Carpet; Hardwood; Tile
- Bathrooms: 2 full bathrooms, both on the main level
- Heating & cooling: Central heating (electric); Central air; Ceiling fan(s)
- Interior features: Double vanity; High ceilings; Separate shower; Split bedroom plan; Walk-in closet(s); Family room; Foyer
- Laundry & utility: Washer and dryer included; Laundry located in kitchen; Laundry closet; Electric water heater
Neighborhood map
What this means for you Summary
Snapshot
- This is a 3-bed/2.0-bath single-family listed at $210k.
Deal economics
- At list price, monthly cash flow is $-17 ($-206/yr) — negative.
- To cash-flow at today's rent, offer at most $207k (1.4% below list).
- To meet the 1% rule (rent ≥ 1% of price), the offer needs to be $165k (21.3% below list).
- Recommended offer: $165k (21.3% below list) — sets the bar for 1% rule.
Location & tenants
- Location reads 68/100 on livability (#135 in GA) — a middle-class / working-renter tenant base. Strengths: crime A+, cost of living A+, housing A+; Watch: employment C-, amenities F, commute F.
- Lee County (rural): math 44% / reading 45% proficiency, ranked #21 of 174 in GA (top 12%) — families likely to look elsewhere, expect single-tenant / working-renter base with shorter leases.
- Zoned schools: Twin Oaks Elementary (math 49% / reading 43%, grade D-, #316 of 1,228 statewide, top 26%, 745 students, 49% FRL).
- Market conditions: Rents rising (+2.2%/yr); 203 active listings in the ZIP; 3 comparable units currently listed for rent nearby; rentals at typical pace (median 21d on market — plan ~3-4 weeks tenant-placement turnaround); solid renter incomes; 133 units permitted in Lee County in 2024 (0 in 5+ unit buildings).
Forward outlook
- Local home prices are declining (-3.0%/yr); year-one equity from $1k of loan paydown is wiped out by about $6k of value loss. Plan a longer hold.
- Lee County population projected at +8% by 2050 — modest demand growth; plan on rents tracking national, not racing it.
Negotiation context
- Only 1 days on market — expect competitive offers; lowballing is unlikely to land.
- Current owner paid $132k; list at $210k implies a 58% gain — meaningful room to come down on a strong offer.
Risks & watch-outs
- Climate carrying-cost: severe wind risk, 90% chance of damaging wind over 30y; moderate wildfire risk; extreme-heat days projected 7→19/yr by 2055 (HVAC capex compounding) — expect insurance premiums to compound above CPI over the hold.
Questions for the listing agent
- What do current leases actually rent for vs. the listed asking? Can we see a recent rent roll and the last 12 months of T-12 income?
- Is there a deadline driving the sale (1031 exchange, divorce, estate, relocation)? That informs how much negotiation room exists.
- The area grade is low — what's the realistic commute time and amenity access for the typical tenant pool here? Any planned neighborhood developments (good or bad) we should know about?
- What's the average days-on-market for RENTAL listings here right now (not sales)? A rising rental-DOM trend means longer vacancies and softer asking-rent achievability than the comps imply.
- What's the recent tenant-quality profile in this submarket — average credit score on applications, eviction rate, late-payment / NSF rate, and stable-employment percentage? A property-management company in the area should have these aggregated.
- How much new for-sale + rental construction is in the pipeline within 1–3 miles? Heavy new supply typically softens prices + rents 12–24 months out; constrained supply supports both.
Investment metrics
- 1% rule
- 0.79% ✗
- Cap rate
- 6.19%
- Cash-on-cash
- -0.35%
- DSCR
- 0.98
- GRM
- 10.6
CMA / ARV
No comps found within radius.
Projected returns pro-forma
-3.0% appreciation · 2.22% rent growth · sell at horizon
- IRR
- -17.7%
- Equity multiple
- 0.38×
- Total profit
- $-36,447
- Equity at exit
- $31,297
- IRR
- -11.3%
- Equity multiple
- 0.34×
- Total profit
- $-38,562
- Equity at exit
- $18,148
Cash invested: $58,772 (down + closing). Projections, not guarantees.
Landlord ↔ Tenant lean methodology
- Overall (STATE)
- 90 Strongly Landlord-Friendly
- State Georgia
- 90 Strongly Landlord-Friendly · R+3
- County
- — inherits STATE
- City
- — inherits STATE
ZIP-level market 31763
- Home prices YoY
- -15.9%
- Rents YoY
- 2.2%
- Active inventory
- 203
- Price-to-rent
- 10.6×
Monthly cashflow live
- Estimated rent
- $1,653 medium interval (Pro) →
- Mortgage (P&I)
- −$1,101
- Tax from tax record
- −$135 /mo · $1,617/yr
- Insurance
- −$87
- HOA
- −$0
- Vacancy / Maint / Mgmt
- −$347
- Net cashflow
- $-17
Break-even live
UW: 25.0% down · 7.5% · 30yr · 1.5% tax · 5.0% vac · 8.0% maint · 8.0% mgmt
Financing live
Cash to close
- Down payment
- $52,475
- Closing costs
- $6,297
- Reserves months
- —
- Total cash needed
- —
Loan-product check · same deal, 3 products live
Conventional
25% down · 7.5% · 30yr
- Down + closing
- —
- Monthly P&I
- —
- Monthly cashflow
- —
- DSCR
- —
- Eligible?
- —
Personal DTI + credit; lowest rate.
DSCR
20% down · 8.5% · 30yr
- Down + closing
- —
- Monthly P&I
- —
- Monthly cashflow
- —
- DSCR
- —
- Eligible?
- —
No personal income docs; deal must DSCR.
Hard money
10% down · 12.0% · 12mo
- Down + closing
- —
- Monthly P&I
- —
- Monthly cashflow
- —
- DSCR
- —
- Eligible?
- —
Short-term bridge; refi at stabilization.
Rent comps 3 comps
| Address | Beds | Baths | Sqft | Rent | $/sqft | DOM | Units | Dist |
|---|---|---|---|---|---|---|---|---|
| 103 Ducker Ct Leesburg, GA | 3.0 | 2.0 | 1491 | $1,535 | $1.03 | 43d | 1 | 0.56mi |
| 154 Nacoochee Dr Leesburg, GA | 3.0 | 2.0 | 1040 | $1,395 | $1.34 | 21d | 1 | 1.01mi |
| 110 Twelve Oaks Ct Leesburg, GA | 3.0 | 2.0 | 1277 | $1,465 | $1.15 | 21d | 1 | 1.37mi |
Listing history 4 events
-
2026-05-12status Under Contract
-
2026-05-11$209,900 New
-
2015-07-22soldstatus $132,500
-
2010-04-23soldstatus $28,500
ⓘ Source: listings_history table (triggers on properties + properties_extension) + one-shot
backfill from property_details.listing_events for pre-trigger history.
Tax reassessment forecast GA · Resets to sale price
- Current annual tax
- $1,617 · $135/mo
- Projected year-2 tax
- $1,931 · $161/mo
- Expected delta
- +$314/yr (+$26/mo · 19.4%)
ⓘ Screening estimate from a state-policy table — verify with the county assessor before closing.
Climate risk First Street
- Flood 1/10 Low FEMA zone X (unshaded) · 0% chance over 30 yrs
- Wildfire 5/10 Major
- Heat 8/10 Severe 7 d/yr ≥108°F today · 19 d/yr by 30 yrs out
- Wind 8/10 Severe 90% chance of damaging wind over 30 yrs
- Air quality 4/10 Moderate 6 unhealthy d/yr today · 6 by 30 yrs out
Nearby sold comps map
Loading sold comps map…
Walkable amenities ~0.75 mi
Loading nearby amenities…
Taxation est. · year 1
- Rental income
- $19,835
- − Mortgage interest
- −$11,758
- − Property taxes
- −$1,617
- − Insurance
- −$1,050
- − Repairs & maintenance
- −$1,587
- − Management
- −$1,587
- − Depreciation
- −$6,106
- Taxable loss
- −$3,869
- Est. tax savings @ 24.0%
- +$929
- After-tax cash flow
- $723/yr
For passive investors: Depreciation is non-cash, so a rental often shows a tax loss while cash-flowing — sheltering income. Rental losses are passive: they offset passive income freely, and up to $25,000/yr can offset ordinary (W-2) income if you actively participate and your MAGI is under $100k (phasing out to $0 by $150k); unused losses carry forward. On sale, claimed depreciation is recaptured at up to 25%, and gains may owe capital-gains tax (a 1031 exchange can defer both). Figures are a year-1 estimate at your 24.0% rate — not tax advice; consult a CPA.
Schools (NCES district)
- District
- Lee County
- NCES district ID
- 1303270
- Math proficiency
- 44% ▼ -12.00%
- Reading proficiency
- 45% ▼ -10.00%
- Median HH income
- $60,449
- Composite
- 39.23/100
- National rank
- #4009
- State rank
- #21 of 174 in GA
Livability — Leesburg
- Score
- 68/100
- State rank
- #135
- US rank
- #9283
Category grades
Schools grade is shown separately in the Schools card above.
Census & demographics
- Census place
- Leesburg, GA
- County
- Lee County · 29,271 people
- City population
- 29,271
- Metro
- Albany, GA
- Population (ZIP)
- 29,271
- Household income
- $88,312
- Rent vs Own
- Severe rent burden
- 700.0
Population outlook (Lee County) Hauer SSP2
- Today (2025)
- 31,140 people
- By 2030
- 31,753 · +2.0%
- By 2040
- 32,710 · +5.0%
- By 2050
- 33,476 · +7.5%
- By 2075
- 35,113 · +12.8%
- By 2100
- 34,821 · +11.8%
Race, ethnicity, and origin ACS 2023
- Neighborhood character
- Predominantly White (66%)
- Race & ethnicity
- White 66% Black 24% Two or more races 6% Hispanic / Latino 3% Asian 2%
- Common ancestry
- Slovak 2% Italian 2% Serbian 2%
- Foreign-born
- 5% · Canada, South Korea
- Languages at home
- 95% English-only · Spanish 2% Korean 1% Other Indo-European 1%
Political lean MEDSL · Lee
- 2024 margin
- Solid R (+43.5) · D 28.0% · R 71.6%
- 2008→2024 swing
- +8.6pp toward D · 2008: -52.1pp · 2024: -43.5pp
- All cycles
- 2024: R+43.5 2020: R+44.6 2016: R+53.0 2012: R+52.4 2008: R+52.1
Not yet ingested
- Civics
- —
Market trends
- HPI YoY
- ▼ -35.33%
- Current HPI
- 187.3672
- Rent YoY
- ▲ 2.22%
- Metro
- Albany, GA
- State GDP YoY
- ▲ 2.66%
- F500 in state
- 28
Industry mix (Fortune 500 HQ in GA)
| Industry | F500 HQs | Revenue |
|---|---|---|
| Paper / Packaging | 2 | $29B |
|
||
| Retail | 1 | $160B |
|
||
| Transportation / Logistics | 1 | $91B |
|
||
| Airlines | 1 | $62B |
|
||
| Consumer Goods | 1 | $47B |
|
||
| Utilities | 1 | $25B |
|
||
Price history
+636.5% since first listed4 events — show timeline
- 2026-05-12 Pending — GAMLS
- 2026-05-11 Listed $209,900 GAMLS
- 2015-07-22 Sold (Public Records) $132,500 Public Records
- 2010-04-23 Sold (Public Records) $28,500 Public Records
Property tax history
+1.2%/yrLatest (2025): $1,617 · +21.0% YoY. Source: county tax records.
Cash-flow waterfall
monthlySold comps — $/sqft
last 12 mo · ≤1 miLoading sold comps…