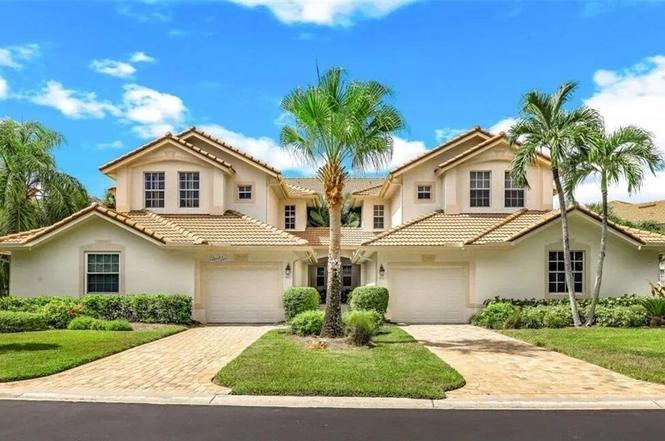
26926 Montego Pointe Ct Unit 202 · Bonita Springs, FL
Flood risk 9/10 · Severe
- FEMA flood zone
- AE
- Chance of flooding over 30 yrs
- 0.99%
- Est. flood insurance / yr
- $1,737 – $8,500
Fire risk 2/10 · Minimal
- Est. fire insurance / yr
- $947 – $1,759
Heat risk 10/10 · Severe
- Hot days now (above 107°F)
- 7 days/yr
- Hot days in 30 yrs
- 30 days/yr
Wind risk 10/10 · Severe
- Chance of severe wind over 30 yrs
- 99.0%
Air-quality risk 2/10 · Minimal
- Unhealthy air days now
- 1 days/yr
- Unhealthy air days in 30 yrs
- 1 days/yr
Risk factors via First Street. Map © Google.
Why this score? — see what drove the D grade
The composite is a weighted blend of 9 inputs, each scored 0–100. Each bar is that input's sub-score; the figure is the points it added to the 100-point composite (weight × sub-score).
- Cash flow +15.0/30.0
- ARV discount +7.5/15.0
- 1% rule +5.0/10.0
- DSCR +5.0/10.0
- Schools +4.1/10.0
- Livability +3.5/5.0
- Condition / age +2.5/5.0
- Rent growth +2.3/5.0
- Appreciation +0.0/10.0
$5,000
🖨 Deal sheet 📄 Offer letter ✓ Due diligence
Listing remarks
Foreclosure Auction Ends June 25, 2026 at 9:00 AM EST. Explore this charming 2-bedroom, 2-bath condo residence set in a peaceful and well-located Bonita Springs community. The list price is the opening bid for the online auction. Sold As-is. Explore more details and submit your bid through Federa Home App.
Key facts
- Built 2000
- Listed 4 days
Property features AI
Finance
- Financial info: Property listed for auction
- HOA & community: No association fee; Association fee includes: Other; No first right of refusal
Exterior
- Utilities: Utilities: Other - see remarks
- Home design: Other property type; Built in 2000; Less than 1/4 acre lot; Zoned OTH - Other Zoning; Subdivision: Other (999.9); Bay/Gulf side location
- Construction: Other construction; Not built above flood
- Exterior features: No waterfront; No water view; Dockage: Other dockage; Deed restrictions: None; Pets: See remarks; Rentals not allowed
Interior
- Bedrooms: Bedroom 1; Bedroom 2
- Bathrooms: 2 full bathrooms
- Interior features: Other appliances included
Neighborhood map
What this means for you Summary
Snapshot
- This is a 2-bed/2.0-bath condo listed at $5k.
Deal economics
- At list price, monthly cash flow is $2k ($21k/yr) — positive.
- The deal already cash-flows at list — no discount required.
- Meets the 1% rule at list price ($3k rent vs $5k).
- Cap rate 522.0% vs local median 1.7% in Bonita Springs — top-decile yield for the area; either an underpriced asset or a hidden risk that comps aren't pricing in. Stress-test before assuming the spread holds.
Location & tenants
- Location reads 70/100 on livability (#428 in FL) — a middle-class / working-renter tenant base. Strengths: crime A+, housing A+, employment A; Watch: schools C-, cost of living C-, health & safety D.
- Lee (suburban): math 47% / reading 50% proficiency, ranked #42 of 73 in FL (top 58%) — families likely to look elsewhere, expect single-tenant / working-renter base with shorter leases.
- Market conditions: Rents soft (-0.6%/yr); 835 active listings in the ZIP; 40 comparable units currently listed for rent nearby; rentals at typical pace (median 24d on market — plan ~3-4 weeks tenant-placement turnaround); solid renter incomes; 15,411 units permitted in Lee County in 2024 (4,686 in 5+ unit buildings).
- This rent runs 36% of the median local income ($91k/yr) — at the standard rent-burdened threshold; future hikes will face affordability resistance.
Forward outlook
- Local home prices are declining (-3.0%/yr); year-one equity from $35 of loan paydown is wiped out by about $150 of value loss. Plan a longer hold.
- Lee County population projected at +44% by 2050 — long-run rental-demand tailwind backs the buy-and-hold thesis.
- At projected returns (-3.0% appreciation + 0.0% rent growth), your $1k cash investment doubles in ~1 year — after that, you're playing with house money.
Negotiation context
- Only 5 days on market — expect competitive offers; lowballing is unlikely to land.
Risks & watch-outs
- Watch-outs: flood insurance adds $427/mo.
- Climate carrying-cost: in FEMA flood zone AE (mandatory federal flood insurance); severe wind risk, 99% chance of damaging wind over 30y; extreme-heat days projected 7→30/yr by 2055 (HVAC capex compounding) — expect insurance premiums to compound above CPI over the hold.
Questions for the listing agent
- What's the actual annual flood-insurance premium (NFIP or private), and is the property in a SFHA with mandatory coverage?
- Any open or pending special assessments — roof, HVAC, plumbing, elevator, façade? What's the per-unit balance and payoff schedule, and is the seller paying it off at close or rolling it to the buyer?
- Is there a deadline driving the sale (1031 exchange, divorce, estate, relocation)? That informs how much negotiation room exists.
- The area grade is low — what's the realistic commute time and amenity access for the typical tenant pool here? Any planned neighborhood developments (good or bad) we should know about?
- What's the average days-on-market for RENTAL listings here right now (not sales)? A rising rental-DOM trend means longer vacancies and softer asking-rent achievability than the comps imply.
- What's the recent tenant-quality profile in this submarket — average credit score on applications, eviction rate, late-payment / NSF rate, and stable-employment percentage? A property-management company in the area should have these aggregated.
- How much new apartment / multifamily construction is in the pipeline within 1–3 miles? Heavy new supply (>2% of stock underway) typically softens rents 12–24 months out; light construction supports rent growth.
Investment metrics
- 1% rule
- 55.27% ✓
- Cap rate
- 521.98%
- Cash-on-cash
- 1841.75%
- DSCR
- 82.95
- GRM
- 0.2
CMA / ARV
No comps found within radius.
Projected returns pro-forma
-3.0% appreciation · 0.0% rent growth · sell at horizon
- IRR
- —
- Equity multiple
- 73.20×
- Total profit
- $101,080
- Equity at exit
- $746
- IRR
- —
- Equity multiple
- 143.28×
- Total profit
- $199,191
- Equity at exit
- $432
Cash invested: $1,400 (down + closing). Projections, not guarantees.
Landlord ↔ Tenant lean methodology
- Overall (STATE)
- 87 Strongly Landlord-Friendly
- State Florida
- 87 Strongly Landlord-Friendly · R+3
- County
- — inherits STATE
- City
- — inherits STATE
ZIP-level market 34135
- Rents YoY
- -0.6%
- Active inventory
- 835
- Price-to-rent
- 0.2×
Monthly cashflow live
- Estimated rent
- $2,764 medium interval (Pro) →
- Mortgage (P&I)
- −$26
- Tax est. 1.5%
- −$6 /mo · $75/yr
- Insurance
- −$2
- Flood insurance flood zone
- −$427 /mo · $5,118/yr
- HOA
- −$0
- Vacancy / Maint / Mgmt
- −$580
- Net cashflow
- $1,722
Break-even live
UW: 25.0% down · 7.5% · 30yr · 1.5% tax · 5.0% vac · 8.0% maint · 8.0% mgmt
Financing live
Cash to close
- Down payment
- $1,250
- Closing costs
- $150
- Reserves months
- —
- Total cash needed
- —
Loan-product check · same deal, 3 products live
Conventional
25% down · 7.5% · 30yr
- Down + closing
- —
- Monthly P&I
- —
- Monthly cashflow
- —
- DSCR
- —
- Eligible?
- —
Personal DTI + credit; lowest rate.
DSCR
20% down · 8.5% · 30yr
- Down + closing
- —
- Monthly P&I
- —
- Monthly cashflow
- —
- DSCR
- —
- Eligible?
- —
No personal income docs; deal must DSCR.
Hard money
10% down · 12.0% · 12mo
- Down + closing
- —
- Monthly P&I
- —
- Monthly cashflow
- —
- DSCR
- —
- Eligible?
- —
Short-term bridge; refi at stabilization.
Rent comps 40 comps
| Address | Beds | Baths | Sqft | Rent | $/sqft | DOM | Units | Dist |
|---|---|---|---|---|---|---|---|---|
| 26926 Montego Pointe Ct #201 Bonita Springs, FL | 3.0 | 2.0 | 2008 | $9,500 | $4.73 | 23d | 1 | 0.01mi |
| 26960 Wyndhurst Ct #202 Bonita Springs, FL | 3.0 | 3.0 | 2836 | $11,000 | $3.88 | 23d | 1 | 0.08mi |
| 26968 Montego Pointe Ct #201 Bonita Springs, FL | 3.0 | 2.0 | 2008 | $4,100 | $2.04 | 23d | 1 | 0.15mi |
| 26871 Wyndhurst Ct #201 Bonita Springs, FL | 3.0 | 3.0 | 2836 | $12,000 | $4.23 | 23d | 1 | 0.17mi |
| 4811 Island Pond Ct #302 Bonita Springs, FL | 3.0 | 3.0 | 2728 | $13,000 | $4.77 | 13d | 1 | 0.20mi |
| 4140 Bayhead Dr #106 Bonita Springs, FL | 3.0 | 2.0 | 1583 | $8,200 | $5.18 | 23d | 1 | 0.36mi |
| 4120 Bayhead Dr #303 Bonita Springs, FL | 2.0 | 2.0 | 1523 | $7,000 | $4.60 | 23d | 1 | 0.44mi |
| 4240 Lake Forest Dr #423 Bonita Springs, FL | 2.0 | 2.0 | 1450 | $6,500 | $4.48 | 23d | 1 | 0.64mi |
| 26850 Wedgewood Dr #202 Bonita Springs, FL | 3.0 | 3.0 | 1781 | $8,500 | $4.77 | 23d | 1 | 0.73mi |
| 27080 Lake Harbor Ct #202 Bonita Springs, FL | 3.0 | 2.0 | 1654 | $7,200 | $4.35 | 23d | 1 | 0.73mi |
| 27080 Lake Harbor Ct #201 Bonita Springs, FL | 3.0 | 2.0 | 1764 | $7,500 | $4.25 | 23d | 1 | 0.73mi |
| 26881 Wedgewood Dr #201 Bonita Springs, FL | 3.0 | 2.0 | 1640 | $8,000 | $4.88 | 23d | 1 | 0.77mi |
| 4951 Bonita Bay Blvd #1503 Bonita Springs, FL | 3.0 | 3.0 | 2210 | $14,000 | $6.33 | 23d | 1 | 0.89mi |
| 4951 Bonita Bay Blvd #501 Bonita Springs, FL | 3.0 | 3.0 | 2379 | $13,000 | $5.46 | 23d | 1 | 0.89mi |
| 4951 Bonita Bay Blvd #1503 Bonita Springs, FL | 3.0 | 3.0 | 2210 | $8,000 | $3.62 | 14d | 1 | 0.89mi |
| 4951 Bonita Bay Blvd #1003 Bonita Springs, FL | 3.0 | 3.0 | 2068 | $11,100 | $5.37 | 16d | 1 | 0.89mi |
| 4951 Bonita Bay Blvd #1503 Bonita Springs, FL | 3.0 | 3.0 | 2210 | $14,500 | $6.56 | 3d | 1 | 0.89mi |
| 4951 Bonita Bay Blvd #901 Bonita Springs, FL | 3.0 | 2.5 | 2530 | $11,000 | $4.35 | 23d | 1 | 0.89mi |
| 4951 Bonita Bay Blvd #1204 Bonita Springs, FL | 3.0 | 3.0 | 1877 | $11,500 | $6.13 | 23d | 1 | 0.89mi |
| 27585 Imperial Shores Blvd Bonita Springs, FL | 3.0 | 3.0 | 1576 | $8,000 | $5.08 | 23d | 1 | 0.89mi |
| 26930 Wedgewood Dr #202 Bonita Springs, FL | 2.0 | 2.0 | 1620 | $5,500 | $3.40 | 23d | 1 | 0.94mi |
| 27579 Big Bend Rd Bonita Springs, FL | 3.0 | 2.0 | 1512 | $2,700 | $1.79 | 23d | 1 | 0.94mi |
| 27038 Oakwood Lake Dr Bonita Springs, FL | 3.0 | 3.0 | 1818 | $8,500 | $4.68 | 23d | 1 | 0.96mi |
| 27119 Oakwood Lake Dr Bonita Springs, FL | 3.0 | 2.5 | 1812 | $7,500 | $4.14 | 23d | 1 | 0.98mi |
| 27121 Oakwood Lake Dr Bonita Springs, FL | 3.0 | 2.5 | 1892 | $8,900 | $4.70 | 3d | 1 | 0.98mi |
| 27113 Oakwood Lake Dr Bonita Springs, FL | 3.0 | 2.5 | 1879 | $7,500 | $3.99 | 23d | 1 | 0.98mi |
| 27190 Oakwood Lake Dr #102 Bonita Springs, FL | 3.0 | 2.0 | 1603 | $7,500 | $4.68 | 23d | 1 | 0.99mi |
| 4879 Esplanade St Bonita Springs, FL | 3.0 | 2.5 | 1888 | $16,000 | $8.47 | 12d | 1 | 1.05mi |
| 27595 Imperial River Rd Bonita Springs, FL | 2.0 | 2.0 | 2103 | $2,700 | $1.28 | 23d | 1 | 1.10mi |
| 27595 Imperial River Rd Bonita Springs, FL | 2.0 | 2.0 | 2103 | $2,700 | $1.28 | 3d | 1 | 1.10mi |
| 4150 Tarpon Ave Bonita Springs, FL | 2.0 | 2.0 | 2103 | $2,700 | $1.28 | 3d | 1 | 1.10mi |
| 4150 Tarpon Ave Bonita Springs, FL | 2.0 | 2.0 | 2103 | $2,700 | $1.28 | 23d | 1 | 1.10mi |
| 27594 Shore Dr Bonita Springs, FL | 3.0 | 2.0 | 1426 | $5,500 | $3.86 | 23d | 1 | 1.17mi |
| 4860 Gary Rd Unit 4 Bonita Springs, FL | 3.0 | 2.0 | 1875 | $2,900 | $1.55 | 23d | 1 | 1.17mi |
| 4212 Rita Ln Bonita Springs, FL | 2.0 | 2.0 | 1428 | $1,475 | $1.03 | 23d | 1 | 1.21mi |
| 4412 Vanda Dr Bonita Springs, FL | 3.0 | 2.0 | 1800 | $2,800 | $1.56 | 23d | 1 | 1.22mi |
| 5731 Marimin Dr Unit 1073514P Bonita Springs, FL | 3.0 | 2.0 | 2249 | $5,637 | $2.51 | 3d | 1 | 1.25mi |
| 27052 Kindlewood Ln Bonita Springs, FL | 2.0 | 2.0 | 1584 | $3,700 | $2.34 | 3d | 1 | 1.27mi |
| 27123 Kindlewood Ln Bonita Springs, FL | 2.0 | 2.0 | 1715 | $4,500 | $2.62 | 23d | 1 | 1.30mi |
| 26773 Hickory Blvd #8 Bonita Springs, FL | 2.0 | 2.0 | 1444 | $6,500 | $4.50 | 23d | 1 | 1.32mi |
HOA detail condo
- Monthly dues
- $0 · $0/yr
- Assessments
- None detected in remarks — confirm with the listing agent.
Listing history 5 events
-
2026-06-18days on market $5,000 Active 5 DOM
-
2026-06-17days on market $5,000 Active 4 DOM
-
2026-06-16days on market $5,000 Active 3 DOM
-
2026-06-15remarks 307-char remark
-
2026-06-15$5,000 Active 2 DOM
ⓘ Source: listings_history table (triggers on properties + properties_extension) + one-shot
backfill from property_details.listing_events for pre-trigger history.
Climate risk First Street
- Flood 9/10 Extreme FEMA zone AE · 99% chance over 30 yrs
- Wildfire 2/10 Low
- Heat 10/10 Extreme 7 d/yr ≥107°F today · 30 d/yr by 30 yrs out
- Wind 10/10 Extreme 99% chance of damaging wind over 30 yrs
- Air quality 2/10 Low 1 unhealthy d/yr today · 1 by 30 yrs out
Nearby sold comps map
Loading sold comps map…
Walkable amenities ~0.75 mi
Loading nearby amenities…
Taxation est. · year 1
- Rental income
- $33,163
- − Mortgage interest
- −$280
- − Property taxes
- −$75
- − Insurance
- −$5,144
- − Repairs & maintenance
- −$2,653
- − Management
- −$2,653
- − Depreciation
- −$145
- Taxable income
- $22,213
- Est. tax owed @ 24.0%
- −$5,331
- After-tax cash flow
- $15,335/yr
For passive investors: Depreciation is non-cash, so a rental often shows a tax loss while cash-flowing — sheltering income. Rental losses are passive: they offset passive income freely, and up to $25,000/yr can offset ordinary (W-2) income if you actively participate and your MAGI is under $100k (phasing out to $0 by $150k); unused losses carry forward. On sale, claimed depreciation is recaptured at up to 25%, and gains may owe capital-gains tax (a 1031 exchange can defer both). Figures are a year-1 estimate at your 24.0% rate — not tax advice; consult a CPA.
Schools (NCES district)
- District
- Lee
- NCES district ID
- 1201080
- Math proficiency
- 47% ▼ -11.00%
- Reading proficiency
- 50% ▼ -4.00%
- Median HH income
- $49,518
- Composite
- 41.49/100
- National rank
- #3458
- State rank
- #42 of 73 in FL
Livability — Bonita Springs
- Score
- 70/100
- State rank
- #428
- US rank
- #7576
Category grades
Schools grade is shown separately in the Schools card above.
Census & demographics
- Census place
- Bonita Springs, FL
- County
- Lee County · 788,662 people
- City population
- 64,727
- Metro
- Cape Coral-Fort Myers, FL
- Population (ZIP)
- 48,252
- Household income
- $91,380
- Rent vs Own
- Severe rent burden
- 976.0
Population outlook (Lee County) Hauer SSP2
- Today (2025)
- 871,946 people
- By 2030
- 955,468 · +9.6%
- By 2040
- 1,113,587 · +27.7%
- By 2050
- 1,256,891 · +44.1%
- By 2075
- 1,560,270 · +78.9%
- By 2100
- 1,726,848 · +98.0%
Race, ethnicity, and origin ACS 2023
- Neighborhood character
- Predominantly White (69%)
- Race & ethnicity
- White 69% Hispanic / Latino 26% Two or more races 13% Native American 3% Black 2%
- Hispanic origin (detail)
- Mexican 8% Puerto Rican 4% Cuban 3%
- Common ancestry
- Romanian 5% Lithuanian 2% Slovak 2%
- Foreign-born
- 22% · Canada, Jamaica
- Languages at home
- 74% English-only · Spanish 21% French/Haitian/Cajun 1% Russian/Polish/Slavic 1%
Political lean MEDSL · Lee
- 2024 margin
- Strong R (+28.4) · D 35.5% · R 63.9%
- 2008→2024 swing
- -18.0pp toward R · 2008: -10.4pp · 2024: -28.4pp
- All cycles
- 2024: R+28.4 2020: R+19.2 2016: R+20.4 2012: R+16.6 2008: R+10.4
Not yet ingested
- Civics
- —
Market trends
- HPI YoY
- ▼ -188.86%
- Current HPI
- 243.4153
- Rent YoY
- ▼ -0.61%
- Metro
- Cape Coral-Fort Myers, FL
- State GDP YoY
- ▲ 3.28%
- F500 in state
- 36
Industry mix (Fortune 500 HQ in FL)
| Industry | F500 HQs | Revenue |
|---|---|---|
| Industrial Technology | 2 | $29B |
|
||
| Insurance | 2 | $17B |
|
||
| Retail | 1 | $60B |
|
||
| Technology Distribution | 1 | $58B |
|
||
| Homebuilding | 1 | $35B |
|
||
| Technology Manufacturing | 1 | $35B |
|
||
Price history
1 event — show timeline
- 2026-06-14 Listed $5,000 FLKMLS
Cash-flow waterfall
monthlySold comps — $/sqft
last 12 mo · ≤1 miLoading sold comps…