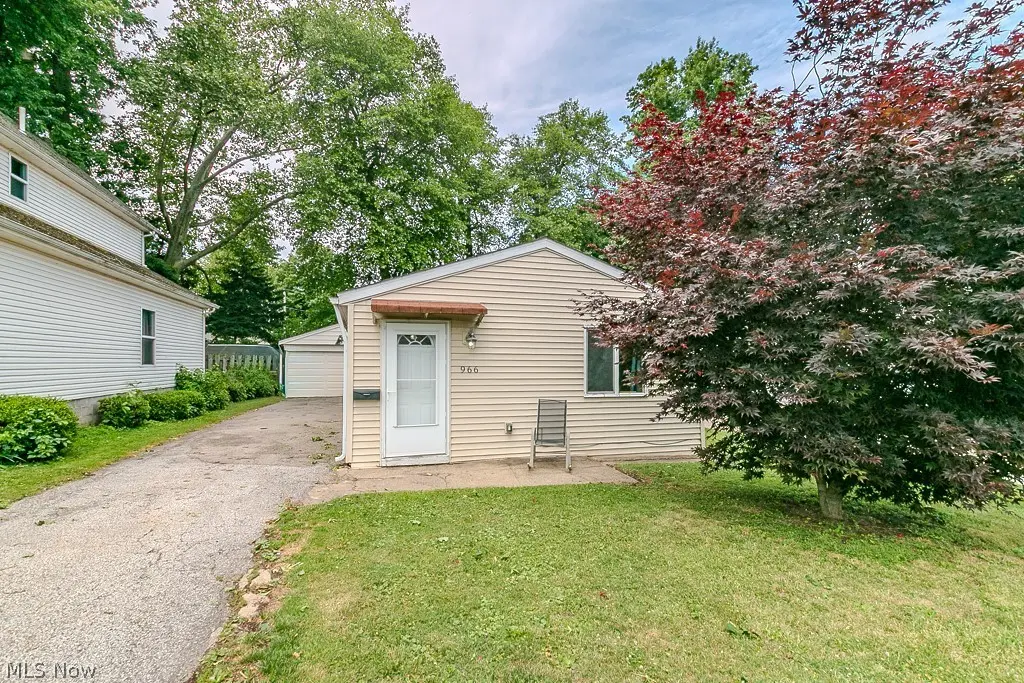
966 Windermere Dr · Willoughby, OH
Flood risk 1/10 · Minimal
- FEMA flood zone
- X (unshaded)
- Chance of flooding over 30 yrs
- 0.0%
- Est. flood insurance / yr
- $507 – $1,088
Fire risk 1/10 · Minimal
- Est. fire insurance / yr
- $713 – $1,323
Heat risk 3/10 · Minor
- Hot days now (above 93°F)
- 7 days/yr
- Hot days in 30 yrs
- 18 days/yr
Wind risk 1/10 · Minimal
- Chance of severe wind over 30 yrs
- —
Air-quality risk 4/10 · Minor
- Unhealthy air days now
- 6 days/yr
- Unhealthy air days in 30 yrs
- 6 days/yr
Risk factors via First Street. Map © Google.
Why this score? — see what drove the B- grade
The composite is a weighted blend of 9 inputs, each scored 0–100. Each bar is that input's sub-score; the figure is the points it added to the 100-point composite (weight × sub-score).
- Cash flow +24.2/30.0
- ARV discount +12.9/15.0
- DSCR +7.8/10.0
- 1% rule +6.1/10.0
- Schools +4.3/10.0
- Livability +3.8/5.0
- Rent growth +3.5/5.0
- Condition / age +2.5/5.0
- Appreciation +0.0/10.0
$135,000
🖨 Deal sheet 📄 Offer letter ✓ Due diligence
Listing remarks MLS
Show And Sell This Cute 2 Bdrm Ranch On Double Lot With Woodburning Fireplace In Master Bdrm. New Carpet And New Bath
Key facts
- New hot water tank
- Private backyard
- Covered back patio
Tags
Property features AI
Exterior
- Parking: Detached garage; Driveway; On-street parking; Asphalt surfaces; 1 garage space
- Utilities: Public water; Public sewer
- Home design: Single-story home; Slab foundation; Vinyl siding; Asphalt/fiberglass roof
- Construction: Built (year per public records); Vinyl siding construction; Asphalt/fiberglass roof; Slab foundation
- Exterior features: Covered patio with awning(s); Partial fencing; Has a view
Interior
- Kitchen: Range; Refrigerator
- Bedrooms: 2 main-level bedrooms
- Bathrooms: 1 full bathroom (main level)
- Heating & cooling: Baseboard heating; Ceiling fan(s) for cooling
- Interior features: Updated/remodeled condition; Total of 5 rooms
Neighborhood map
What this means for you Summary
Snapshot
- This is a 2-bed/1.0-bath single-family listed at $135k.
Deal economics
- At list price, monthly cash flow is $270 ($3k/yr) — positive.
- The deal already cash-flows at list — no discount required.
- Meets the 1% rule at list price ($1k rent vs $135k).
- Cap rate 8.7% vs local median 2.8% in Willoughby — top-decile yield for the area; either an underpriced asset or a hidden risk that comps aren't pricing in. Stress-test before assuming the spread holds.
Location & tenants
- Location reads 75/100 on livability (#249 in OH, #3,972 nationally) — a middle-class / working-renter tenant base. Strengths: crime A+, cost of living A+, housing A+; Watch: health & safety D, amenities F, commute F.
- Willoughby-Eastlake City (suburban): math 42% / reading 58% proficiency, ranked #434 of 656 in OH (top 66%) — acceptable for families but not a draw, mixed tenant base, ~2y average lease.
- Market conditions: Rents rising fast (+4.0%/yr); 187 active listings in the ZIP; 5 comparable units currently listed for rent nearby; rentals leasing fast (median 2d on market — plan ~1-2 weeks tenant-placement turnaround); solid renter incomes; 448 units permitted in Lake County in 2024 (0 in 5+ unit buildings).
Forward outlook
- Local home prices are declining (-3.0%/yr); year-one equity from $933 of loan paydown is wiped out by about $4k of value loss. Plan a longer hold.
- Lake County population projected to shrink 8% by 2050 — rents likely to lag national; underwrite the cash flow, not the appreciation.
Negotiation context
- Only 1 days on market — expect competitive offers; lowballing is unlikely to land.
- 4 sale attempts since 34y ago with the ask held roughly flat each time — persistent listings suggest the price (not the market) is what's stuck; bring a comps-based counter.
- Current owner paid $45k; list at $135k implies a 200% gain — meaningful room to come down on a strong offer.
Risks & watch-outs
- Watch-outs: built in 1933 — expect roof / HVAC / electrical / plumbing capex.
Questions for the listing agent
- Built in 1933 — when were the roof, HVAC, electrical panel, plumbing, and water heater last replaced?
- Is there a deadline driving the sale (1031 exchange, divorce, estate, relocation)? That informs how much negotiation room exists.
- Schools are B-rated — typically a magnet for longer-tenancy family renters. What's the average tenant stay here, and is there a school-zone premium baked into asking?
- What's the average days-on-market for RENTAL listings here right now (not sales)? A rising rental-DOM trend means longer vacancies and softer asking-rent achievability than the comps imply.
- What's the recent tenant-quality profile in this submarket — average credit score on applications, eviction rate, late-payment / NSF rate, and stable-employment percentage? A property-management company in the area should have these aggregated.
- How much new for-sale + rental construction is in the pipeline within 1–3 miles? Heavy new supply typically softens prices + rents 12–24 months out; constrained supply supports both.
Investment metrics
- 1% rule
- 1.11% ✓
- Cap rate
- 8.69%
- Cash-on-cash
- 8.57%
- DSCR
- 1.38
- GRM
- 7.5
CMA / ARV
- ARV (on-the-fly)
- $153,600
- Comps found
- 6
Show comp detail 6 sales within ~0.75 mi
| Address | Dist | Beds/Ba | Sqft | Sold | Price | $/sf | Match |
|---|---|---|---|---|---|---|---|
| 38376 N Beachview Rd | 0.04mi | 1/1.5 (-1) | 800 (0%) | 14mo | $120,000 | $150 | 80 |
| 919 Eaglewood Dr | 0.23mi | 2/1.0 | 880 (+10%) | 9mo | $169,000 | $192 | 65 |
| 6436 Seneca Trl | 0.73mi | 2/1.0 | 836 (+4%) | 2mo | $171,000 | $205 | 57 |
| 6416 Seneca Trl | 0.73mi | 2/1.0 | 762 (-5%) | 8mo | $170,000 | $223 | 52 |
| 997 Mohegan Trl | 0.53mi | 3/1.0 (+1) | 898 (+12%) | 14mo | $142,000 | $158 | 39 |
| 809 Birchwood Dr | 0.52mi | 3/1.0 (+1) | 900 (+12%) | 20mo | $159,000 | $177 | 33 |
Match score weights: distance 35% · size 25% · config 20% · recency 20%. Top-matched comps best support the ARV.
Projected returns pro-forma
-3.0% appreciation · 4.01% rent growth · sell at horizon
- IRR
- -2.2%
- Equity multiple
- 0.92×
- Total profit
- $-3,140
- Equity at exit
- $20,129
- IRR
- 8.6%
- Equity multiple
- 1.68×
- Total profit
- $25,863
- Equity at exit
- $11,672
Cash invested: $37,800 (down + closing). Projections, not guarantees.
Landlord ↔ Tenant lean methodology
- Overall (STATE)
- 73 Landlord-Friendly
- State Ohio
- 73 Landlord-Friendly · R+6
- County
- — inherits STATE
- City
- — inherits STATE
ZIP-level market 44094
- Rents YoY
- 4.0%
- Active inventory
- 187
- Price-to-rent
- 7.5×
Monthly cashflow live
- Estimated rent
- $1,494 high interval (Pro) →
- Mortgage (P&I)
- −$708
- Tax from tax record
- −$146 /mo · $1,753/yr
- Insurance
- −$56
- HOA
- −$0
- Vacancy / Maint / Mgmt
- −$314
- Net cashflow
- $270
Break-even live
UW: 25.0% down · 7.5% · 30yr · 1.5% tax · 5.0% vac · 8.0% maint · 8.0% mgmt
Financing live
Cash to close
- Down payment
- $33,750
- Closing costs
- $4,050
- Reserves months
- —
- Total cash needed
- —
Loan-product check · same deal, 3 products live
Conventional
25% down · 7.5% · 30yr
- Down + closing
- —
- Monthly P&I
- —
- Monthly cashflow
- —
- DSCR
- —
- Eligible?
- —
Personal DTI + credit; lowest rate.
DSCR
20% down · 8.5% · 30yr
- Down + closing
- —
- Monthly P&I
- —
- Monthly cashflow
- —
- DSCR
- —
- Eligible?
- —
No personal income docs; deal must DSCR.
Hard money
10% down · 12.0% · 12mo
- Down + closing
- —
- Monthly P&I
- —
- Monthly cashflow
- —
- DSCR
- —
- Eligible?
- —
Short-term bridge; refi at stabilization.
Rent comps 5 comps
| Address | Beds | Baths | Sqft | Rent | $/sqft | DOM | Units | Dist |
|---|---|---|---|---|---|---|---|---|
| 38280 North Ln Unit J-208 Willoughby, OH | 3.0 | 2.0 | 1100 | $1,400 | $1.27 | 24d | 1 | 0.53mi |
| 38280 North Ln Unit H-206 Willoughby, OH | 3.0 | 2.0 | 1100 | $1,400 | $1.27 | 44d | 1 | 0.53mi |
| 38360 Tamarac Blvd Willoughby, OH | 1.0–2.0 | 1.0–2.0 | 950 | $1,835 | $1.93 | 2d | 29 | 0.77mi |
| 6177 Iroquois Trl Mentor, OH | 3.0 | 1.0 | 1116 | $1,700 | $1.52 | 2d | 1 | 0.78mi |
| 6247 Seneca Rd Mentor, OH | 3.0 | 1.0 | 912 | $1,750 | $1.92 | 2d | 1 | 0.80mi |
Listing history 2 events
-
2026-06-18remarks 699-char remark
-
2026-06-18$135,000 Active 1 DOM
ⓘ Source: listings_history table (triggers on properties + properties_extension) + one-shot
backfill from property_details.listing_events for pre-trigger history.
Tax reassessment forecast OH · Partial reset (capped growth)
- Current annual tax
- $1,753 · $146/mo
- Projected year-2 tax
- $1,930 · $161/mo
- Expected delta
- +$176/yr (+$15/mo · 10.1%)
ⓘ Screening estimate from a state-policy table — verify with the county assessor before closing.
Climate risk First Street
- Flood 1/10 Low FEMA zone X (unshaded) · 0% chance over 30 yrs
- Wildfire 1/10 Low
- Heat 3/10 Moderate 7 d/yr ≥93°F today · 18 d/yr by 30 yrs out
- Wind 1/10 Low
- Air quality 4/10 Moderate 6 unhealthy d/yr today · 6 by 30 yrs out
Nearby sold comps map
Loading sold comps map…
Walkable amenities ~0.75 mi
Loading nearby amenities…
Taxation est. · year 1
- Rental income
- $17,928
- − Mortgage interest
- −$7,562
- − Property taxes
- −$1,753
- − Insurance
- −$675
- − Repairs & maintenance
- −$1,434
- − Management
- −$1,434
- − Depreciation
- −$3,927
- Taxable income
- $1,142
- Est. tax owed @ 24.0%
- −$274
- After-tax cash flow
- $2,965/yr
For passive investors: Depreciation is non-cash, so a rental often shows a tax loss while cash-flowing — sheltering income. Rental losses are passive: they offset passive income freely, and up to $25,000/yr can offset ordinary (W-2) income if you actively participate and your MAGI is under $100k (phasing out to $0 by $150k); unused losses carry forward. On sale, claimed depreciation is recaptured at up to 25%, and gains may owe capital-gains tax (a 1031 exchange can defer both). Figures are a year-1 estimate at your 24.0% rate — not tax advice; consult a CPA.
Schools (NCES district)
- District
- Willoughby-Eastlake City
- NCES district ID
- 3904510
- Math proficiency
- 42% ▼ -21.00%
- Reading proficiency
- 58% ▼ -11.00%
- Median HH income
- $52,500
- Composite
- 42.96/100
- National rank
- #3110
- State rank
- #434 of 656 in OH
Livability — Willoughby
- Score
- 75/100
- State rank
- #249
- US rank
- #3972
Category grades
Schools grade is shown separately in the Schools card above.
Census & demographics
- Census place
- Willoughby, OH
- County
- Lake County · 204,927 people
- City population
- 36,873
- Metro
- Cleveland-Elyria, OH
- Population (ZIP)
- 36,873
- Household income
- $78,772
- Rent vs Own
- Severe rent burden
- 1381.0
Population outlook (Lake County) Hauer SSP2
- Today (2025)
- 230,022 people
- By 2030
- 228,151 · -0.8%
- By 2040
- 221,018 · -3.9%
- By 2050
- 212,754 · -7.5%
- By 2075
- 200,309 · -12.9%
- By 2100
- 183,315 · -20.3%
Race, ethnicity, and origin ACS 2023
- Neighborhood character
- Predominantly White (86%)
- Race & ethnicity
- White 86% Black 7% Two or more races 4% Hispanic / Latino 2% Asian 2%
- Common ancestry
- Romanian 7% Lithuanian 2% Slovak 2%
- Foreign-born
- 7% · Canada, China
- Languages at home
- 92% English-only · Russian/Polish/Slavic 3% Other Indo-European 1% German/W. Germanic 1%
Political lean MEDSL · Lake
- 2024 margin
- R (+14.3) · D 42.4% · R 56.7%
- 2008→2024 swing
- -15.2pp toward R · 2008: 0.8pp · 2024: -14.3pp
- All cycles
- 2024: R+14.3 2020: R+13.6 2016: R+15.6 2012: R+1.7 2008: D+0.8
Not yet ingested
- Civics
- —
Market trends
- HPI YoY
- ▼ -229.28%
- Current HPI
- 179.81
- Rent YoY
- ▲ 4.01%
- Metro
- Cleveland-Elyria, OH
- State GDP YoY
- ▲ 1.98%
- F500 in state
- 48
Industry mix (Fortune 500 HQ in OH)
| Industry | F500 HQs | Revenue |
|---|---|---|
| Insurance | 3 | $145B |
|
||
| Industrial Machinery | 3 | $49B |
|
||
| Financial Services | 3 | $24B |
|
||
| Consumer Goods | 2 | $93B |
|
||
| Aerospace / Defense | 2 | $47B |
|
||
| Utilities | 2 | $33B |
|
||
Price history
+246.2% since first listed12 events — show timeline
- 2026-06-18 Listed $135,000 MLSNOW
- 2018-08-31 Sold (Public Records) $45,000 Public Records
- 2007-11-14 Listing Removed — MLSNOW
- 2007-05-14 Listed $68,900 MLSNOW
- 1994-12-30 Sold (Public Records) $45,000 Public Records
- 1994-12-30 Sold (Public Records) $45,000 Public Records
- 1994-12-30 Sold (MLS) $45,000 MLSNOW
- 1994-12-20 Listing Removed — MLSNOW
- 1993-11-26 Listed $49,900 MLSNOW
- 1992-10-06 Listing Removed — MLSNOW
- 1992-04-06 Listed $45,000 MLSNOW
- 1990-03-30 Sold (Public Records) $39,000 Public Records
Property tax history
+4.2%/yrLatest (2025): $1,753 · -1.7% YoY. Source: county tax records.
Cash-flow waterfall
monthlySold comps — $/sqft
last 12 mo · ≤1 miLoading sold comps…