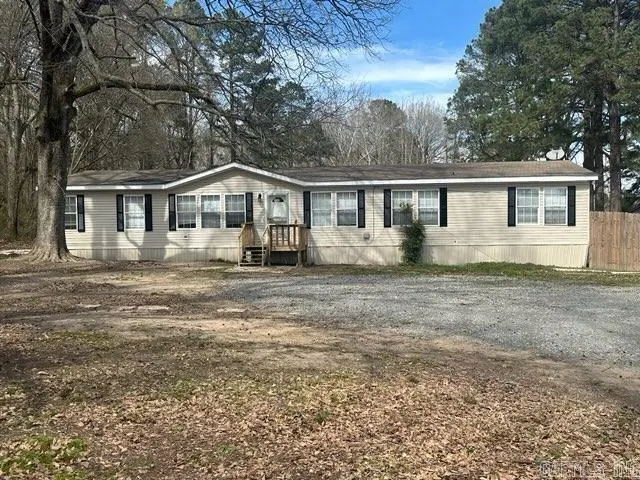
1201 N Rock St · Sheridan, AR
Flood risk 1/10 · Minimal
- FEMA flood zone
- X (unshaded)
- Chance of flooding over 30 yrs
- 0.0%
- Est. flood insurance / yr
- $507 – $1,088
Fire risk 5/10 · Moderate
- Est. fire insurance / yr
- $1,499 – $2,785
Heat risk 7/10 · Major
- Hot days now (above 110°F)
- 7 days/yr
- Hot days in 30 yrs
- 21 days/yr
Wind risk 4/10 · Minor
- Chance of severe wind over 30 yrs
- 19.0%
Air-quality risk 1/10 · Minimal
- Unhealthy air days now
- 0 days/yr
- Unhealthy air days in 30 yrs
- 0 days/yr
Risk factors via First Street. Map © Google.
Why this score? — see what drove the D+ grade
The composite is a weighted blend of 9 inputs, each scored 0–100. Each bar is that input's sub-score; the figure is the points it added to the 100-point composite (weight × sub-score).
- Cash flow +18.0/30.0
- ARV discount +7.5/15.0
- DSCR +5.6/10.0
- 1% rule +3.7/10.0
- Livability +3.4/5.0
- Schools +3.2/10.0
- Rent growth +2.5/5.0
- Condition / age +2.5/5.0
- Appreciation +0.0/10.0
$169,000
🖨 Deal sheet 📄 Offer letter ✓ Due diligence
Listing remarks MLS
Come check out this large, 4 bed 3 bath home! It also boasts a separate dining room and a large laundry room.
Key facts
- Separate dining room
- Large laundry room
- 0.8 acre lot
Tags
Neighborhood map
What this means for you Summary
Snapshot
- This is a 4-bed/3.0-bath manufactured listed at $169k.
Deal economics
- At list price, monthly cash flow is $145 ($2k/yr) — positive.
- The deal already cash-flows at list — no discount required.
- To meet the 1% rule (rent ≥ 1% of price), the offer needs to be $147k (13.3% below list).
- Recommended offer: $147k (13.3% below list) — sets the bar for 1% rule.
- Cap rate 7.3% vs local median 3.7% in Sheridan — top-decile yield for the area; either an underpriced asset or a hidden risk that comps aren't pricing in. Stress-test before assuming the spread holds.
Location & tenants
- Location reads 68/100 on livability (#85 in AR) — a middle-class / working-renter tenant base. Strengths: cost of living A+, housing A+, health & safety A; Watch: employment C-, crime D, amenities F.
- Sheridan School District (town): math 36% / reading 38% proficiency, ranked #89 of 238 in AR (top 37%) — families likely to look elsewhere, expect single-tenant / working-renter base with shorter leases.
- Market conditions: 137 active listings in the ZIP; 28 units permitted in Grant County in 2024 (0 in 5+ unit buildings).
Forward outlook
- Local home prices are declining (-3.0%/yr); year-one equity from $1k of loan paydown is wiped out by about $5k of value loss. Plan a longer hold.
- Grant County population projected to shrink 3% by 2050 — rents likely to lag national; underwrite the cash flow, not the appreciation.
Negotiation context
- It's been on market 156 days — a 12% lower offer ($149k) is reasonable based on typical stale-listing flexibility.
- 4 sale attempts since 5y ago with the ask held roughly flat each time — persistent listings suggest the price (not the market) is what's stuck; bring a comps-based counter.
Risks & watch-outs
- Climate carrying-cost: moderate wildfire risk; extreme-heat days projected 7→21/yr by 2055 (HVAC capex compounding) — expect insurance premiums to compound above CPI over the hold.
Questions for the listing agent
- It's been on market 156 days. Have you received any prior offers? Is the seller open to a 13% concession, seller financing, or rate buy-down credit?
- Why hasn't it sold? Are there any deal-killer items the seller is aware of (foundation, flood, title, zoning, code violations)?
- Is there a deadline driving the sale (1031 exchange, divorce, estate, relocation)? That informs how much negotiation room exists.
- Crime grade is D in this area — have there been break-ins, vandalism, or insurance claims at this property in the last 3 years? What carrier currently insures it and at what premium?
- The area grade is low — what's the realistic commute time and amenity access for the typical tenant pool here? Any planned neighborhood developments (good or bad) we should know about?
- What's the average days-on-market for RENTAL listings here right now (not sales)? A rising rental-DOM trend means longer vacancies and softer asking-rent achievability than the comps imply.
- What's the recent tenant-quality profile in this submarket — average credit score on applications, eviction rate, late-payment / NSF rate, and stable-employment percentage? A property-management company in the area should have these aggregated.
- How much new for-sale + rental construction is in the pipeline within 1–3 miles? Heavy new supply typically softens prices + rents 12–24 months out; constrained supply supports both.
Investment metrics
- 1% rule
- 0.87% ✗
- Cap rate
- 7.32%
- Cash-on-cash
- 3.68%
- DSCR
- 1.16
- GRM
- 9.6
CMA / ARV
No comps found within radius.
Projected returns pro-forma
-3.0% appreciation · 3.0% rent growth · sell at horizon
- IRR
- -10.6%
- Equity multiple
- 0.62×
- Total profit
- $-18,218
- Equity at exit
- $25,198
- IRR
- -1.3%
- Equity multiple
- 0.91×
- Total profit
- $-4,261
- Equity at exit
- $14,612
Cash invested: $47,320 (down + closing). Projections, not guarantees.
Landlord ↔ Tenant lean methodology
- Overall (STATE)
- 92 Strongly Landlord-Friendly
- State Arkansas
- 92 Strongly Landlord-Friendly · R+14
- County
- — inherits STATE
- City
- — inherits STATE
ZIP-level market 72150
- Home prices YoY
- -18.1%
- Active inventory
- 137
- Price-to-rent
- 9.6×
Monthly cashflow live
- Estimated rent
- $1,466 medium interval (Pro) →
- Mortgage (P&I)
- −$886
- Tax from tax record
- −$56 /mo · $677/yr
- Insurance
- −$70
- HOA
- −$0
- Vacancy / Maint / Mgmt
- −$308
- Net cashflow
- $145
Break-even live
UW: 25.0% down · 7.5% · 30yr · 1.5% tax · 5.0% vac · 8.0% maint · 8.0% mgmt
Financing live
Cash to close
- Down payment
- $42,250
- Closing costs
- $5,070
- Reserves months
- —
- Total cash needed
- —
Loan-product check · same deal, 3 products live
Conventional
25% down · 7.5% · 30yr
- Down + closing
- —
- Monthly P&I
- —
- Monthly cashflow
- —
- DSCR
- —
- Eligible?
- —
Personal DTI + credit; lowest rate.
DSCR
20% down · 8.5% · 30yr
- Down + closing
- —
- Monthly P&I
- —
- Monthly cashflow
- —
- DSCR
- —
- Eligible?
- —
No personal income docs; deal must DSCR.
Hard money
10% down · 12.0% · 12mo
- Down + closing
- —
- Monthly P&I
- —
- Monthly cashflow
- —
- DSCR
- —
- Eligible?
- —
Short-term bridge; refi at stabilization.
Listing history 32 events
-
2026-06-18days on market $169,000 Active 156 DOM
-
2026-06-17days on market $169,000 Active 155 DOM
-
2026-06-16days on market $169,000 Active 154 DOM
-
2026-06-15days on market $169,000 Active 153 DOM
-
2026-06-14days on market $169,000 Active 151 DOM
-
2026-06-10days on market $169,000 Active 148 DOM
-
2026-06-09days on market $169,000 Active 147 DOM
-
2026-06-08days on market $169,000 Active 146 DOM
-
2026-06-07days on market $169,000 Active 145 DOM
-
2026-06-05days on market $169,000 Active 142 DOM
-
2026-06-03days on market $169,000 Active 141 DOM
-
2026-06-02days on market $169,000 Active 140 DOM
-
2026-06-01days on market $169,000 Active 139 DOM
-
2026-05-31days on market $169,000 Active 138 DOM
-
2026-05-31days on market $169,000 Active 137 DOM
-
2026-01-13$169,000 New Listing 109-char remark
Show marketing remark (109 chars)
Come check out this large, 4 bed 3 bath home! It also boasts a separate dining room and a large laundry room.
-
2026-01-01historical
-
2025-11-25price $175,000
-
2025-11-07price $182,500
-
2025-11-06status Price Change
-
2025-11-01historical
-
2025-09-20price $185,500
-
2025-07-02price $189,500
-
2025-05-06price $194,500
-
2025-04-01$199,500 New Listing
-
2022-03-04status Under Contract
-
2022-03-01historical
-
2022-02-11price $138,000
-
2022-01-17price $148,000
-
2021-12-09price $158,000
-
2021-11-30price $158,800
-
2021-11-10$168,800 New Listing
ⓘ Source: listings_history table (triggers on properties + properties_extension) + one-shot
backfill from property_details.listing_events for pre-trigger history.
Tax reassessment forecast AR · Resets to sale price
- Current annual tax
- $677 · $56/mo
- Projected year-2 tax
- $1,082 · $90/mo
- Expected delta
- +$404/yr (+$34/mo · 59.7%)
ⓘ Screening estimate from a state-policy table — verify with the county assessor before closing.
Climate risk First Street
- Flood 1/10 Low FEMA zone X (unshaded) · 0% chance over 30 yrs
- Wildfire 5/10 Major
- Heat 7/10 Severe 7 d/yr ≥110°F today · 21 d/yr by 30 yrs out
- Wind 4/10 Moderate 19% chance of damaging wind over 30 yrs
- Air quality 1/10 Low 0 unhealthy d/yr today · 0 by 30 yrs out
Nearby sold comps map
Loading sold comps map…
Walkable amenities ~0.75 mi
Loading nearby amenities…
Taxation est. · year 1
- Rental income
- $17,593
- − Mortgage interest
- −$9,467
- − Property taxes
- −$677
- − Insurance
- −$845
- − Repairs & maintenance
- −$1,407
- − Management
- −$1,407
- − Depreciation
- −$4,916
- Taxable loss
- −$1,127
- Est. tax savings @ 24.0%
- +$271
- After-tax cash flow
- $2,012/yr
For passive investors: Depreciation is non-cash, so a rental often shows a tax loss while cash-flowing — sheltering income. Rental losses are passive: they offset passive income freely, and up to $25,000/yr can offset ordinary (W-2) income if you actively participate and your MAGI is under $100k (phasing out to $0 by $150k); unused losses carry forward. On sale, claimed depreciation is recaptured at up to 25%, and gains may owe capital-gains tax (a 1031 exchange can defer both). Figures are a year-1 estimate at your 24.0% rate — not tax advice; consult a CPA.
Schools (NCES district)
- District
- Sheridan School District
- NCES district ID
- 0500015
- Math proficiency
- 36% ▼ -16.00%
- Reading proficiency
- 38% ▼ -9.00%
- Median HH income
- $49,974
- Composite
- 32.0/100
- National rank
- #5831
- State rank
- #89 of 238 in AR
Livability — Sheridan
- Score
- 68/100
- State rank
- #85
- US rank
- #9469
Category grades
Schools grade is shown separately in the Schools card above.
Census & demographics
- Census place
- Sheridan, AR
- City population
- 12,476
- Population (ZIP)
- 12,476
Population outlook (Grant County) Hauer SSP2
- Today (2025)
- 18,477 people
- By 2030
- 18,551 · +0.4%
- By 2040
- 18,442 · -0.2%
- By 2050
- 17,901 · -3.1%
- By 2075
- 16,240 · -12.1%
- By 2100
- 13,761 · -25.5%
Race, ethnicity, and origin ACS 2023
- Neighborhood character
- Predominantly White (91%)
- Race & ethnicity
- White 91% Two or more races 5% Hispanic / Latino 3% Black 2%
- Common ancestry
- Lithuanian 1% Iranian 1% Serbian 1%
- Foreign-born
- 1% · Canada, China
- Languages at home
- 99% English-only · Spanish 1%
Political lean MEDSL · Grant
- 2024 margin
- Solid R (+68.9) · D 14.8% · R 83.6% · Other 1.6%
- 2008→2024 swing
- -17.9pp toward R · 2008: -51.0pp · 2024: -68.9pp
- All cycles
- 2024: R+68.9 2020: R+67.4 2016: R+54.7 2012: R+51.9 2008: R+51.0
Not yet ingested
- Civics
- —
Market trends
- HPI YoY
- ▼ -37.06%
- Current HPI
- 167.1638
- Rent YoY
- —
- Metro
- —
- State GDP YoY
- ▲ 3.80%
- F500 in state
- 10
Industry mix (Fortune 500 HQ in AR)
| Industry | F500 HQs | Revenue |
|---|---|---|
| Retail | 1 | $681B |
|
||
| Food / Agriculture | 1 | $53B |
|
||
| Retail / Energy | 1 | $22B |
|
||
| Transportation / Logistics | 1 | $12B |
|
||
| Energy | 1 | $4B |
|
||
Price history
+0.1% since first listed17 events — show timeline
- 2026-01-13 Listed $169,000 CARMLS
- 2026-01-01 Listing Removed — CARMLS
- 2025-11-25 Price Changed $175,000 CARMLS
- 2025-11-07 Price Changed $182,500 CARMLS
- 2025-11-06 Relisted — CARMLS
- 2025-11-01 Listing Removed — CARMLS
- 2025-09-20 Price Changed $185,500 CARMLS
- 2025-07-02 Price Changed $189,500 CARMLS
- 2025-05-06 Price Changed $194,500 CARMLS
- 2025-04-01 Listed $199,500 CARMLS
- 2022-03-04 Pending — CARMLS
- 2022-03-01 Listing Removed — CARMLS
- 2022-02-11 Price Changed $138,000 CARMLS
- 2022-01-17 Price Changed $148,000 CARMLS
- 2021-12-09 Price Changed $158,000 CARMLS
- 2021-11-30 Price Changed $158,800 CARMLS
- 2021-11-10 Listed $168,800 CARMLS
Property tax history
+3.4%/yrLatest (2025): $677 · +7.1% YoY. Source: county tax records.
Cash-flow waterfall
monthlySold comps — $/sqft
last 12 mo · ≤1 miLoading sold comps…