 🔨 Auction
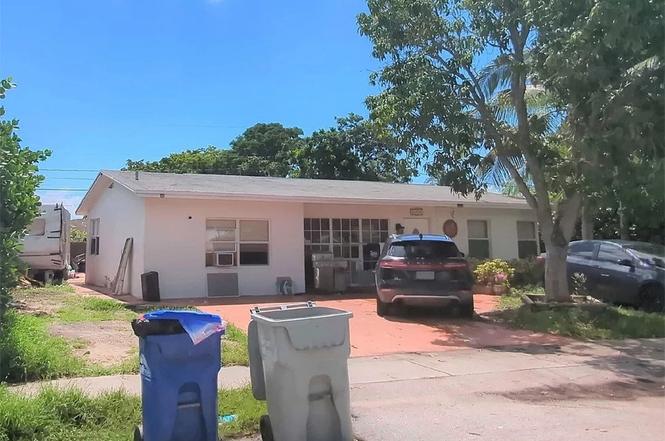
3160 NE 11th Ave · Pompano Beach, FL
Flood risk 1/10 · Minimal
- FEMA flood zone
- X (shaded)
- Chance of flooding over 30 yrs
- 0.0%
- Est. flood insurance / yr
- $507 – $1,088
Fire risk 1/10 · Minimal
- Est. fire insurance / yr
- $947 – $1,759
Heat risk 10/10 · Severe
- Hot days now (above 106°F)
- 7 days/yr
- Hot days in 30 yrs
- 26 days/yr
Wind risk 10/10 · Severe
- Chance of severe wind over 30 yrs
- 99.0%
Air-quality risk 2/10 · Minimal
- Unhealthy air days now
- 1 days/yr
- Unhealthy air days in 30 yrs
- 3 days/yr
Risk factors via First Street. Map © Google.
Why this score? — see what drove the F grade
The composite is a weighted blend of 9 inputs, each scored 0–100. Each bar is that input's sub-score; the figure is the points it added to the 100-point composite (weight × sub-score).
- ARV discount +7.5/15.0
- Cash flow +6.6/30.0
- Schools +4.1/10.0
- Livability +3.7/5.0
- Rent growth +2.9/5.0
- Condition / age +2.5/5.0
- 1% rule +1.7/10.0
- DSCR +0.9/10.0
- Appreciation +0.0/10.0
$5,000
🖨 Deal sheet 📄 Offer letter ✓ Due diligence
Listing remarks
Foreclosure Auction Ends June 24, 2026 at 10:00 AM EST. Explore this charming 3-bedroom, 2-bath residence set in a peaceful and well-located Pompano Beach community. The list price is the opening bid for the online auction. Sold As-is. Explore more details and submit your bid through Federa Home App.
Key facts
- 6,098 sq ft lot
- Built 1963
- Listed 3 days
Property features AI
Finance
- Other: Property size recorded as 6020 (unit not listed); Lot size approximately 0.14 acres
Exterior
- Parking: Driveway; On-street parking
- Utilities: Water: Other; Sewer: Other
- Home design: Single-family residence; One level; Residential property (RS-3 zoning)
- Construction: Construction details: see remarks
- Exterior features: Front porch; Other roof
Interior
- Bedrooms: 1 total room
- Flooring: Other
- Bathrooms: 2 full bathrooms
- Heating & cooling: No central heating; No central cooling
- Interior features: Other flooring
Neighborhood map
What this means for you Summary
Snapshot
- This is a 3-bed/2.0-bath single-family listed at $5k.
Deal economics
- At list price, monthly cash flow is $-698 ($-8k/yr) — negative.
- The deal already cash-flows at list — no discount required.
- Meets the 1% rule at list price ($3k rent vs $5k).
- Cap rate 4.3% vs local median 3.1% in Pompano Beach — top-decile yield for the area; either an underpriced asset or a hidden risk that comps aren't pricing in. Stress-test before assuming the spread holds.
Location & tenants
- Location reads 74/100 on livability (#284 in FL, #4,541 nationally) — a middle-class / working-renter tenant base. Strengths: commute A+, housing A+, cost of living B+; Watch: schools D+, employment D+, amenities F.
- Broward (suburban): math 42% / reading 53% proficiency, ranked #46 of 73 in FL (top 63%) — families likely to look elsewhere, expect single-tenant / working-renter base with shorter leases.
- Market conditions: Rents rising (+1.8%/yr); 591 active listings in the ZIP; 40 comparable units currently listed for rent nearby; rentals at typical pace (median 25d on market — plan ~3-4 weeks tenant-placement turnaround); 2,111 units permitted in Broward County in 2024 (1,265 in 5+ unit buildings).
- At $2,878/mo this rent would consume 48% of the median local household income ($71k/yr) (locally 2907% of renters already pay >50% of income on rent) — very limited rent-growth headroom before tenants either downsize or default.
Forward outlook
- Local home prices are declining (-3.0%/yr); year-one equity from $3k of loan paydown is wiped out by about $13k of value loss. Plan a longer hold.
- Broward County population projected at +34% by 2050 — long-run rental-demand tailwind backs the buy-and-hold thesis.
Negotiation context
- Only 3 days on market — expect competitive offers; lowballing is unlikely to land.
Risks & watch-outs
- Watch-outs: property tax is 129.0% of price.
- Climate carrying-cost: severe wind risk, 99% chance of damaging wind over 30y; extreme-heat days projected 7→26/yr by 2055 (HVAC capex compounding) — expect insurance premiums to compound above CPI over the hold.
Questions for the listing agent
- What do current leases actually rent for vs. the listed asking? Can we see a recent rent roll and the last 12 months of T-12 income?
- Built in 1963 — when were the roof, HVAC, electrical panel, plumbing, and water heater last replaced?
- Property tax is high relative to price — has the assessment been appealed recently, and will the sale trigger a re-assessment?
- Is there a deadline driving the sale (1031 exchange, divorce, estate, relocation)? That informs how much negotiation room exists.
- Schools are D-rated, which usually means shorter tenancies and higher turnover. Who's the typical renter profile here, and what's been the actual vacancy rate?
- The area grade is low — what's the realistic commute time and amenity access for the typical tenant pool here? Any planned neighborhood developments (good or bad) we should know about?
- What's the average days-on-market for RENTAL listings here right now (not sales)? A rising rental-DOM trend means longer vacancies and softer asking-rent achievability than the comps imply.
- What's the recent tenant-quality profile in this submarket — average credit score on applications, eviction rate, late-payment / NSF rate, and stable-employment percentage? A property-management company in the area should have these aggregated.
- How much new for-sale + rental construction is in the pipeline within 1–3 miles? Heavy new supply typically softens prices + rents 12–24 months out; constrained supply supports both.
Investment metrics
- 1% rule
- 0.67% ✗
- Cap rate
- 4.34%
- Cash-on-cash
- -6.96%
- DSCR
- 0.69
- GRM
- 12.5
CMA / ARV
- ARV (on-the-fly)
- $429,989
- Comps found
- 7
Show comp detail 7 sales within ~0.75 mi
| Address | Dist | Beds/Ba | Sqft | Sold | Price | $/sf | Match |
|---|---|---|---|---|---|---|---|
| 1411 NE 35th St | 0.35mi | 2/2.0 (-1) | 1,254 (+8%) | 17mo | $472,000 | $376 | 51 |
| 3141 NE 10th Ter | 0.07mi | 2/1.0 (-1) | 1,035 (-11%) | 23mo | $420,000 | $406 | 51 |
| 2511 NE 11th Ave | 0.60mi | 3/2.0 | 1,117 (-4%) | 21mo | $359,000 | $321 | 49 |
| 1672 NE 30th St | 0.52mi | 2/1.0 (-1) | 1,069 (-8%) | 8mo | $299,000 | $280 | 47 |
| 1101 NE 23rd Pl | 0.72mi | 3/2.0 | 1,117 (-4%) | 21mo | $345,000 | $309 | 43 |
| 4020 NE 12th Ter | 0.63mi | 3/2.0 | 1,018 (-12%) | 22mo | $430,000 | $422 | 32 |
| 541 NE 39th St | 0.74mi | 3/1.0 | 1,065 (-8%) | 23mo | $395,000 | $371 | 29 |
Match score weights: distance 35% · size 25% · config 20% · recency 20%. Top-matched comps best support the ARV.
Projected returns pro-forma
-3.0% appreciation · 1.75% rent growth · sell at horizon
- IRR
- -29.8%
- Equity multiple
- 0.02×
- Total profit
- $-117,679
- Equity at exit
- $64,113
- IRR
- -37.1%
- Equity multiple
- -0.44×
- Total profit
- $-173,865
- Equity at exit
- $37,178
Cash invested: $120,397 (down + closing). Projections, not guarantees.
Landlord ↔ Tenant lean methodology
- Overall (STATE)
- 87 Strongly Landlord-Friendly
- State Florida
- 87 Strongly Landlord-Friendly · R+3
- County
- — inherits STATE
- City
- — inherits STATE
ZIP-level market 33064
- Home prices YoY
- -18.7%
- Rents YoY
- 1.8%
- Active inventory
- 591
- Price-to-rent
- 0.1×
Monthly cashflow live
- Estimated rent
- $2,878 high interval (Pro) →
- Mortgage (P&I)
- −$2,255
- Tax est. 1.5%
- −$537 /mo · $6,450/yr
- Insurance
- −$179
- HOA
- −$0
- Vacancy / Maint / Mgmt
- −$604
- Net cashflow
- $-698
Break-even live
UW: 25.0% down · 7.5% · 30yr · 1.5% tax · 5.0% vac · 8.0% maint · 8.0% mgmt
Financing live
Cash to close
- Down payment
- $107,497
- Closing costs
- $12,900
- Reserves months
- —
- Total cash needed
- —
Loan-product check · same deal, 3 products live
Conventional
25% down · 7.5% · 30yr
- Down + closing
- —
- Monthly P&I
- —
- Monthly cashflow
- —
- DSCR
- —
- Eligible?
- —
Personal DTI + credit; lowest rate.
DSCR
20% down · 8.5% · 30yr
- Down + closing
- —
- Monthly P&I
- —
- Monthly cashflow
- —
- DSCR
- —
- Eligible?
- —
No personal income docs; deal must DSCR.
Hard money
10% down · 12.0% · 12mo
- Down + closing
- —
- Monthly P&I
- —
- Monthly cashflow
- —
- DSCR
- —
- Eligible?
- —
Short-term bridge; refi at stabilization.
Rent comps 40 comps
| Address | Beds | Baths | Sqft | Rent | $/sqft | DOM | Units | Dist |
|---|---|---|---|---|---|---|---|---|
| 3180 NE 10th Ter Pompano Beach, FL | 2.0 | 1.0 | 991 | $2,700 | $2.72 | 24d | 1 | 0.05mi |
| 3050 NE 9th Ter Pompano Beach, FL | 3.0 | 2.0 | 1400 | $2,850 | $2.04 | 5d | 1 | 0.17mi |
| 2933 NE 12th Ter Pompano Beach, FL | 2.0 | 1.0 | 824 | $2,700 | $3.28 | 24d | 1 | 0.27mi |
| 1473 NE 30th Ct Pompano Beach, FL | 3.0 | 2.0 | 1147 | $3,500 | $3.05 | 3d | 1 | 0.33mi |
| 1510 NE 32nd Pl Pompano Beach, FL | 2.0 | 1.0 | 893 | $2,650 | $2.97 | 24d | 1 | 0.34mi |
| 2849 NE 13th Ave Pompano Beach, FL | 3.0 | 2.0 | 972 | $3,200 | $3.29 | 5d | 1 | 0.34mi |
| 2849 NE 13th Ave Pompano Beach, FL | 3.0 | 2.0 | 972 | $3,100 | $3.19 | 24d | 1 | 0.34mi |
| 2797 NE 12th Ave Pompano Beach, FL | 2.0 | 1.0 | 817 | $2,740 | $3.35 | 8d | 1 | 0.35mi |
| 1530 NE 33rd St Unit 1530 Pompano Beach, FL | 2.0 | 1.0 | 893 | $2,100 | $2.35 | 24d | 1 | 0.37mi |
| 1573 NE 30th Ct Pompano Beach, FL | 3.0 | 2.0 | 1439 | $3,500 | $2.43 | 24d | 1 | 0.42mi |
| 1648 NE 31st Ct Pompano Beach, FL | 3.0 | 1.0 | 1159 | $2,500 | $2.16 | 15d | 1 | 0.46mi |
| 1587 NE 30th St Unit 1503921P Pompano Beach, FL | 3.0 | 2.0 | 796 | $6,432 | $8.08 | 2d | 1 | 0.46mi |
| 2640 NE 10th Ter Pompano Beach, FL | 3.0 | 2.5 | 1177 | $4,100 | $3.48 | 24d | 1 | 0.47mi |
| 1433 NE 27th St Pompano Beach, FL | 2.0 | 1.0 | 816 | $2,900 | $3.55 | 24d | 1 | 0.49mi |
| 1671 NE 33rd St Unit 3 Pompano Beach, FL | 2.0 | 2.0 | 750 | $2,200 | $2.93 | 24d | 1 | 0.50mi |
| 2621 NE 8th Ave Pompano Beach, FL | 3.0 | 2.0 | 1200 | $2,650 | $2.21 | 5d | 1 | 0.57mi |
| 3421 NE 5th Ave Unit A Pompano Beach, FL | 2.0 | 1.0 | 970 | $2,500 | $2.58 | 24d | 1 | 0.58mi |
| 2550 NE 7th Ter Pompano Beach, FL | 2.0 | 1.0 | 893 | $2,500 | $2.80 | 22d | 1 | 0.62mi |
| 2433 NE 13th Ter Pompano Beach, FL | 3.0 | 2.0 | 824 | $3,800 | $4.61 | 24d | 1 | 0.68mi |
| 2417 NE 13th Ter Pompano Beach, FL | 3.0 | 2.0 | 1000 | $4,200 | $4.20 | 2d | 1 | 0.70mi |
| 1900 NE 29th St Unit 2c Lighthouse Point, FL | 2.0 | 2.0 | 1220 | $2,250 | $1.84 | 24d | 1 | 0.70mi |
| 1101 NE 23rd Pl Unit 1 Pompano Beach, FL | 3.0 | 2.0 | 1117 | $3,000 | $2.69 | 24d | 1 | 0.72mi |
| 1921 NE 28th Ct Lighthouse Point, FL | 3.0 | 2.0 | 1258 | $3,995 | $3.18 | 24d | 1 | 0.72mi |
| 3951 NE 17th Ave #703 Pompano Beach, FL | 2.0 | 2.0 | 1250 | $2,500 | $2.00 | 8d | 1 | 0.77mi |
| 1911 NE 27th Ct Unit 3 Lighthouse Point, FL | 2.0 | 1.0 | 900 | $2,000 | $2.22 | 24d | 1 | 0.77mi |
| 1330 NE 41st Dr Unit 1 Pompano Beach, FL | 2.0 | 2.0 | 1280 | $3,300 | $2.58 | 5d | 1 | 0.80mi |
| 1911 NE 27th St Lighthouse Point, FL | 3.0 | 2.0 | 1459 | $3,750 | $2.57 | 24d | 1 | 0.82mi |
| 4211 NE 13th Ave Unit 1332459P Pompano Beach, FL | 3.0 | 2.0 | 1291 | $10,288 | $7.97 | 22d | 1 | 0.85mi |
| 4010 NE 18th Ave Unit 4010 Pompano Beach, FL | 3.0 | 2.0 | 1180 | $2,790 | $2.36 | 2d | 1 | 0.88mi |
| 4010 NE 18th Ave Unit 4010 Pompano Beach, FL | 3.0 | 2.0 | 1180 | $2,850 | $2.42 | 24d | 1 | 0.88mi |
| 229 NE 26th Ct Pompano Beach, FL | 3.0 | 2.0 | 1145 | $3,000 | $2.62 | 22d | 1 | 0.88mi |
| 1821 NE 40th Ct #305 Pompano Beach, FL | 2.0 | 2.0 | 1250 | $2,600 | $2.08 | 18d | 1 | 0.88mi |
| 4270 NE 12th Ter Pompano Beach, FL | 2.0 | 1.0 | 1173 | $2,200 | $1.88 | 24d | 1 | 0.93mi |
| 110 NE 30th St Pompano Beach, FL | 3.0 | 2.0 | 1418 | $4,400 | $3.10 | 24d | 1 | 0.93mi |
| 3281 E Golf Blvd #4 Pompano Beach, FL | 2.0 | 1.5 | 1020 | $2,200 | $2.16 | 24d | 1 | 0.97mi |
| 1400 NE 43rd Ct Unit 1400 Pompano Beach, FL | 3.0 | 1.0 | 1098 | $2,900 | $2.64 | 24d | 1 | 0.97mi |
| 3050 NW 1st Ave Pompano Beach, FL | 2.0 | 1.0 | 1044 | $1,800 | $1.72 | 24d | 1 | 0.97mi |
| 3281 E Golf Blvd #12 Pompano Beach, FL | 2.0 | 1.0 | 1020 | $2,200 | $2.16 | 24d | 1 | 0.98mi |
| 1410 NE 43rd Ct Pompano Beach, FL | 3.0 | 1.5 | 1244 | $2,476 | $1.99 | 24d | 1 | 0.98mi |
| 3850 NE 21st Way #53 Lighthouse Point, FL | 2.0 | 2.0 | 780 | $1,900 | $2.44 | 24d | 1 | 0.98mi |
Listing history 4 events
-
2026-06-18days on market $5,000 Active 3 DOM
-
2026-06-17days on market $5,000 Active 2 DOM
-
2026-06-15remarks 301-char remark
-
2026-06-15$5,000 Active 1 DOM
ⓘ Source: listings_history table (triggers on properties + properties_extension) + one-shot
backfill from property_details.listing_events for pre-trigger history.
Climate risk First Street
- Flood 1/10 Low FEMA zone X (shaded) · 0% chance over 30 yrs
- Wildfire 1/10 Low
- Heat 10/10 Extreme 7 d/yr ≥106°F today · 26 d/yr by 30 yrs out
- Wind 10/10 Extreme 99% chance of damaging wind over 30 yrs
- Air quality 2/10 Low 1 unhealthy d/yr today · 3 by 30 yrs out
Nearby sold comps map
Loading sold comps map…
Walkable amenities ~0.75 mi
Loading nearby amenities…
Taxation est. · year 1
- Rental income
- $34,531
- − Mortgage interest
- −$24,086
- − Property taxes
- −$6,450
- − Insurance
- −$2,150
- − Repairs & maintenance
- −$2,763
- − Management
- −$2,763
- − Depreciation
- −$12,509
- Taxable loss
- −$16,188
- Est. tax savings @ 24.0%
- +$3,885
- After-tax cash flow
- $-4,494/yr
For passive investors: Depreciation is non-cash, so a rental often shows a tax loss while cash-flowing — sheltering income. Rental losses are passive: they offset passive income freely, and up to $25,000/yr can offset ordinary (W-2) income if you actively participate and your MAGI is under $100k (phasing out to $0 by $150k); unused losses carry forward. On sale, claimed depreciation is recaptured at up to 25%, and gains may owe capital-gains tax (a 1031 exchange can defer both). Figures are a year-1 estimate at your 24.0% rate — not tax advice; consult a CPA.
Schools (NCES district)
- District
- Broward
- NCES district ID
- 1200180
- Math proficiency
- 42% ▼ -18.00%
- Reading proficiency
- 53% ▼ -5.00%
- Median HH income
- $52,139
- Composite
- 40.88/100
- National rank
- #3621
- State rank
- #46 of 73 in FL
Livability — Pompano Beach
- Score
- 74/100
- State rank
- #284
- US rank
- #4541
Category grades
Schools grade is shown separately in the Schools card above.
Census & demographics
- Census place
- Pompano Beach, FL
- County
- Broward County · 1,963,430 people
- City population
- 155,861
- Metro
- Miami-Fort Lauderdale-Pompano Beach, FL
- Population (ZIP)
- 64,563
- Household income
- $71,301
- Rent vs Own
- Severe rent burden
- 2907.0
Population outlook (Broward County) Hauer SSP2
- Today (2025)
- 2,207,033 people
- By 2030
- 2,360,704 · +7.0%
- By 2040
- 2,661,208 · +20.6%
- By 2050
- 2,946,698 · +33.5%
- By 2075
- 3,602,273 · +63.2%
- By 2100
- 3,970,984 · +79.9%
Race, ethnicity, and origin ACS 2023
- Neighborhood character
- Highly diverse neighborhood (Simpson 0.75)
- Race & ethnicity
- White 34% Hispanic / Latino 27% Black 25% Two or more races 24% Asian 2%
- Hispanic origin (detail)
- Mexican 4% Puerto Rican 4% Cuban 4% Dominican 2%
- Common ancestry
- Hispanic 13% Estonian 10% Romanian 1%
- Foreign-born
- 43% · Canada, Jamaica, Dominican Republic
- Languages at home
- 45% English-only · Spanish 23% French/Haitian/Cajun 16% Other Indo-European 13%
Political lean MEDSL · Broward
- 2024 margin
- D (+17.0) · D 58.0% · R 41.0%
- 2008→2024 swing
- -17.8pp toward R · 2008: 34.7pp · 2024: 17.0pp
- All cycles
- 2024: D+17.0 2020: D+29.8 2016: D+35.0 2012: D+34.9 2008: D+34.7
Not yet ingested
- Civics
- —
Market trends
- HPI YoY
- ▼ -109.09%
- Current HPI
- 474.7007
- Rent YoY
- ▲ 1.75%
- Metro
- Miami-Fort Lauderdale-Pompano Beach, FL
- State GDP YoY
- ▲ 3.28%
- F500 in state
- 36
Industry mix (Fortune 500 HQ in FL)
| Industry | F500 HQs | Revenue |
|---|---|---|
| Industrial Technology | 2 | $29B |
|
||
| Insurance | 2 | $17B |
|
||
| Retail | 1 | $60B |
|
||
| Technology Distribution | 1 | $58B |
|
||
| Homebuilding | 1 | $35B |
|
||
| Technology Manufacturing | 1 | $35B |
|
||
Price history
-94.6% since first listed6 events — show timeline
- 2026-06-15 Listed $5,000 HAOR as distributed by MLS GRID
- 2018-10-17 Sold (Public Records) $268,000 Public Records
- 2016-05-23 Sold (Public Records) $225,000 Public Records
- 2014-05-15 Sold (Public Records) $176,500 Public Records
- 2013-11-06 Sold (Public Records) $100,000 Public Records
- 2000-06-20 Sold (Public Records) $93,000 Public Records
Property tax history
+13.3%/yrLatest (2025): $11,204 · +3.6% YoY. Source: county tax records.
Cash-flow waterfall
monthlySold comps — $/sqft
last 12 mo · ≤1 miLoading sold comps…