 🏷️ Likely Rental
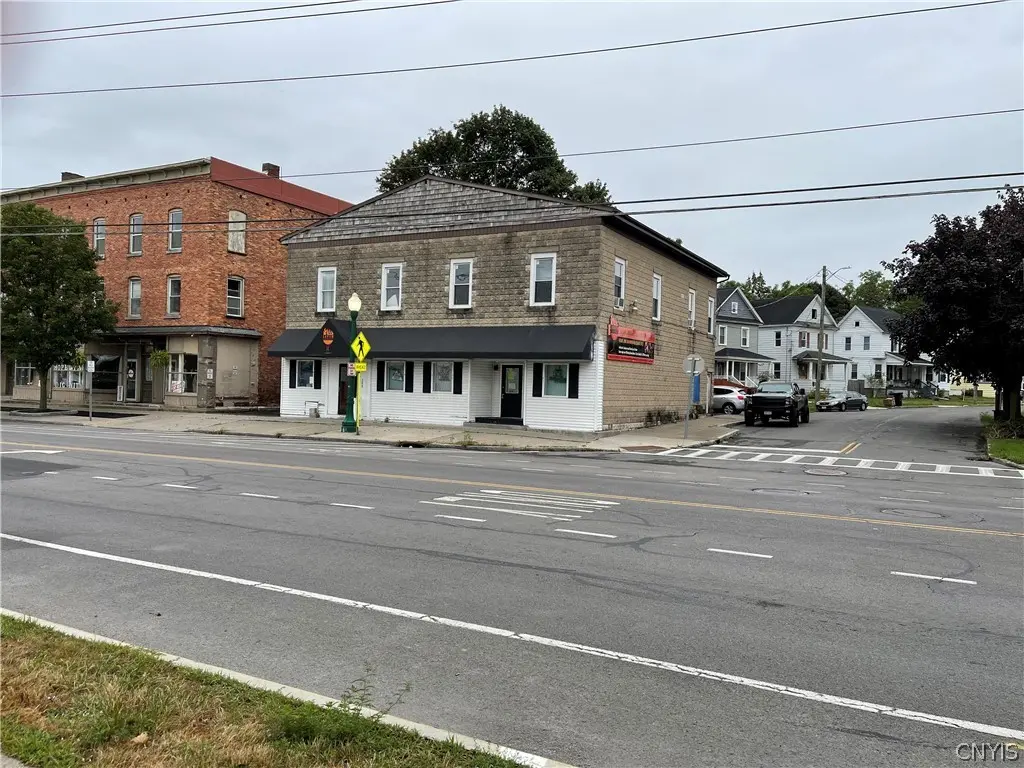
288 Genesee St · Auburn, NY
Flood risk No data
- FEMA flood zone
- —
- Chance of flooding over 30 yrs
- —
- Est. flood insurance / yr
- —
Fire risk No data
- Est. fire insurance / yr
- —
Heat risk No data
- Hot days now (above threshold)
- —
- Hot days in 30 yrs
- —
Wind risk No data
- Chance of severe wind over 30 yrs
- —
Air-quality risk No data
- Unhealthy air days now
- —
- Unhealthy air days in 30 yrs
- —
Risk factors via First Street. Map © Google.
Why this score? — see what drove the B- grade
The composite is a weighted blend of 9 inputs, each scored 0–100. Each bar is that input's sub-score; the figure is the points it added to the 100-point composite (weight × sub-score).
- Cash flow +30.0/30.0
- 1% rule +10.0/10.0
- DSCR +10.0/10.0
- ARV discount +7.5/15.0
- Livability +3.7/5.0
- Schools +3.0/10.0
- Rent growth +2.5/5.0
- Condition / age +2.5/5.0
- Appreciation +0.0/10.0
$239,000
🖨 Deal sheet (PDF) 📄 Offer letter ✓ Due diligence
Multi-family units
County records classify this as Multi-Family (2-4 Unit). Listing-text estimate: 1 unit. estimate disagrees with records
Listing remarks MLS
Prime Investment Opportunity –multi-use commercial building is a money-maker from day one! Current rents: 1st floor Restaurant/Bar $2500 month, Apartment #2 $950 month, Apartment #1 $875 month for a total of $4325 per month. This multi-use 9316 sq. ft. Building has frontage on both Genesee and Van Patten Street, a high-traffic high-visibility corner lot in Auburn, N. Y. close to shopping including Tops, Bass Pro and more. The main level features a fully operational restaurant/bar seating upto 100 patrons with outdoor seating possible. The restaurant equipment and furnishings belong to the restaurant tenant. This offers an ideal spot for you to open your own Restaurant/Bar business or continue with the current existing well-established tenant for steady income. Upstairs, you’ll find two spacious, fully rented 3-bedroom apartments with long term tenants, providing reliable rental revenue. With multiple streams of income under one roof, this property is perfectly positioned to maximize returns. There was a new boiler & hot water heater installed for apartment #1 in 2024, a new range and refrigerator in 2024. In 2025 there was a new boiler & hot water heater installed for apartment #2 as well as well being completly remodeled in Febuary of 2026 with a new range in 2026 and new refrigerator in 2025 a new range in 2026 and refrigerator in 2025. The central air & heat unit was replaced in 2019 in the restaurant/bar. Whether you’re an experienced investor or just getting started, this is the kind of property that builds wealth – commercial exposure, residential stability, and cash flow you can count on! Sale includes building only.
Key facts
- 5,725 sq ft lot
- Parking
- Built 1948
Tags
Neighborhood map
What this means for you Summary
Snapshot
- This is a 6-bed/2.0-bath multifamily listed at $239k.
Deal economics
- At list price, monthly cash flow is $2k ($20k/yr) — positive.
- The deal already cash-flows at list — no discount required.
- Meets the 1% rule at list price ($4k rent vs $239k).
- Recommended offer: $232k (3.0% below list) — sets the bar for market timing.
- Cap rate 14.8% vs local median 7.6% in Auburn — top-decile yield for the area; either an underpriced asset or a hidden risk that comps aren't pricing in. Stress-test before assuming the spread holds.
Location & tenants
- Location reads 74/100 on livability (#298 in NY, #4,814 nationally) — a middle-class / working-renter tenant base. Strengths: cost of living A+, housing A+, health & safety A+; Watch: schools D, amenities D-, commute F.
- Auburn City School District (town): math 31% / reading 39% proficiency, ranked #558 of 590 in NY (top 95%) — families likely to look elsewhere, expect single-tenant / working-renter base with shorter leases.
- Market conditions: 221 active listings in the ZIP; 161 units permitted in Cayuga County in 2024 (65 in 5+ unit buildings).
- At $4,246/mo this rent would consume 84% of the median local household income ($61k/yr) (locally 1449% of renters already pay >50% of income on rent) — very limited rent-growth headroom before tenants either downsize or default.
Forward outlook
- Local home prices are declining (-3.0%/yr); year-one equity from $2k of loan paydown is wiped out by about $7k of value loss. Plan a longer hold.
- Cayuga County population projected at -18% by 2050 — secular population decline; favor cash flow + early exit over multi-decade hold.
- At projected returns (-3.0% appreciation + 3.0% rent growth), your $67k cash investment doubles in ~4 years — after that, you're playing with house money.
Negotiation context
- It's been on market 59 days — a 3% lower offer ($232k) is reasonable based on typical stale-listing flexibility.
- 4 sale attempts since 19y ago; this cycle's ask has dropped $20k (8%) from the opening price — seller is motivated, your offer sets the floor, not the list.
Risks & watch-outs
- Watch-outs: built in 1948 — expect roof / HVAC / electrical / plumbing capex.
Questions for the listing agent
- It's been on market 59 days. Have you received any prior offers? Is the seller open to a 3% concession, seller financing, or rate buy-down credit?
- Built in 1948 — when were the roof, HVAC, electrical panel, plumbing, and water heater last replaced?
- Is there a deadline driving the sale (1031 exchange, divorce, estate, relocation)? That informs how much negotiation room exists.
- Schools are D-rated, which usually means shorter tenancies and higher turnover. Who's the typical renter profile here, and what's been the actual vacancy rate?
- What's the average days-on-market for RENTAL listings here right now (not sales)? A rising rental-DOM trend means longer vacancies and softer asking-rent achievability than the comps imply.
- What's the recent tenant-quality profile in this submarket — average credit score on applications, eviction rate, late-payment / NSF rate, and stable-employment percentage? A property-management company in the area should have these aggregated.
- How much new apartment / multifamily construction is in the pipeline within 1–3 miles? Heavy new supply (>2% of stock underway) typically softens rents 12–24 months out; light construction supports rent growth.
Investment metrics
- 1% rule
- 1.78% ✓
- Cap rate
- 14.84%
- Cash-on-cash
- 30.53%
- DSCR
- 2.36
- GRM
- 4.7
CMA / ARV
- ARV (median comp)
- $670,226
- List price
- $239,000
- Delta
- -64.34%
- Verdict
- UNDERPRICED
- Comps
- 4 within 2.0 mi
Projected returns pro-forma
-3.0% appreciation · 3.0% rent growth · sell at horizon
- IRR
- 25.2%
- Equity multiple
- 2.04×
- Total profit
- $69,779
- Equity at exit
- $35,636
- IRR
- 33.0%
- Equity multiple
- 4.00×
- Total profit
- $200,661
- Equity at exit
- $20,664
Cash invested: $66,920 (down + closing). Projections, not guarantees.
Landlord ↔ Tenant lean methodology
- Overall (STATE)
- 15 Strongly Tenant-Friendly
- State New York
- 15 Strongly Tenant-Friendly · D+10
- County
- — inherits STATE
- City
- — inherits STATE
ZIP-level market 13021
- Home prices YoY
- -22.4%
- Active inventory
- 221
- Price-to-rent
- 14.1×
Monthly cashflow live
- Estimated rent
- $4,246 medium interval (Pro) →
- Mortgage (P&I)
- −$1,253
- Tax est. 1.5%
- −$299 /mo · $3,585/yr
- Insurance
- −$100
- HOA
- −$0
- Vacancy / Maint / Mgmt
- −$892
- Net cashflow
- $1,703
Break-even live
Sensitivity live
| Price | -10% $1,868 | -5% $1,785 | +0% $1,703 | +5% $1,620 | +10% $1,537 |
|---|---|---|---|---|---|
| Rent | -10% $1,367 | -5% $1,535 | +0% $1,703 | +5% $1,870 | +10% $2,038 |
| Rate | -1.0pp $1,823 | -0.5pp $1,763 | base $1,703 | +0.5pp $1,641 | +1.0pp $1,578 |
3-unit breakdown (identical units grouped — click to expand)
| Units | Beds | Baths | Est. rent |
|---|---|---|---|
| 3× units | 1 | 1 | $4,245 |
| #1 | 1 | 1 | $1,415 |
| #2 | 1 | 1 | $1,415 |
| #3 | 1 | 1 | $1,415 |
| Total (3 units) | $4,246 | ||
UW: 25.0% down · 7.5% · 30yr · 1.5% tax · 5.0% vac · 8.0% maint · 8.0% mgmt
Financing live
Cash to close
- Down payment
- $59,750
- Closing costs
- $7,170
- Reserves months
- —
- Total cash needed
- —
Loan-product check · same deal, 3 products live
Conventional
25% down · 7.5% · 30yr
- Down + closing
- —
- Monthly P&I
- —
- Monthly cashflow
- —
- DSCR
- —
- Eligible?
- —
Personal DTI + credit; lowest rate.
DSCR
20% down · 8.5% · 30yr
- Down + closing
- —
- Monthly P&I
- —
- Monthly cashflow
- —
- DSCR
- —
- Eligible?
- —
No personal income docs; deal must DSCR.
Hard money
10% down · 12.0% · 12mo
- Down + closing
- —
- Monthly P&I
- —
- Monthly cashflow
- —
- DSCR
- —
- Eligible?
- —
Short-term bridge; refi at stabilization.
Listing history 25 events
-
2026-06-19days on market $239,000 Active 59 DOM
-
2026-06-18days on market $239,000 Active 58 DOM
-
2026-06-17days on market $239,000 Active 57 DOM
-
2026-06-16days on market $239,000 Active 56 DOM
-
2026-06-15days on market $239,000 Active 55 DOM
-
2026-06-14days on market $239,000 Active 53 DOM
-
2026-06-12days on market $239,000 Active 52 DOM
-
2026-06-09days on market $239,000 Active 49 DOM
-
2026-06-08days on market $239,000 Active 48 DOM
-
2026-06-07days on market $239,000 Active 47 DOM
-
2026-06-05days on market $239,000 Active 44 DOM
-
2026-06-03days on market $239,000 Active 43 DOM
-
2026-06-02days on market $239,000 Active 42 DOM
-
2026-06-01days on market $239,000 Active 41 DOM
-
2026-05-31days on market $239,000 Active 40 DOM
-
2026-05-30days on market $239,000 Active 39 DOM
-
2026-04-30price $239,000 1693-char remark
Show marketing remark (1693 chars)
Prime Investment Opportunity –multi-use commercial building is a money-maker from day one! Current rents: 1st floor Restaurant/Bar $2500 month, Apartment #2 $950 month, Apartment #1 $875 month for a total of $4325 per month. This multi-use 9316 sq. ft. Building has frontage on both Genesee and Van Patten Street, a high-traffic high-visibility corner lot in Auburn, N. Y. close to shopping including Tops, Bass Pro and more. The main level features a fully operational restaurant/bar seating upto 100 patrons with outdoor seating possible. The restaurant equipment and furnishings belong to the restaurant tenant. This offers an ideal spot for you to open your own Restaurant/Bar business or continue with the current existing well-established tenant for steady income. Upstairs, you’ll find two spacious, fully rented 3-bedroom apartments with long term tenants, providing reliable rental revenue. With multiple streams of income under one roof, this property is perfectly positioned to maximize returns. There was a new boiler & hot water heater installed for apartment #1 in 2024, a new range and refrigerator in 2024. In 2025 there was a new boiler & hot water heater installed for apartment #2 as well as well being completly remodeled in Febuary of 2026 with a new range in 2026 and new refrigerator in 2025 a new range in 2026 and refrigerator in 2025. The central air & heat unit was replaced in 2019 in the restaurant/bar. Whether you’re an experienced investor or just getting started, this is the kind of property that builds wealth – commercial exposure, residential stability, and cash flow you can count on! Sale includes building only.
-
2026-04-21$259,000 Active 1693-char remark
Show marketing remark (1693 chars)
Prime Investment Opportunity –multi-use commercial building is a money-maker from day one! Current rents: 1st floor Restaurant/Bar $2500 month, Apartment #2 $950 month, Apartment #1 $875 month for a total of $4325 per month. This multi-use 9316 sq. ft. Building has frontage on both Genesee and Van Patten Street, a high-traffic high-visibility corner lot in Auburn, N. Y. close to shopping including Tops, Bass Pro and more. The main level features a fully operational restaurant/bar seating upto 100 patrons with outdoor seating possible. The restaurant equipment and furnishings belong to the restaurant tenant. This offers an ideal spot for you to open your own Restaurant/Bar business or continue with the current existing well-established tenant for steady income. Upstairs, you’ll find two spacious, fully rented 3-bedroom apartments with long term tenants, providing reliable rental revenue. With multiple streams of income under one roof, this property is perfectly positioned to maximize returns. There was a new boiler & hot water heater installed for apartment #1 in 2024, a new range and refrigerator in 2024. In 2025 there was a new boiler & hot water heater installed for apartment #2 as well as well being completly remodeled in Febuary of 2026 with a new range in 2026 and new refrigerator in 2025 a new range in 2026 and refrigerator in 2025. The central air & heat unit was replaced in 2019 in the restaurant/bar. Whether you’re an experienced investor or just getting started, this is the kind of property that builds wealth – commercial exposure, residential stability, and cash flow you can count on! Sale includes building only.
-
2025-12-15historical
-
2025-09-30price $229,900
-
2025-08-28$249,900 Active
-
2019-09-11historical
-
2019-04-25$225,000 Active
-
2008-01-17soldstatus $330,000
-
2007-03-27$459,900
ⓘ Source: listings_history table (triggers on properties + properties_extension) + one-shot
backfill from property_details.listing_events for pre-trigger history.
Nearby sold comps map
Loading sold comps map…
Walkable amenities ~0.75 mi
Loading nearby amenities…
Taxation est. · year 1
- Rental income
- $50,952
- − Mortgage interest
- −$13,388
- − Property taxes
- −$3,585
- − Insurance
- −$1,195
- − Repairs & maintenance
- −$4,076
- − Management
- −$4,076
- − Depreciation
- −$6,953
- Taxable income
- $17,679
- Est. tax owed @ 24.0%
- −$4,243
- After-tax cash flow
- $16,189/yr
For passive investors: Depreciation is non-cash, so a rental often shows a tax loss while cash-flowing — sheltering income. Rental losses are passive: they offset passive income freely, and up to $25,000/yr can offset ordinary (W-2) income if you actively participate and your MAGI is under $100k (phasing out to $0 by $150k); unused losses carry forward. On sale, claimed depreciation is recaptured at up to 25%, and gains may owe capital-gains tax (a 1031 exchange can defer both). Figures are a year-1 estimate at your 24.0% rate — not tax advice; consult a CPA.
Schools (NCES district)
- District
- Auburn City School District
- NCES district ID
- 3603480
- Math proficiency
- 31% ▼ -17.00%
- Reading proficiency
- 39% ▲ 2.00%
- Median HH income
- $43,567
- Composite
- 29.71/100
- National rank
- #6452
- State rank
- #558 of 590 in NY
Livability — Auburn
- Score
- 74/100
- State rank
- #298
- US rank
- #4814
Category grades
Schools grade is shown separately in the Schools card above.
Census & demographics
- Census place
- Auburn, NY
- County
- Cayuga County · 37,247 people
- City population
- 37,247
- Metro
- Auburn, NY
- Population (ZIP)
- 37,247
- Household income
- $60,712
- Rent vs Own
- Severe rent burden
- 1449.0
Population outlook (Cayuga County) Hauer SSP2
- Today (2025)
- 74,820 people
- By 2030
- 72,402 · -3.2%
- By 2040
- 66,917 · -10.6%
- By 2050
- 61,007 · -18.5%
- By 2075
- 48,047 · -35.8%
- By 2100
- 34,512 · -53.9%
Race, ethnicity, and origin ACS 2023
- Neighborhood character
- Predominantly White (87%)
- Race & ethnicity
- White 87% Two or more races 7% Black 3% Hispanic / Latino 3%
- Common ancestry
- Romanian 8% Subsaharan African 3% Lithuanian 2%
- Foreign-born
- 2% · Canada
- Languages at home
- 95% English-only · Spanish 2% Other Indo-European 1% German/W. Germanic 1%
Political lean MEDSL · Cayuga
- 2024 margin
- R (+13.0) · D 43.5% · R 56.5%
- 2008→2024 swing
- -21.5pp toward R · 2008: 8.5pp · 2024: -13.0pp
- All cycles
- 2024: R+13.0 2020: R+9.2 2016: R+13.2 2012: D+10.8 2008: D+8.5
Not yet ingested
- Civics
- —
Market trends
- HPI YoY
- ▼ -97.53%
- Current HPI
- 338.5537
- Rent YoY
- —
- Metro
- Auburn, NY
- State GDP YoY
- ▲ 2.60%
- F500 in state
- 92
Industry mix (Fortune 500 HQ in NY)
| Industry | F500 HQs | Revenue |
|---|---|---|
| Financial Services | 10 | $950B |
|
||
| Consumer Goods | 9 | $162B |
|
||
| Insurance | 4 | $225B |
|
||
| Telecommunications | 2 | $144B |
|
||
| Pharmaceuticals | 2 | $112B |
|
||
| Media / Entertainment | 2 | $69B |
|
||
Price history
-48.0% since first listed9 events — show timeline
- 2026-04-30 Price Changed $239,000 CNYIS
- 2026-04-21 Listed $259,000 CNYIS
- 2025-12-15 Listing Removed — CNYIS
- 2025-09-30 Price Changed $229,900 CNYIS
- 2025-08-28 Listed $249,900 CNYIS
- 2019-09-11 Listing Removed — CNYIS
- 2019-04-25 Listed $225,000 CNYIS
- 2008-01-17 Sold (MLS) $330,000 CNYIS
- 2007-03-27 Listed $459,900 CNYIS
Cash-flow waterfall
monthlySold comps — $/sqft
last 12 mo · ≤1 miLoading sold comps…