42 Shady Ln · Ben Avon, SC
Flood risk 1/10 · Minimal
- FEMA flood zone
- X (unshaded)
- Chance of flooding over 30 yrs
- 0.0%
- Est. flood insurance / yr
- $507 – $1,088
Fire risk 4/10 · Minor
- Est. fire insurance / yr
- $783 – $1,453
Heat risk 5/10 · Moderate
- Hot days now (above 106°F)
- 7 days/yr
- Hot days in 30 yrs
- 16 days/yr
Wind risk 2/10 · Minimal
- Chance of severe wind over 30 yrs
- 2.0%
Air-quality risk 4/10 · Minor
- Unhealthy air days now
- 4 days/yr
- Unhealthy air days in 30 yrs
- 4 days/yr
Risk factors via First Street. Map © Google.
Why this score? — see what drove the C- grade
The composite is a weighted blend of 9 inputs, each scored 0–100. Each bar is that input's sub-score; the figure is the points it added to the 100-point composite (weight × sub-score).
- Cash flow +21.1/30.0
- DSCR +6.7/10.0
- ARV discount +6.4/15.0
- 1% rule +5.9/10.0
- Rent growth +3.1/5.0
- Schools +3.1/10.0
- Livability +2.5/5.0
- Condition / age +2.5/5.0
- Appreciation +0.0/10.0
$154,900
🖨 Deal sheet (PDF) 📄 Offer letter ✓ Due diligence
Listing remarks
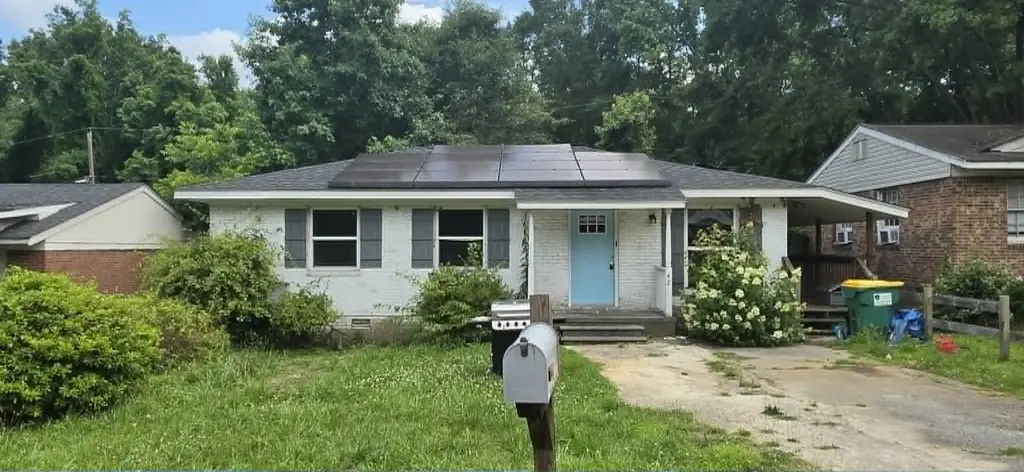
Charming brick ranch offering 3 bedrooms and 1 bathroom with approximately 975 square feet of comfortable living space on a level 0.18-acre lot. This single-level home features hardwood flooring, an updated kitchen and bath, and a practical floor plan that maximizes space and functionality. Recent improvements include a newer roof (2019) and solar panels, providing added value and energy efficiency. The spacious yard offers plenty of room for outdoor enjoyment, gardening, or entertaining. Conveniently located near downtown Spartanburg, Duncan Park, shopping, dining, schools, and major commuter routes. Whether you're a first-time homebuyer, downsizing, or looking for an investment opportunit
Key facts
- Newer roof
- Level lot
- Brick ranch home
Tags
Property features AI
Exterior
- Utilities: Public water
- Home design: Single-family residence; One story
- Construction: Brick veneer construction
- Exterior features: Level lot; Wooded lot
Interior
- Flooring: Hardwood
- Bathrooms: 1 full bathroom
- Interior features: Hardwood flooring; No basement
- Laundry & utility: Laundry on main level
Neighborhood map
What this means for you Summary
Snapshot
- This is a 3-bed/1.0-bath single-family listed at $155k.
Deal economics
- At list price, monthly cash flow is $220 ($3k/yr) — positive.
- The deal already cash-flows at list — no discount required.
- Meets the 1% rule at list price ($2k rent vs $155k).
Location & tenants
- Location reads: area grade C — affects rentability + tenant quality, not the cash-flow math above.
- Spartanburg 07 (urban): math 34% / reading 41% proficiency, ranked #39 of 80 in SC (top 49%) — families likely to look elsewhere, expect single-tenant / working-renter base with shorter leases; 62% free/reduced lunch — lower-income household profile, screen leases tightly.
- Zoned schools: Mccracken Middle (math 41% / reading 49%, grade D, #48 of 229 statewide, top 22%, 926 students, 78% FRL); Spartanburg High (math 67% / reading 79%, grade B+, #44 of 196 statewide, top 23%, 2,056 students, 85% FRL) — zoned schools average 82% FRL vs 62% district-wide (20 pts higher); higher-poverty schools than district average — tighter screening recommended.
- Zoned-school proficiency averages 59% at this address vs 38% district-wide (+22 pts) — the actual schools serving this property are materially stronger than the Spartanburg 07 average implies; a family-tenant draw the district grade alone would hide.
- Market conditions: Rents rising (+2.5%/yr); 156 active listings in the ZIP; 2 comparable units currently listed for rent nearby; solid renter incomes; 3,129 units permitted in Spartanburg County in 2024 (40 in 5+ unit buildings).
Forward outlook
- Local home prices are declining (-3.0%/yr); year-one equity from $1k of loan paydown is wiped out by about $5k of value loss. Plan a longer hold.
- Spartanburg County population projected at +18% by 2050 — long-run rental-demand tailwind backs the buy-and-hold thesis.
Negotiation context
- Only 10 days on market — expect competitive offers; lowballing is unlikely to land.
- 12 sale attempts since 8y ago with the ask held roughly flat each time — persistent listings suggest the price (not the market) is what's stuck; bring a comps-based counter.
- Current owner paid $94k; list at $155k implies a 65% gain — meaningful room to come down on a strong offer.
Risks & watch-outs
- Climate carrying-cost: extreme-heat days projected 7→16/yr by 2055 (HVAC capex compounding) — expect insurance premiums to compound above CPI over the hold.
Questions for the listing agent
- Built in 1969 — when were the roof, HVAC, electrical panel, plumbing, and water heater last replaced?
- Is there a deadline driving the sale (1031 exchange, divorce, estate, relocation)? That informs how much negotiation room exists.
- What's the average days-on-market for RENTAL listings here right now (not sales)? A rising rental-DOM trend means longer vacancies and softer asking-rent achievability than the comps imply.
- What's the recent tenant-quality profile in this submarket — average credit score on applications, eviction rate, late-payment / NSF rate, and stable-employment percentage? A property-management company in the area should have these aggregated.
- How much new for-sale + rental construction is in the pipeline within 1–3 miles? Heavy new supply typically softens prices + rents 12–24 months out; constrained supply supports both.
Investment metrics
- 1% rule
- 1.09% ✓
- Cap rate
- 8.00%
- Cash-on-cash
- 6.08%
- DSCR
- 1.27
- GRM
- 7.6
CMA / ARV
- ARV (on-the-fly)
- $151,125
- Comps found
- 6
Show comp detail 6 sales within ~0.75 mi
| Address | Dist | Beds/Ba | Sqft | Sold | Price | $/sf | Match |
|---|---|---|---|---|---|---|---|
| 51 Shady Ln | 0.02mi | 3/1.0 | 1,000 (+3%) | 6mo | $108,000 | $108 | 90 |
| 3 Lynwood Dr | 0.09mi | 3/1.0 | 840 (-14%) | 3mo | $129,900 | $155 | 71 |
| 31 Lynwood Dr | 0.09mi | 3/1.0 | 918 (-6%) | 24mo | $145,000 | $158 | 66 |
| 1650 Union St St | 0.41mi | 3/1.0 | 1,040 (+7%) | 10mo | $135,000 | $130 | 61 |
| 2417 Andrews Rd | 0.53mi | 3/2.0 | 1,112 (+14%) | 2mo | $231,000 | $208 | 46 |
| 4 Hidden Springs Rd | 0.44mi | 2/1.5 (-1) | 1,056 (+8%) | 20mo | $125,000 | $118 | 42 |
Match score weights: distance 35% · size 25% · config 20% · recency 20%. Top-matched comps best support the ARV.
Projected returns pro-forma
-3.0% appreciation · 2.5% rent growth · sell at horizon
- IRR
- -7.5%
- Equity multiple
- 0.73×
- Total profit
- $-11,892
- Equity at exit
- $23,096
- IRR
- 1.5%
- Equity multiple
- 1.10×
- Total profit
- $4,453
- Equity at exit
- $13,393
Cash invested: $43,372 (down + closing). Projections, not guarantees.
Landlord ↔ Tenant lean methodology
- Overall (STATE)
- 90 Strongly Landlord-Friendly
- State South Carolina
- 90 Strongly Landlord-Friendly · R+6
- County
- — inherits STATE
- City
- — inherits STATE
ZIP-level market 29302
- Home prices YoY
- -25.3%
- Rents YoY
- 2.5%
- Active inventory
- 156
- Price-to-rent
- 7.6×
Monthly cashflow live
- Estimated rent
- $1,689 medium interval (Pro) →
- Mortgage (P&I)
- −$812
- Tax from tax record
- −$238 /mo · $2,851/yr
- Insurance
- −$65
- HOA
- −$0
- Vacancy / Maint / Mgmt
- −$355
- Net cashflow
- $220
Break-even live
Sensitivity live
| Price | -10% $308 | -5% $264 | +0% $220 | +5% $176 | +10% $132 |
|---|---|---|---|---|---|
| Rent | -10% $86 | -5% $153 | +0% $220 | +5% $287 | +10% $353 |
| Rate | -1.0pp $298 | -0.5pp $259 | base $220 | +0.5pp $180 | +1.0pp $139 |
UW: 25.0% down · 7.5% · 30yr · 1.5% tax · 5.0% vac · 8.0% maint · 8.0% mgmt
Financing live
Cash to close
- Down payment
- $38,725
- Closing costs
- $4,647
- Reserves months
- —
- Total cash needed
- —
Loan-product check · same deal, 3 products live
Conventional
25% down · 7.5% · 30yr
- Down + closing
- —
- Monthly P&I
- —
- Monthly cashflow
- —
- DSCR
- —
- Eligible?
- —
Personal DTI + credit; lowest rate.
DSCR
20% down · 8.5% · 30yr
- Down + closing
- —
- Monthly P&I
- —
- Monthly cashflow
- —
- DSCR
- —
- Eligible?
- —
No personal income docs; deal must DSCR.
Hard money
10% down · 12.0% · 12mo
- Down + closing
- —
- Monthly P&I
- —
- Monthly cashflow
- —
- DSCR
- —
- Eligible?
- —
Short-term bridge; refi at stabilization.
Rent comps 2 comps
| Address | Beds | Baths | Sqft | Rent | $/sqft | DOM | Units | Dist |
|---|---|---|---|---|---|---|---|---|
| 113 Inwood Ct Spartanburg, SC | 2.0 | 2.5 | 1068 | $1,350 | $1.26 | 22d | 1 | 0.68mi |
| 1097 Union St Spartanburg, SC | 1.0–2.0 | 1.0–2.0 | 951 | $2,009 | $2.11 | 14d | 21 | 1.31mi |
Listing history 8 events
-
2026-06-21days on market $154,900 Active 10 DOM
-
2026-06-18days on market $154,900 Active 7 DOM
-
2026-06-17days on market $154,900 Active 6 DOM
-
2026-06-16days on market $154,900 Active 5 DOM
-
2026-06-15days on market $154,900 Active 4 DOM
-
2026-06-14days on market $154,900 Active 2 DOM
-
2026-06-13remarks 699-char remark
-
2026-06-13$154,900 Active 1 DOM
ⓘ Source: listings_history table (triggers on properties + properties_extension) + one-shot
backfill from property_details.listing_events for pre-trigger history.
Tax reassessment forecast SC · Resets to sale price
- Current annual tax
- $2,851 · $238/mo
- Projected year-2 tax
- $2,851 · $238/mo
- Expected delta
- $0/yr ($0/mo · 0.0%)
ⓘ Screening estimate from a state-policy table — verify with the county assessor before closing.
Climate risk First Street
- Flood 1/10 Low FEMA zone X (unshaded) · 0% chance over 30 yrs
- Wildfire 4/10 Moderate
- Heat 5/10 Major 7 d/yr ≥106°F today · 16 d/yr by 30 yrs out
- Wind 2/10 Low 2% chance of damaging wind over 30 yrs
- Air quality 4/10 Moderate 4 unhealthy d/yr today · 4 by 30 yrs out
Nearby sold comps map
Loading sold comps map…
Walkable amenities ~0.75 mi
Loading nearby amenities…
Taxation est. · year 1
- Rental income
- $20,267
- − Mortgage interest
- −$8,677
- − Property taxes
- −$2,851
- − Insurance
- −$774
- − Repairs & maintenance
- −$1,621
- − Management
- −$1,621
- − Depreciation
- −$4,506
- Taxable income
- $216
- Est. tax owed @ 24.0%
- −$52
- After-tax cash flow
- $2,586/yr
For passive investors: Depreciation is non-cash, so a rental often shows a tax loss while cash-flowing — sheltering income. Rental losses are passive: they offset passive income freely, and up to $25,000/yr can offset ordinary (W-2) income if you actively participate and your MAGI is under $100k (phasing out to $0 by $150k); unused losses carry forward. On sale, claimed depreciation is recaptured at up to 25%, and gains may owe capital-gains tax (a 1031 exchange can defer both). Figures are a year-1 estimate at your 24.0% rate — not tax advice; consult a CPA.
Schools (NCES district)
- District
- Spartanburg 07
- NCES district ID
- 4503660
- Math proficiency
- 34% ▼ -1.00%
- Reading proficiency
- 41% ▼ -1.00%
- Median HH income
- $35,825
- Composite
- 31.04/100
- National rank
- #6087
- State rank
- #39 of 80 in SC
Livability — Ben Avon
No livability data for this city. (Only ~50 U.S. cities are tracked.)
Census & demographics
- Census place
- Ben Avon, SC
- County
- Spartanburg County · 258,607 people
- Metro
- Spartanburg, SC
- Population (ZIP)
- 19,918
- Household income
- $80,819
- Rent vs Own
- Severe rent burden
- 619.0
Population outlook (Spartanburg County) Hauer SSP2
- Today (2025)
- 325,495 people
- By 2030
- 338,800 · +4.1%
- By 2040
- 363,471 · +11.7%
- By 2050
- 384,156 · +18.0%
- By 2075
- 430,137 · +32.1%
- By 2100
- 442,733 · +36.0%
Race, ethnicity, and origin ACS 2023
- Neighborhood character
- Predominantly White (71%)
- Race & ethnicity
- White 71% Black 16% Two or more races 6% Hispanic / Latino 5% Asian 4%
- Hispanic origin (detail)
- Mexican 2% Puerto Rican 2%
- Common ancestry
- Slovak 5% Serbian 3% Romanian 2%
- Foreign-born
- 4% · Canada
- Languages at home
- 93% English-only · Other Asian/Pacific 3% Spanish 2% German/W. Germanic 1%
Political lean MEDSL · Spartanburg
- 2024 margin
- Solid R (+33.6) · D 32.6% · R 66.2% · Other 1.2%
- 2008→2024 swing
- -12.0pp toward R · 2008: -21.6pp · 2024: -33.6pp
- All cycles
- 2024: R+33.6 2020: R+27.3 2016: R+30.0 2012: R+23.1 2008: R+21.6
Not yet ingested
- Civics
- —
Market trends
- HPI YoY
- ▼ -80.20%
- Current HPI
- 237.1002
- Rent YoY
- ▲ 2.50%
- Metro
- Spartanburg, SC
- State GDP YoY
- ▲ 4.51%
- F500 in state
- 2
Industry mix (Fortune 500 HQ in SC)
| Industry | F500 HQs | Revenue |
|---|---|---|
| Packaging | 1 | $7B |
|
||
Price history
+288.2% since first listed37 events — show timeline
- 2026-06-11 Listed $154,900 SPMLS
- 2022-01-05 Listing Removed — Greater Greenville MLS
- 2021-12-23 Listed $115,000 Greater Greenville MLS
- 2021-03-26 Delisted — SPMLS
- 2021-03-25 Listing Removed — Greater Greenville MLS
- 2021-03-22 Relisted — SPMLS
- 2021-03-15 Relisted — Greater Greenville MLS
- 2021-03-11 Contingent — SPMLS
- 2021-03-11 Contingent — Greater Greenville MLS
- 2021-02-16 Relisted — SPMLS
- 2021-02-15 Relisted — Greater Greenville MLS
- 2021-02-10 Contingent — SPMLS
- 2021-02-10 Contingent — Greater Greenville MLS
- 2021-01-18 Price Changed $98,500 SPMLS
- 2021-01-17 Price Changed $98,500 Greater Greenville MLS
- 2020-12-17 Price Changed $100,900 SPMLS
- 2020-12-17 Price Changed $100,900 Greater Greenville MLS
- 2020-12-02 Listed $109,900 Greater Greenville MLS
- 2020-12-02 Listed $109,900 SPMLS
- 2020-03-02 Sold (Public Records) $94,000 Public Records
- 2020-02-28 Sold (MLS) $94,000 Greater Greenville MLS
- 2020-01-19 Contingent — Greater Greenville MLS
- 2020-01-16 Price Changed $94,500 Greater Greenville MLS
- 2020-01-15 Listing Removed — Greater Greenville MLS
- 2020-01-15 Listed $94,500 Greater Greenville MLS
- 2020-01-10 Price Changed $94,900 Greater Greenville MLS
- 2020-01-02 Price Changed $99,900 Greater Greenville MLS
- 2019-12-31 Listed $109,500 Greater Greenville MLS
- 2019-08-29 Sold (MLS) $21,450 SPMLS
- 2019-08-13 Pending — SPMLS
- 2019-06-29 Price Changed $35,995 SPMLS
- 2019-02-13 Listed $41,000 SPMLS
- 2019-01-03 Delisted — SPMLS
- 2018-07-01 Price Changed $41,000 SPMLS
- 2018-01-09 Price Changed $45,000 SPMLS
- 2018-01-06 Listed $43,000 SPMLS
- 2002-01-01 Sold (Public Records) $39,900 Public Records
Property tax history
+6.9%/yrLatest (2025): $2,851 · +0.7% YoY. Source: county tax records.
Cash-flow waterfall
monthlySold comps — $/sqft
last 12 mo · ≤1 miLoading sold comps…