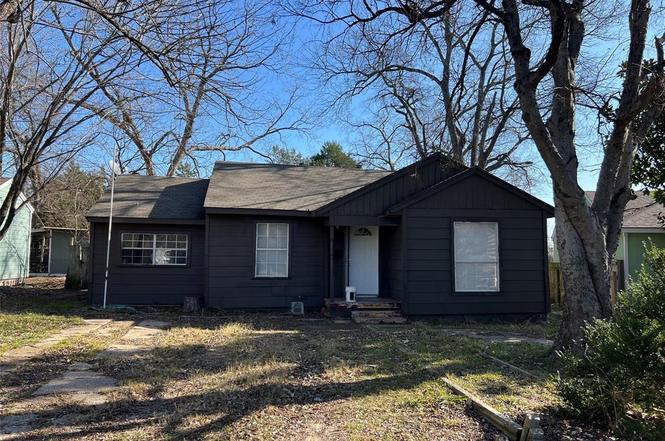
1104 Bell Dr · Greenville, TX
Flood risk 1/10 · Minimal
- FEMA flood zone
- X (unshaded)
- Chance of flooding over 30 yrs
- 0.0%
- Est. flood insurance / yr
- $507 – $1,088
Fire risk 6/10 · Moderate
- Est. fire insurance / yr
- $1,222 – $2,270
Heat risk 7/10 · Major
- Hot days now (above 110°F)
- 7 days/yr
- Hot days in 30 yrs
- 23 days/yr
Wind risk 6/10 · Moderate
- Chance of severe wind over 30 yrs
- 27.0%
Air-quality risk 2/10 · Minimal
- Unhealthy air days now
- 1 days/yr
- Unhealthy air days in 30 yrs
- 1 days/yr
Risk factors via First Street. Map © Google.
Why this score? — see what drove the C- grade
The composite is a weighted blend of 9 inputs, each scored 0–100. Each bar is that input's sub-score; the figure is the points it added to the 100-point composite (weight × sub-score).
- Cash flow +17.7/30.0
- ARV discount +14.1/15.0
- 1% rule +5.6/10.0
- DSCR +5.5/10.0
- Livability +3.9/5.0
- Rent growth +2.7/5.0
- Condition / age +2.5/5.0
- Schools +2.0/10.0
- Appreciation +0.0/10.0
$149,000
🖨 Deal sheet (PDF) 📄 Offer letter ✓ Due diligence
Listing remarks MLS
Selling as is. Was rented and owner has moved wanting to pass this deal on to another investor. Has lots to work with. HVAC, kitchen cabinets newer, garage enclosed for 3td bedroom. Hall bath has good fixtures. Wood floors in BR3,double pane windows. Back has big deck, open pasture behind house. Needs work on subfloor in utility room, ceiling in living room and utility room. Check it out.
Key facts
- 8,407 sq ft lot
- Built 1975
- Listed 7 days
Property features AI
Finance
- Other: Directions: Hwy 34 north of downtown to Hwy 24 towards Commerce; right on Esma, left on Pecan, right on Bell to property on left
- Financial info: Treat as clear loan type; No second mortgage
- HOA & community: No homeowners association
Exterior
- Parking: No garage / no covered parking
- Utilities: City water; City sewer; No municipal utility district
- Home design: Single family residence; Residential property; Built in 1975; Entry level: One
- Construction: Year built 1975
- Exterior features: Lot less than 0.5 acre (about 0.193 acres); Subdivision: Reavilon Add Sec 1, 2, 3
Interior
- Kitchen: Electric oven
- Bedrooms: Primary bedroom on level 1 (10 x 9); Total of 3 bedrooms
- Bathrooms: 1 full bathroom
- Interior features: Walk-in closet(s); One level
Neighborhood map
What this means for you Summary
Snapshot
- This is a 3-bed/2.0-bath single-family listed at $149k.
Deal economics
- At list price, monthly cash flow is $119 ($1k/yr) — positive.
- The deal already cash-flows at list — no discount required.
- Meets the 1% rule at list price ($2k rent vs $149k).
- Cap rate 7.3% vs local median 4.1% in Greenville — top-decile yield for the area; either an underpriced asset or a hidden risk that comps aren't pricing in. Stress-test before assuming the spread holds.
Location & tenants
- Location reads 77/100 on livability (#78 in TX, #2,719 nationally) — a middle-class / working-renter tenant base. Strengths: cost of living A+, housing A+, health & safety A; Watch: employment D, commute F.
- Greenville ISD (town): math 20% / reading 26% proficiency, ranked #743 of 826 in TX (top 90%) — low school quality limits family demand, transient renter base, plan for 1-2y turnover.
- Zoned schools: Crockett El (math 8% / reading 8%, grade F, #4,301 of 4,322 statewide, top 100%, 227 students, 84% FRL); Greenville Middle (math 17% / reading 28%, grade F, #1,341 of 1,662 statewide, top 82%, 727 students, 76% FRL); Greenville H S (math 17% / reading 37%, grade F, #1,204 of 1,632 statewide, top 75%, 1,480 students, 66% FRL) — zoned schools average 75% FRL vs 55% district-wide (20 pts higher); higher-poverty schools than district average — tighter screening recommended.
- Market conditions: Rents flat; 394 active listings in the ZIP; 40 comparable units currently listed for rent nearby; rentals at typical pace (median 27d on market — plan ~3-4 weeks tenant-placement turnaround); 1,289 units permitted in Hunt County in 2024 (527 in 5+ unit buildings).
- This rent runs 32% of the median local income ($60k/yr) — at the standard rent-burdened threshold; future hikes will face affordability resistance.
Forward outlook
- Local home prices are declining (-3.0%/yr); year-one equity from $1k of loan paydown is wiped out by about $4k of value loss. Plan a longer hold.
- Hunt County population projected at +15% by 2050 — modest demand growth; plan on rents tracking national, not racing it.
Negotiation context
- Only 7 days on market — expect competitive offers; lowballing is unlikely to land.
- 4 sale attempts since 13y ago; this cycle's ask has dropped $10k (6%) from the opening price — seller is motivated, your offer sets the floor, not the list.
Risks & watch-outs
- Climate carrying-cost: major wind risk, 27% chance of damaging wind over 30y; major wildfire risk; extreme-heat days projected 7→23/yr by 2055 (HVAC capex compounding) — expect insurance premiums to compound above CPI over the hold.
Questions for the listing agent
- Built in 1975 — when were the roof, HVAC, electrical panel, plumbing, and water heater last replaced?
- Is there a deadline driving the sale (1031 exchange, divorce, estate, relocation)? That informs how much negotiation room exists.
- Schools are D-rated, which usually means shorter tenancies and higher turnover. Who's the typical renter profile here, and what's been the actual vacancy rate?
- What's the average days-on-market for RENTAL listings here right now (not sales)? A rising rental-DOM trend means longer vacancies and softer asking-rent achievability than the comps imply.
- What's the recent tenant-quality profile in this submarket — average credit score on applications, eviction rate, late-payment / NSF rate, and stable-employment percentage? A property-management company in the area should have these aggregated.
- How much new for-sale + rental construction is in the pipeline within 1–3 miles? Heavy new supply typically softens prices + rents 12–24 months out; constrained supply supports both.
Investment metrics
- 1% rule
- 1.06% ✓
- Cap rate
- 7.25%
- Cash-on-cash
- 3.43%
- DSCR
- 1.15
- GRM
- 7.9
CMA / ARV
- ARV (on-the-fly)
- $174,707
- Comps found
- 12
Show comp detail 12 sales within ~0.75 mi
| Address | Dist | Beds/Ba | Sqft | Sold | Price | $/sf | Match |
|---|---|---|---|---|---|---|---|
| 1106 Bell Dr | 0.01mi | 3/2.0 | 1,074 (-7%) | 10mo | $150,000 | $140 | 79 |
| 1008 Pecan Dr | 0.09mi | 3/2.0 | 1,159 (+0%) | 20mo | $145,000 | $125 | 79 |
| 1116 Bell Dr | 0.07mi | 3/2.0 | 1,161 (+0%) | 24mo | $159,000 | $137 | 76 |
| 312 Wilton Dr | 0.28mi | 3/2.0 | 1,090 (-6%) | 5mo | $185,000 | $170 | 74 |
| 566 Loraine Cir | 0.33mi | 3/2.0 | 1,090 (-6%) | 5mo | $164,900 | $151 | 71 |
| 1105 Pecan Dr | 0.11mi | 2/1.5 (-1) | 1,111 (-4%) | 13mo | $142,500 | $128 | 70 |
| 430 Jeanette St | 0.39mi | 3/1.0 | 1,112 (-4%) | 2mo | $159,900 | $144 | 70 |
| 1104 Wolfe City Dr | 0.31mi | 3/1.0 | 1,124 (-3%) | 13mo | $175,000 | $156 | 66 |
| 1304 Skyline Dr | 0.52mi | 3/2.0 | 1,096 (-5%) | 4mo | $160,000 | $146 | 64 |
| 1412 Glendale St | 0.55mi | 3/1.0 | 1,156 (-0%) | 12mo | $199,900 | $173 | 60 |
| 1403 Skyline Dr | 0.61mi | 3/2.0 | 1,252 (+8%) | 1mo | $194,990 | $156 | 57 |
| 1404 Skyline Dr | 0.61mi | 3/2.0 | 1,022 (-12%) | 12mo | $189,000 | $185 | 42 |
Match score weights: distance 35% · size 25% · config 20% · recency 20%. Top-matched comps best support the ARV.
Projected returns pro-forma
-3.0% appreciation · 0.62% rent growth · sell at horizon
- IRR
- -13.8%
- Equity multiple
- 0.52×
- Total profit
- $-20,152
- Equity at exit
- $22,216
- IRR
- -9.6%
- Equity multiple
- 0.48×
- Total profit
- $-21,873
- Equity at exit
- $12,883
Cash invested: $41,720 (down + closing). Projections, not guarantees.
Landlord ↔ Tenant lean methodology
- Overall (STATE)
- 87 Strongly Landlord-Friendly
- State Texas
- 87 Strongly Landlord-Friendly · R+5
- County
- — inherits STATE
- City
- — inherits STATE
ZIP-level market 75401
- Home prices YoY
- -20.7%
- Rents YoY
- 0.6%
- Active inventory
- 394
- Price-to-rent
- 7.9×
Monthly cashflow live
- Estimated rent
- $1,580 high interval (Pro) →
- Mortgage (P&I)
- −$781
- Tax from tax record
- −$285 /mo · $3,426/yr
- Insurance
- −$62
- HOA
- −$0
- Vacancy / Maint / Mgmt
- −$332
- Net cashflow
- $119
Break-even live
Sensitivity live
| Price | -10% $204 | -5% $162 | +0% $119 | +5% $77 | +10% $35 |
|---|---|---|---|---|---|
| Rent | -10% $-5 | -5% $57 | +0% $119 | +5% $182 | +10% $244 |
| Rate | -1.0pp $194 | -0.5pp $157 | base $119 | +0.5pp $81 | +1.0pp $41 |
UW: 25.0% down · 7.5% · 30yr · 1.5% tax · 5.0% vac · 8.0% maint · 8.0% mgmt
Financing live
Cash to close
- Down payment
- $37,250
- Closing costs
- $4,470
- Reserves months
- —
- Total cash needed
- —
Loan-product check · same deal, 3 products live
Conventional
25% down · 7.5% · 30yr
- Down + closing
- —
- Monthly P&I
- —
- Monthly cashflow
- —
- DSCR
- —
- Eligible?
- —
Personal DTI + credit; lowest rate.
DSCR
20% down · 8.5% · 30yr
- Down + closing
- —
- Monthly P&I
- —
- Monthly cashflow
- —
- DSCR
- —
- Eligible?
- —
No personal income docs; deal must DSCR.
Hard money
10% down · 12.0% · 12mo
- Down + closing
- —
- Monthly P&I
- —
- Monthly cashflow
- —
- DSCR
- —
- Eligible?
- —
Short-term bridge; refi at stabilization.
Rent comps 40 comps
| Address | Beds | Baths | Sqft | Rent | $/sqft | DOM | Units | Dist |
|---|---|---|---|---|---|---|---|---|
| 1103 Bell Dr Greenville, TX | 4.0 | 2.0 | 1478 | $2,195 | $1.49 | 46d | 1 | 0.06mi |
| 550 Loraine Cir Greenville, TX | 3.0 | 2.0 | 1352 | $1,200 | $0.89 | 15d | 1 | 0.39mi |
| 500 Loraine Cir Greenville, TX | 2.0 | 1.0 | 816 | $900 | $1.10 | 26d | 1 | 0.43mi |
| 1214 Wolfe City Dr Greenville, TX | 3.0 | 1.0 | 1200 | $1,450 | $1.21 | 6d | 1 | 0.47mi |
| 1901 Bourland St Unit A Greenville, TX | 3.0 | 1.0 | 1100 | $1,399 | $1.27 | 46d | 1 | 0.87mi |
| 2005 Bourland St Unit B Greenville, TX | 3.0 | 2.0 | 1038 | $1,350 | $1.30 | 6d | 1 | 0.89mi |
| 2005 Bourland St Greenville, TX | 3.0 | 2.0 | 1038 | $1,350 | $1.30 | 1d | 1 | 0.89mi |
| 2006 Church St Greenville, TX | 3.0 | 2.0 | 1463 | $1,600 | $1.09 | 46d | 1 | 0.92mi |
| 2212 Church St Unit A Greenville, TX | 3.0 | 2.0 | 1254 | $1,595 | $1.27 | 8d | 1 | 0.96mi |
| 2107 Church St Unit A Greenville, TX | 3.0 | 2.0 | 1069 | $1,400 | $1.31 | 26d | 1 | 0.97mi |
| 2107 Church St Unit B Greenville, TX | 3.0 | 2.0 | 1069 | $1,400 | $1.31 | 46d | 1 | 0.97mi |
| 2305 Bourland St Greenville, TX | 3.0 | 2.0 | 1320 | $1,900 | $1.44 | 46d | 1 | 0.98mi |
| 2018 Henry St Unit A Greenville, TX | 3.0 | 1.0 | 838 | $1,030 | $1.23 | 17d | 1 | 0.99mi |
| 2015 Stuart St Unit A Greenville, TX | 3.0 | 2.0 | 1069 | $1,400 | $1.31 | 26d | 1 | 0.99mi |
| 2113 Henry St Unit B Greenville, TX | 3.0 | 2.0 | 1068 | $1,400 | $1.31 | 26d | 1 | 1.02mi |
| 2113 Henry St Greenville, TX | 3.0 | 2.0 | 1068 | $1,400 | $1.31 | 19d | 1 | 1.02mi |
| 2003 Johnson St Greenville, TX | 2.0 | 1.0 | 1156 | $1,375 | $1.19 | 46d | 1 | 1.02mi |
| 2203 Henry St Unit B Greenville, TX | 3.0 | 2.0 | 980 | $1,250 | $1.28 | 46d | 1 | 1.03mi |
| 2203 Henry St Unit A Greenville, TX | 3.0 | 2.0 | 980 | $1,250 | $1.28 | 12d | 1 | 1.10mi |
| 2203 Henry St Unit A Greenville, TX | 3.0 | 2.0 | 980 | $1,250 | $1.28 | 23d | 1 | 1.10mi |
| 2106 Stonewall St Unit 2B Greenville, TX | 2.0 | 1.0 | 1220 | $1,265 | $1.04 | 22d | 1 | 1.11mi |
| 2106 Stonewall St Unit 2B Greenville, TX | 2.0 | 1.0 | 1200 | $1,263 | $1.05 | 13d | 1 | 1.11mi |
| 902 Clark St Greenville, TX | 3.0 | 2.0 | 1200 | $1,900 | $1.58 | 46d | 1 | 1.13mi |
| 2005 Wesley St Unit 4 Greenville, TX | 2.0 | 1.0 | 1056 | $1,250 | $1.18 | 4d | 1 | 1.13mi |
| 3430 Sockwell Blvd Unit 3462 Greenville, TX | 2.0 | 1.0 | 850 | $960 | $1.13 | 26d | 1 | 1.18mi |
| 3430 Sockwell Blvd Greenville, TX | 1.0–2.0 | 1.0–1.5 | 850 | $1,025 | $1.21 | 1d | 3 | 1.18mi |
| 3333 Dalton St Greenville, TX | 3.0 | 2.0 | 1493 | $1,635 | $1.10 | 26d | 1 | 1.18mi |
| 3333 Dalton St Greenville, TX | 3.0 | 2.0 | 1493 | $1,635 | $1.10 | 7d | 1 | 1.18mi |
| 3333 Dalton St Greenville, TX | 3.0 | 2.0 | 1493 | $1,635 | $1.10 | 9d | 1 | 1.18mi |
| 1707 Wright St Greenville, TX | 3.0 | 2.0 | 1400 | $1,725 | $1.23 | 7d | 1 | 1.18mi |
| 2915 Bourland St Greenville, TX | 3.0 | 2.0 | 1197 | $1,364 | $1.14 | 46d | 1 | 1.21mi |
| 2309 Wesley St Unit A Greenville, TX | 2.0 | 1.0 | 1150 | $1,175 | $1.02 | 46d | 1 | 1.23mi |
| 2309 Wesley St Unit D Greenville, TX | 2.0 | 1.0 | 1150 | $1,100 | $0.96 | 24d | 1 | 1.23mi |
| 1901 Wright St Greenville, TX | 3.0 | 2.0 | 1260 | $1,550 | $1.23 | 1d | 1 | 1.24mi |
| 2116 King St Unit 1 Greenville, TX | 2.0 | 1.0 | 1000 | $1,150 | $1.15 | 6d | 1 | 1.28mi |
| 3113 Bourland St Greenville, TX | 3.0 | 2.0 | 1200 | $1,650 | $1.38 | 1d | 1 | 1.31mi |
| 2113 Wright St Unit A Greenville, TX | 3.0 | 2.5 | 1436 | $1,800 | $1.25 | 46d | 1 | 1.31mi |
| 3020 Henry St Unit A Greenville, TX | 3.0 | 2.0 | 1100 | $2,800 | $2.55 | 46d | 1 | 1.33mi |
| 3020 Henry St Unit B Greenville, TX | 3.0 | 2.0 | 1100 | $2,850 | $2.59 | 46d | 1 | 1.33mi |
| 2901 Lee St Apt 1 Greenville, TX | 2.0 | 2.0 | 1250 | $1,575 | $1.26 | 46d | 1 | 1.36mi |
Listing history 6 events
-
2026-06-22pricedays on market $149,000 Active 7 DOM
-
2026-06-21days on market $159,000 Active 6 DOM
-
2026-06-18days on market $159,000 Active 3 DOM
-
2026-06-17days on market $159,000 Active 2 DOM
-
2026-06-15remarks 224-char remark
-
2026-06-15$159,000 Active 1 DOM
ⓘ Source: listings_history table (triggers on properties + properties_extension) + one-shot
backfill from property_details.listing_events for pre-trigger history.
Tax reassessment forecast TX · Resets to sale price
- Current annual tax
- $3,426 · $285/mo
- Projected year-2 tax
- $3,426 · $285/mo
- Expected delta
- $0/yr ($0/mo · 0.0%)
ⓘ Screening estimate from a state-policy table — verify with the county assessor before closing.
Climate risk First Street
- Flood 1/10 Low FEMA zone X (unshaded) · 0% chance over 30 yrs
- Wildfire 6/10 Major
- Heat 7/10 Severe 7 d/yr ≥110°F today · 23 d/yr by 30 yrs out
- Wind 6/10 Major 27% chance of damaging wind over 30 yrs
- Air quality 2/10 Low 1 unhealthy d/yr today · 1 by 30 yrs out
Nearby sold comps map
Loading sold comps map…
Walkable amenities ~0.75 mi
Loading nearby amenities…
Taxation est. · year 1
- Rental income
- $18,962
- − Mortgage interest
- −$8,346
- − Property taxes
- −$3,426
- − Insurance
- −$745
- − Repairs & maintenance
- −$1,517
- − Management
- −$1,517
- − Depreciation
- −$4,335
- Taxable loss
- −$924
- Est. tax savings @ 24.0%
- +$222
- After-tax cash flow
- $1,654/yr
For passive investors: Depreciation is non-cash, so a rental often shows a tax loss while cash-flowing — sheltering income. Rental losses are passive: they offset passive income freely, and up to $25,000/yr can offset ordinary (W-2) income if you actively participate and your MAGI is under $100k (phasing out to $0 by $150k); unused losses carry forward. On sale, claimed depreciation is recaptured at up to 25%, and gains may owe capital-gains tax (a 1031 exchange can defer both). Figures are a year-1 estimate at your 24.0% rate — not tax advice; consult a CPA.
Schools (NCES district)
- District
- Greenville ISD
- NCES district ID
- 4821720
- Math proficiency
- 20% ▼ -12.00%
- Reading proficiency
- 26% ▼ -7.00%
- Median HH income
- $41,374
- Composite
- 19.56/100
- National rank
- #8759
- State rank
- #743 of 826 in TX
Livability — Greenville
- Score
- 77/100
- State rank
- #78
- US rank
- #2719
Category grades
Schools grade is shown separately in the Schools card above.
Census & demographics
- Census place
- Greenville, TX
- County
- Hunt County · 71,969 people
- City population
- 42,767
- Metro
- Dallas-Fort Worth-Arlington, TX
- Population (ZIP)
- 22,669
- Household income
- $59,908
- Rent vs Own
- Severe rent burden
- 638.0
Population outlook (Hunt County) Hauer SSP2
- Today (2025)
- 97,090 people
- By 2030
- 100,452 · +3.5%
- By 2040
- 106,544 · +9.7%
- By 2050
- 111,218 · +14.6%
- By 2075
- 121,695 · +25.3%
- By 2100
- 123,683 · +27.4%
Race, ethnicity, and origin ACS 2023
- Neighborhood character
- Diverse neighborhood (Simpson 0.62)
- Race & ethnicity
- White 51% Hispanic / Latino 32% Black 13% Two or more races 11%
- Hispanic origin (detail)
- Mexican 30%
- Common ancestry
- Slovak 2% Lithuanian 1% Iranian 1%
- Foreign-born
- 13% · Canada
- Languages at home
- 75% English-only · Spanish 24%
Political lean MEDSL · Hunt
- 2024 margin
- Solid R (+55.5) · D 21.9% · R 77.4%
- 2008→2024 swing
- -14.9pp toward R · 2008: -40.6pp · 2024: -55.5pp
- All cycles
- 2024: R+55.5 2020: R+52.5 2016: R+56.3 2012: R+51.2 2008: R+40.6
Not yet ingested
- Civics
- —
Market trends
- HPI YoY
- ▼ -88.45%
- Current HPI
- 339.0287
- Rent YoY
- ▲ 0.62%
- Metro
- Dallas-Fort Worth-Arlington, TX
- State GDP YoY
- ▲ 3.95%
- F500 in state
- 110
Industry mix (Fortune 500 HQ in TX)
| Industry | F500 HQs | Revenue |
|---|---|---|
| Energy | 16 | $1,198B |
|
||
| Technology | 5 | $198B |
|
||
| Engineering / Construction | 4 | $72B |
|
||
| Energy Services | 3 | $60B |
|
||
| Utilities | 3 | $41B |
|
||
| Healthcare | 2 | $330B |
|
||
Price history
+549.0% since first listed10 events — show timeline
- 2026-06-15 Listed $159,000 NTREIS
- 2026-03-08 Rental Removed $1,100 NTREIS
- 2026-01-14 Listed for Rent $1,100 NTREIS
- 2025-11-05 Listing Removed — NTREIS
- 2025-09-26 Listed $115,000 NTREIS
- 2013-12-12 Sold (Public Records) — Public Records
- 2013-12-12 Sold (MLS) — NTREIS
- 2013-12-07 Pending — NTREIS
- 2013-11-25 Contingent — NTREIS
- 2013-11-12 Listed $24,500 NTREIS
Property tax history
+7.4%/yrLatest (2025): $3,426 · -0.8% YoY. Source: county tax records.
Cash-flow waterfall
monthlySold comps — $/sqft
last 12 mo · ≤1 miLoading sold comps…