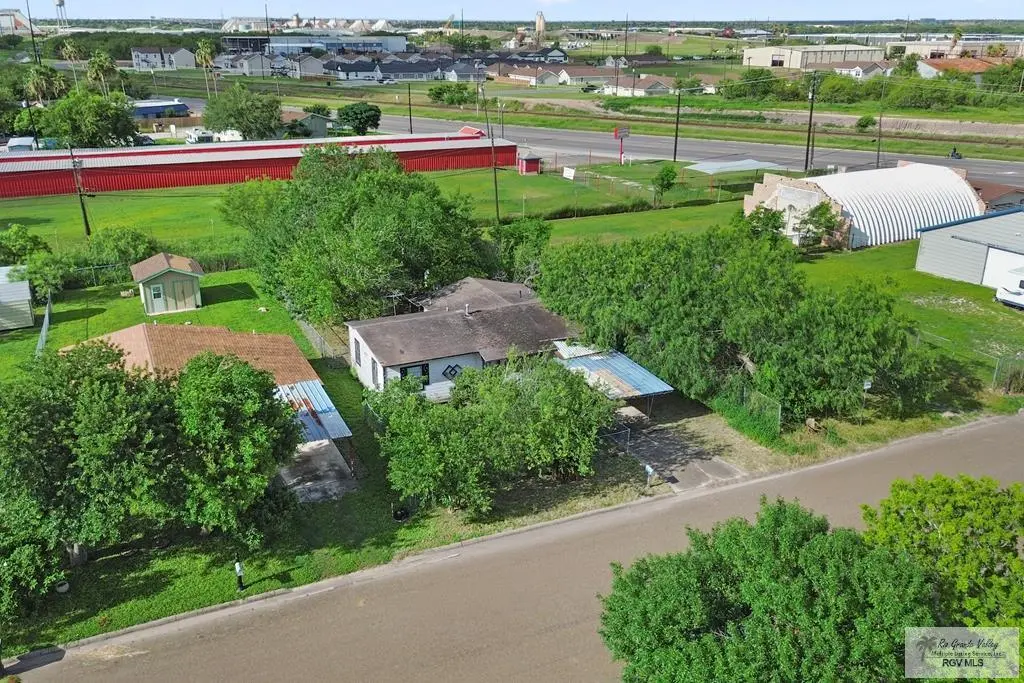
2005 la Paloma Ave · Harlingen, TX
Flood risk 6/10 · Moderate
- FEMA flood zone
- X (unshaded)
- Chance of flooding over 30 yrs
- 0.7%
- Est. flood insurance / yr
- $507 – $1,088
Fire risk 1/10 · Minimal
- Est. fire insurance / yr
- $1,222 – $2,270
Heat risk 9/10 · Severe
- Hot days now (above 110°F)
- 7 days/yr
- Hot days in 30 yrs
- 24 days/yr
Wind risk 8/10 · Major
- Chance of severe wind over 30 yrs
- 99.0%
Air-quality risk 1/10 · Minimal
- Unhealthy air days now
- 0 days/yr
- Unhealthy air days in 30 yrs
- 0 days/yr
Risk factors via First Street. Map © Google.
Why this score? — see what drove the B- grade
The composite is a weighted blend of 9 inputs, each scored 0–100. Each bar is that input's sub-score; the figure is the points it added to the 100-point composite (weight × sub-score).
- Cash flow +30.0/30.0
- 1% rule +10.0/10.0
- DSCR +10.0/10.0
- ARV discount +7.5/15.0
- Livability +3.7/5.0
- Rent growth +3.4/5.0
- Schools +2.5/10.0
- Condition / age +2.5/5.0
- Appreciation +0.0/10.0
$74,950
🖨 Deal sheet 📄 Offer letter ✓ Due diligence
Listing remarks
Investor Alert! Bring your toolbelt and your imagination to this 1,008 sq ft diamond in the rough. Property needs significant repairs and a complete overhaul, but the potential is massive. Clear out, rehab, and reap the rewards. Seller says: Bring all offers! Selling strictly AS-IS.
Key facts
- 7,000 sq ft lot
- Built 1965
- Listed 5 days
Property features AI
Finance
- Other: Located in Avondale Subdivision
Exterior
- Utilities: Public water; Public sewer
- Home design: Single-family residence; 1 story
- Construction: Wood siding construction
- Exterior features: Composition roof
Interior
- Flooring: Laminate
- Bathrooms: 2 full bathrooms
- Heating & cooling: Central heating; Central air conditioning
- Interior features: Electric water heater; Laminate flooring
Neighborhood map
What this means for you Summary
Snapshot
- This is a 3-bed/2.0-bath single-family listed at $75k.
Deal economics
- At list price, monthly cash flow is $441 ($5k/yr) — positive.
- The deal already cash-flows at list — no discount required.
- Meets the 1% rule at list price ($1k rent vs $75k).
- Cap rate 13.4% vs local median 3.8% in Harlingen — top-decile yield for the area; either an underpriced asset or a hidden risk that comps aren't pricing in. Stress-test before assuming the spread holds.
Location & tenants
- Location reads 73/100 on livability (#217 in TX) — a middle-class / working-renter tenant base. Strengths: amenities A+, cost of living A+, housing A+; Watch: crime C-, commute F, employment F.
- Harlingen CISD (urban): math 25% / reading 35% proficiency, ranked #647 of 826 in TX (top 78%) — families likely to look elsewhere, expect single-tenant / working-renter base with shorter leases; 74% free/reduced lunch — lower-income household profile, screen leases tightly.
- Zoned schools: Dishman El (math 22% / reading 22%, grade F, #3,333 of 4,322 statewide, top 80%, 320 students, 95% FRL); Gutierrez Middle (math 26% / reading 31%, grade F, #1,122 of 1,662 statewide, top 69%, 819 students, 71% FRL); Harlingen H S (math 32% / reading 22%, grade F, #1,204 of 1,632 statewide, top 75%, 1,942 students, 82% FRL).
- Market conditions: Rents rising (+3.5%/yr); 465 active listings in the ZIP; 19 comparable units currently listed for rent nearby; rentals lingering (median 44d on market — plan ~5-8 weeks vacancy on turnover, expect pricing pressure); 68% of comp listings sitting > 30 days — soft ceiling on asking rent; 2,326 units permitted in Cameron County in 2024 (503 in 5+ unit buildings).
Forward outlook
- Local home prices are declining (-3.0%/yr); year-one equity from $518 of loan paydown is wiped out by about $2k of value loss. Plan a longer hold.
- Cameron County population projected at +3% by 2050 — modest demand growth; plan on rents tracking national, not racing it.
- At projected returns (-3.0% appreciation + 3.5% rent growth), your $21k cash investment doubles in ~5 years — after that, you're playing with house money.
Negotiation context
- Only 5 days on market — expect competitive offers; lowballing is unlikely to land.
Risks & watch-outs
- Climate carrying-cost: major flood risk; severe wind risk, 99% chance of damaging wind over 30y; extreme-heat days projected 7→24/yr by 2055 (HVAC capex compounding) — expect insurance premiums to compound above CPI over the hold.
Questions for the listing agent
- Built in 1965 — when were the roof, HVAC, electrical panel, plumbing, and water heater last replaced?
- Is there a deadline driving the sale (1031 exchange, divorce, estate, relocation)? That informs how much negotiation room exists.
- Schools are D-rated, which usually means shorter tenancies and higher turnover. Who's the typical renter profile here, and what's been the actual vacancy rate?
- What's the average days-on-market for RENTAL listings here right now (not sales)? A rising rental-DOM trend means longer vacancies and softer asking-rent achievability than the comps imply.
- What's the recent tenant-quality profile in this submarket — average credit score on applications, eviction rate, late-payment / NSF rate, and stable-employment percentage? A property-management company in the area should have these aggregated.
- How much new for-sale + rental construction is in the pipeline within 1–3 miles? Heavy new supply typically softens prices + rents 12–24 months out; constrained supply supports both.
Investment metrics
- 1% rule
- 1.62% ✓
- Cap rate
- 13.35%
- Cash-on-cash
- 25.21%
- DSCR
- 2.12
- GRM
- 5.1
CMA / ARV
- ARV (on-the-fly)
- $154,224
- Comps found
- 2
Show comp detail 2 sales within ~0.75 mi
| Address | Dist | Beds/Ba | Sqft | Sold | Price | $/sf | Match |
|---|---|---|---|---|---|---|---|
| 1713 Farley St | 0.27mi | 3/1.0 | 1,008 (0%) | 9mo | $140,000 | $139 | 76 |
| 1622 W Vinson Ave NW | 0.31mi | 3/2.0 | 1,148 (+14%) | 10mo | $175,900 | $153 | 54 |
Match score weights: distance 35% · size 25% · config 20% · recency 20%. Top-matched comps best support the ARV.
Projected returns pro-forma
-3.0% appreciation · 3.45% rent growth · sell at horizon
- IRR
- 19.3%
- Equity multiple
- 1.79×
- Total profit
- $16,507
- Equity at exit
- $11,175
- IRR
- 27.9%
- Equity multiple
- 3.52×
- Total profit
- $52,893
- Equity at exit
- $6,480
Cash invested: $20,986 (down + closing). Projections, not guarantees.
Landlord ↔ Tenant lean methodology
- Overall (STATE)
- 87 Strongly Landlord-Friendly
- State Texas
- 87 Strongly Landlord-Friendly · R+5
- County
- — inherits STATE
- City
- — inherits STATE
ZIP-level market 78550
- Rents YoY
- 3.5%
- Active inventory
- 465
- Price-to-rent
- 5.1×
Monthly cashflow live
- Estimated rent
- $1,213 high interval (Pro) →
- Mortgage (P&I)
- −$393
- Tax from tax record
- −$93 /mo · $1,118/yr
- Insurance
- −$31
- HOA
- −$0
- Vacancy / Maint / Mgmt
- −$255
- Net cashflow
- $441
Break-even live
UW: 25.0% down · 7.5% · 30yr · 1.5% tax · 5.0% vac · 8.0% maint · 8.0% mgmt
Financing live
Cash to close
- Down payment
- $18,738
- Closing costs
- $2,248
- Reserves months
- —
- Total cash needed
- —
Loan-product check · same deal, 3 products live
Conventional
25% down · 7.5% · 30yr
- Down + closing
- —
- Monthly P&I
- —
- Monthly cashflow
- —
- DSCR
- —
- Eligible?
- —
Personal DTI + credit; lowest rate.
DSCR
20% down · 8.5% · 30yr
- Down + closing
- —
- Monthly P&I
- —
- Monthly cashflow
- —
- DSCR
- —
- Eligible?
- —
No personal income docs; deal must DSCR.
Hard money
10% down · 12.0% · 12mo
- Down + closing
- —
- Monthly P&I
- —
- Monthly cashflow
- —
- DSCR
- —
- Eligible?
- —
Short-term bridge; refi at stabilization.
Rent comps 19 comps
| Address | Beds | Baths | Sqft | Rent | $/sqft | DOM | Units | Dist |
|---|---|---|---|---|---|---|---|---|
| 2104 Multi National Harlingen, TX | 2.0 | 2.0 | 830 | $1,100 | $1.33 | 44d | 1 | 0.16mi |
| 2204 Northridge Ave Unit 23 Harlingen, TX | 2.0 | 2.0 | 955 | $1,250 | $1.31 | 21d | 1 | 0.19mi |
| 2204 Northridge Ave Unit 2 Harlingen, TX | 2.0 | 2.0 | 955 | $1,250 | $1.31 | 44d | 1 | 0.19mi |
| 2205 Multi National Unit A Harlingen, TX | 2.0 | 2.0 | 876 | $1,100 | $1.26 | 44d | 1 | 0.24mi |
| 2211 Northridge Ave Unit C Harlingen, TX | 2.0 | 2.0 | 877 | $1,150 | $1.31 | 44d | 1 | 0.24mi |
| 2005 Southridge Ave Unit A Harlingen, TX | 2.0 | 2.0 | 848 | $1,250 | $1.47 | 44d | 1 | 0.25mi |
| 2209 Multi National Unit D Harlingen, TX | 2.0 | 2.0 | 876 | $1,100 | $1.26 | 44d | 1 | 0.25mi |
| 2218 Multi National Unit B Harlingen, TX | 2.0 | 2.0 | 877 | $1,100 | $1.25 | 14d | 1 | 0.26mi |
| 2219 Northridge Ave Harlingen, TX | 2.0 | 2.0 | 830 | $1,000 | $1.20 | 14d | 1 | 0.27mi |
| 18586 Primera Rd Harlingen, TX | 2.0 | 2.0 | 1100 | $1,095 | $1.00 | 44d | 1 | 0.45mi |
| 821 W Matz Ave Unit B Harlingen, TX | 3.0 | 2.0 | 1190 | $1,300 | $1.09 | 14d | 1 | 0.90mi |
| 2101 N G St Unit B Harlingen, TX | 2.0 | 2.0 | 1004 | $950 | $0.95 | 21d | 1 | 1.00mi |
| 226 W Darrell Wayne Shipp St Harlingen, TX | 3.0 | 2.0 | 1400 | $1,700 | $1.21 | 44d | 1 | 1.23mi |
| 121 W Ebano Ct Harlingen, TX | 2.0 | 2.0 | 1174 | $1,200 | $1.02 | 44d | 1 | 1.23mi |
| 1917 New Combes Hwy Unit H Harlingen, TX | 3.0 | 2.0 | 1098 | $975 | $0.89 | 21d | 1 | 1.29mi |
| 17931 Spruce St Harlingen, TX | 3.0 | 2.0 | 1284 | $1,850 | $1.44 | 44d | 1 | 1.42mi |
| 20558 Alta Vista Ct Unit C Harlingen, TX | 2.0 | 2.0 | 970 | $1,125 | $1.16 | 44d | 1 | 1.44mi |
| 20550 Alta Vista Ct Unit C Harlingen, TX | 2.0 | 2.0 | 970 | $1,125 | $1.16 | 44d | 1 | 1.45mi |
| 1007 El Paso Cir Harlingen, TX | 3.0 | 2.0 | 1201 | $1,600 | $1.33 | 44d | 1 | 1.45mi |
Listing history 6 events
-
2026-06-18days on market $74,950 Active 5 DOM
-
2026-06-17days on market $74,950 Active 4 DOM
-
2026-06-16days on market $74,950 Active 3 DOM
-
2026-06-15days on market $74,950 Active 2 DOM
-
2026-06-14remarks 283-char remark
-
2026-06-14$74,950 Active 1 DOM
ⓘ Source: listings_history table (triggers on properties + properties_extension) + one-shot
backfill from property_details.listing_events for pre-trigger history.
Tax reassessment forecast TX · Resets to sale price
- Current annual tax
- $1,118 · $93/mo
- Projected year-2 tax
- $1,372 · $114/mo
- Expected delta
- +$254/yr (+$21/mo · 22.7%)
ⓘ Screening estimate from a state-policy table — verify with the county assessor before closing.
Climate risk First Street
- Flood 6/10 Major FEMA zone X (unshaded) · 70% chance over 30 yrs
- Wildfire 1/10 Low
- Heat 9/10 Extreme 7 d/yr ≥110°F today · 24 d/yr by 30 yrs out
- Wind 8/10 Severe 99% chance of damaging wind over 30 yrs
- Air quality 1/10 Low 0 unhealthy d/yr today · 0 by 30 yrs out
Nearby sold comps map
Loading sold comps map…
Walkable amenities ~0.75 mi
Loading nearby amenities…
Taxation est. · year 1
- Rental income
- $14,557
- − Mortgage interest
- −$4,198
- − Property taxes
- −$1,118
- − Insurance
- −$375
- − Repairs & maintenance
- −$1,165
- − Management
- −$1,165
- − Depreciation
- −$2,180
- Taxable income
- $4,357
- Est. tax owed @ 24.0%
- −$1,046
- After-tax cash flow
- $4,245/yr
For passive investors: Depreciation is non-cash, so a rental often shows a tax loss while cash-flowing — sheltering income. Rental losses are passive: they offset passive income freely, and up to $25,000/yr can offset ordinary (W-2) income if you actively participate and your MAGI is under $100k (phasing out to $0 by $150k); unused losses carry forward. On sale, claimed depreciation is recaptured at up to 25%, and gains may owe capital-gains tax (a 1031 exchange can defer both). Figures are a year-1 estimate at your 24.0% rate — not tax advice; consult a CPA.
Schools (NCES district)
- District
- Harlingen CISD
- NCES district ID
- 4822530
- Math proficiency
- 25% ▼ -28.00%
- Reading proficiency
- 35% ▼ -11.00%
- Median HH income
- $37,182
- Composite
- 24.94/100
- National rank
- #7566
- State rank
- #647 of 826 in TX
Livability — Harlingen
- Score
- 73/100
- State rank
- #217
- US rank
- #5347
Category grades
Schools grade is shown separately in the Schools card above.
Census & demographics
- Census place
- Harlingen, TX
- County
- Cameron County · 310,734 people
- City population
- 95,667
- Metro
- Brownsville-Harlingen, TX
- Population (ZIP)
- 53,335
- Household income
- $49,007
- Rent vs Own
- Severe rent burden
- 2251.0
Population outlook (Cameron County) Hauer SSP2
- Today (2025)
- 441,603 people
- By 2030
- 448,113 · +1.5%
- By 2040
- 456,385 · +3.3%
- By 2050
- 456,294 · +3.3%
- By 2075
- 423,851 · -4.0%
- By 2100
- 342,787 · -22.4%
Race, ethnicity, and origin ACS 2023
- Neighborhood character
- Predominantly Hispanic (83%)
- Race & ethnicity
- Hispanic / Latino 83% Two or more races 29% White 14% Black 1%
- Hispanic origin (detail)
- Mexican 76%
- Common ancestry
- Italian 1% Lithuanian 1%
- Foreign-born
- 14% · Canada
- Languages at home
- 51% English-only · Spanish 48%
Political lean MEDSL · Cameron
- 2024 margin
- Lean R (+5.8) · D 46.7% · R 52.5%
- 2008→2024 swing
- -34.6pp toward R · 2008: 28.8pp · 2024: -5.8pp
- All cycles
- 2024: R+5.8 2020: D+13.2 2016: D+32.5 2012: D+32.4 2008: D+28.8
Not yet ingested
- Civics
- —
Market trends
- HPI YoY
- ▼ -142.60%
- Current HPI
- 167.7038
- Rent YoY
- ▲ 3.45%
- Metro
- Brownsville-Harlingen, TX
- State GDP YoY
- ▲ 3.95%
- F500 in state
- 110
Industry mix (Fortune 500 HQ in TX)
| Industry | F500 HQs | Revenue |
|---|---|---|
| Energy | 16 | $1,198B |
|
||
| Technology | 5 | $198B |
|
||
| Engineering / Construction | 4 | $72B |
|
||
| Energy Services | 3 | $60B |
|
||
| Utilities | 3 | $41B |
|
||
| Healthcare | 2 | $330B |
|
||
Price history
1 event — show timeline
- 2026-06-13 Listed $74,950 RGVMLS
Property tax history
+5.3%/yrLatest (2025): $1,118 · +10.3% YoY. Source: county tax records.
Cash-flow waterfall
monthlySold comps — $/sqft
last 12 mo · ≤1 miLoading sold comps…