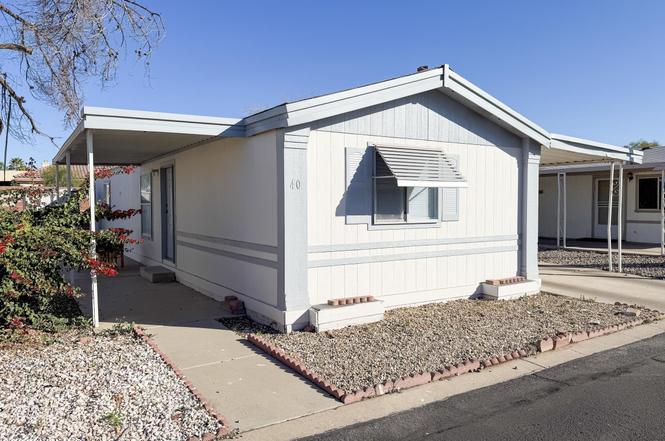
7920 W Glendale Ave #40 · Glendale, AZ
Flood risk 1/10 · Minimal
- FEMA flood zone
- X (shaded)
- Chance of flooding over 30 yrs
- 0.0%
- Est. flood insurance / yr
- $507 – $1,088
Fire risk 1/10 · Minimal
- Est. fire insurance / yr
- $610 – $1,132
Heat risk 9/10 · Severe
- Hot days now (above 112°F)
- 7 days/yr
- Hot days in 30 yrs
- 19 days/yr
Wind risk 1/10 · Minimal
- Chance of severe wind over 30 yrs
- —
Air-quality risk 2/10 · Minimal
- Unhealthy air days now
- 0 days/yr
- Unhealthy air days in 30 yrs
- 1 days/yr
Risk factors via First Street. Map © Google.
Why this score? — see what drove the B grade
The composite is a weighted blend of 9 inputs, each scored 0–100. Each bar is that input's sub-score; the figure is the points it added to the 100-point composite (weight × sub-score).
- Cash flow +30.0/30.0
- ARV discount +10.5/15.0
- 1% rule +10.0/10.0
- DSCR +10.0/10.0
- Livability +3.8/5.0
- Condition / age +2.5/5.0
- Schools +2.3/10.0
- Rent growth +2.2/5.0
- Appreciation +0.0/10.0
$77,000
🖨 Deal sheet 📄 Offer letter ✓ Due diligence
Key facts
- 3 parking spots
- Community pool
- Built 1998
Property features AI
Finance
- Other: Tax information available
- Financial info: Current financing: Other
- HOA & community: Land lease of $855 per month; Association fee includes: other (see remarks); Community pool
Exterior
- Parking: 3 covered parking spaces; 3 carport spaces
- Utilities: City water; Public sewer
- Home design: Manufactured/mobile housing; Leasehold ownership
- Construction: Other construction materials; Rolled/hot mop roof; Building area reported by owner
- Exterior features: Balcony; Exterior storage; Gravel/stone front and back
Interior
- Kitchen: Pantry
- Bedrooms: Up to 3 bedrooms
- Flooring: Laminate flooring
- Bathrooms: 2 full bathrooms
- Heating & cooling: Electric heating; Central air conditioning
- Interior features: Pantry; Full bath in primary bedroom; Interior laundry
- Laundry & utility: Inside laundry
Neighborhood map
What this means for you Summary
Snapshot
- This is a 3-bed/2.0-bath manufactured listed at $77k.
Deal economics
- At list price, monthly cash flow is $786 ($9k/yr) — positive.
- The deal already cash-flows at list — no discount required.
- Meets the 1% rule at list price ($2k rent vs $77k).
- Recommended offer: $68k (12.0% below list) — sets the bar for market timing.
- Cap rate 18.5% vs local median 3.5% in Glendale — top-decile yield for the area; either an underpriced asset or a hidden risk that comps aren't pricing in. Stress-test before assuming the spread holds.
Location & tenants
- Location reads 76/100 on livability (#12 in AZ, #3,235 nationally) — a middle-class / working-renter tenant base. Strengths: commute A+, housing A+, amenities B; Watch: health & safety D+, crime F.
- Glendale Union High School District (4285) (urban): math 23% / reading 31% proficiency, ranked #130 of 249 in AZ (top 52%) — low school quality limits family demand, transient renter base, plan for 1-2y turnover.
- Zoned schools: Glendale High School (math 13% / reading 22%, grade F, #245 of 381 statewide, top 65%, 1,816 students, 76% FRL).
- Market conditions: Rents soft (-1.2%/yr); 116 active listings in the ZIP; 11 comparable units currently listed for rent nearby; rentals leasing fast (median 1d on market — plan ~1-2 weeks tenant-placement turnaround); solid renter incomes; 36,011 units permitted in Maricopa County in 2024 (12,801 in 5+ unit buildings).
Forward outlook
- Local home prices are declining (-3.0%/yr); year-one equity from $532 of loan paydown is wiped out by about $2k of value loss. Plan a longer hold.
- Maricopa County population projected at +38% by 2050 — long-run rental-demand tailwind backs the buy-and-hold thesis.
- At projected returns (-3.0% appreciation + 0.0% rent growth), your $22k cash investment doubles in ~3 years — after that, you're playing with house money.
Negotiation context
- It's been on market 136 days — a 12% lower offer ($68k) is reasonable based on typical stale-listing flexibility.
Risks & watch-outs
- Climate carrying-cost: extreme-heat days projected 7→19/yr by 2055 (HVAC capex compounding) — expect insurance premiums to compound above CPI over the hold.
Questions for the listing agent
- It's been on market 136 days. Have you received any prior offers? Is the seller open to a 12% concession, seller financing, or rate buy-down credit?
- Why hasn't it sold? Are there any deal-killer items the seller is aware of (foundation, flood, title, zoning, code violations)?
- Is there a deadline driving the sale (1031 exchange, divorce, estate, relocation)? That informs how much negotiation room exists.
- Crime grade is F in this area — have there been break-ins, vandalism, or insurance claims at this property in the last 3 years? What carrier currently insures it and at what premium?
- What's the average days-on-market for RENTAL listings here right now (not sales)? A rising rental-DOM trend means longer vacancies and softer asking-rent achievability than the comps imply.
- What's the recent tenant-quality profile in this submarket — average credit score on applications, eviction rate, late-payment / NSF rate, and stable-employment percentage? A property-management company in the area should have these aggregated.
- How much new for-sale + rental construction is in the pipeline within 1–3 miles? Heavy new supply typically softens prices + rents 12–24 months out; constrained supply supports both.
Investment metrics
- 1% rule
- 2.17% ✓
- Cap rate
- 18.55%
- Cash-on-cash
- 43.76%
- DSCR
- 2.95
- GRM
- 3.8
CMA / ARV
- ARV (on-the-fly)
- $82,560
- Comps found
- 4
Show comp detail 4 sales within ~0.75 mi
| Address | Dist | Beds/Ba | Sqft | Sold | Price | $/sf | Match |
|---|---|---|---|---|---|---|---|
| 7041 N 80th Dr | 0.11mi | 3/2.0 | 1,064 (+11%) | 11mo | $265,000 | $249 | 68 |
| 8427 W Glendale Ave #88 | 0.72mi | 3/2.0 | 960 (0%) | 4mo | $83,000 | $86 | 63 |
| 7920 W Glendale Ave #98 | 0.09mi | 2/2.0 (-1) | 896 (-7%) | 22mo | $75,000 | $84 | 61 |
| 8427 W Glendale Ave #184 | 0.65mi | 3/1.0 | 840 (-12%) | 10mo | $65,000 | $77 | 37 |
Match score weights: distance 35% · size 25% · config 20% · recency 20%. Top-matched comps best support the ARV.
Projected returns pro-forma
-3.0% appreciation · 0.0% rent growth · sell at horizon
- IRR
- 37.2%
- Equity multiple
- 2.52×
- Total profit
- $32,735
- Equity at exit
- $11,481
- IRR
- 42.3%
- Equity multiple
- 4.44×
- Total profit
- $74,189
- Equity at exit
- $6,658
Cash invested: $21,560 (down + closing). Projections, not guarantees.
Landlord ↔ Tenant lean methodology
- Overall (STATE)
- 87 Strongly Landlord-Friendly
- State Arizona
- 87 Strongly Landlord-Friendly · R+3
- County
- — inherits STATE
- City
- — inherits STATE
ZIP-level market 85303
- Home prices YoY
- -19.6%
- Rents YoY
- -1.2%
- Active inventory
- 116
- Price-to-rent
- 3.8×
Monthly cashflow live
- Estimated rent
- $1,669 high interval (Pro) →
- Mortgage (P&I)
- −$404
- Tax est. 1.5%
- −$96 /mo · $1,155/yr
- Insurance
- −$32
- HOA
- −$0
- Vacancy / Maint / Mgmt
- −$350
- Net cashflow
- $786
Break-even live
UW: 25.0% down · 7.5% · 30yr · 1.5% tax · 5.0% vac · 8.0% maint · 8.0% mgmt
Financing live
Cash to close
- Down payment
- $19,250
- Closing costs
- $2,310
- Reserves months
- —
- Total cash needed
- —
Loan-product check · same deal, 3 products live
Conventional
25% down · 7.5% · 30yr
- Down + closing
- —
- Monthly P&I
- —
- Monthly cashflow
- —
- DSCR
- —
- Eligible?
- —
Personal DTI + credit; lowest rate.
DSCR
20% down · 8.5% · 30yr
- Down + closing
- —
- Monthly P&I
- —
- Monthly cashflow
- —
- DSCR
- —
- Eligible?
- —
No personal income docs; deal must DSCR.
Hard money
10% down · 12.0% · 12mo
- Down + closing
- —
- Monthly P&I
- —
- Monthly cashflow
- —
- DSCR
- —
- Eligible?
- —
Short-term bridge; refi at stabilization.
Rent comps 11 comps
| Address | Beds | Baths | Sqft | Rent | $/sqft | DOM | Units | Dist |
|---|---|---|---|---|---|---|---|---|
| 8038 W Palmaire Ave Unit a Glendale, AZ | 3.0 | 1.0 | 650 | $1,500 | $2.31 | 1d | 1 | 0.14mi |
| 8102 W Lamar Rd Glendale, AZ | 2.0 | 1.0 | 748 | $1,295 | $1.73 | 1d | 6 | 0.24mi |
| 6755 N 83rd Ave Glendale, AZ | 1.0–2.0 | 1.0–2.0 | 705 | $1,425 | $2.02 | 1d | 8 | 0.40mi |
| 7601 W Glendale Ave Glendale, AZ | 1.0–2.0 | 1.0–2.0 | 955 | $1,791 | $1.87 | 1d | 22 | 0.49mi |
| 7020 N 75th Ave Glendale, AZ | 1.0–2.0 | 1.0 | 680 | $950 | $1.40 | 1d | 3 | 0.56mi |
| 7501 W Glenn Dr Glendale, AZ | 2.0 | 1.0 | 750 | $1,099 | $1.47 | 1d | 1 | 0.59mi |
| 7111 N 75th Ave Glendale, AZ | 2.0 | 1.0–2.0 | 632 | $1,600 | $2.53 | 1d | 6 | 0.72mi |
| 8991 W Glendale Ave Glendale, AZ | 1.0–2.0 | 1.0–2.0 | 922 | $1,742 | $1.89 | 1d | 46 | 1.22mi |
| 7403 N 91st Ave Glendale, AZ | 1.0–3.0 | 1.0–2.0 | 1014 | $2,328 | $2.29 | 1d | 14 | 1.27mi |
| 6857 W Glenn Dr Apt B2 Glendale, AZ | 2.0 | 1.0 | 820 | $1,250 | $1.52 | 19d | 1 | 1.37mi |
| 6851 N 93rd Ave Glendale, AZ | 2.0 | 1.0–2.0 | 903 | $2,396 | $2.65 | 1d | 45 | 1.49mi |
Listing history 16 events
-
2026-06-18days on market $77,000 Active 136 DOM
-
2026-06-17days on market $77,000 Active 135 DOM
-
2026-06-16days on market $77,000 Active 134 DOM
-
2026-06-15days on market $77,000 Active 133 DOM
-
2026-06-13days on market $77,000 Active 131 DOM
-
2026-06-13days on market $77,000 Active 130 DOM
-
2026-06-09days on market $77,000 Active 127 DOM
-
2026-06-08days on market $77,000 Active 126 DOM
-
2026-06-07days on market $77,000 Active 125 DOM
-
2026-06-04days on market $77,000 Active 122 DOM
-
2026-06-03days on market $77,000 Active 121 DOM
-
2026-06-02days on market $77,000 Active 120 DOM
-
2026-06-01days on market $77,000 Active 119 DOM
-
2026-05-31days on market $77,000 Active 118 DOM
-
2026-04-30price $77,000
-
2026-01-30$80,000 Active
ⓘ Source: listings_history table (triggers on properties + properties_extension) + one-shot
backfill from property_details.listing_events for pre-trigger history.
Climate risk First Street
- Flood 1/10 Low FEMA zone X (shaded) · 0% chance over 30 yrs
- Wildfire 1/10 Low
- Heat 9/10 Extreme 7 d/yr ≥112°F today · 19 d/yr by 30 yrs out
- Wind 1/10 Low
- Air quality 2/10 Low 0 unhealthy d/yr today · 1 by 30 yrs out
Nearby sold comps map
Loading sold comps map…
Walkable amenities ~0.75 mi
Loading nearby amenities…
Taxation est. · year 1
- Rental income
- $20,026
- − Mortgage interest
- −$4,313
- − Property taxes
- −$1,155
- − Insurance
- −$385
- − Repairs & maintenance
- −$1,602
- − Management
- −$1,602
- − Depreciation
- −$2,240
- Taxable income
- $8,729
- Est. tax owed @ 24.0%
- −$2,095
- After-tax cash flow
- $7,340/yr
For passive investors: Depreciation is non-cash, so a rental often shows a tax loss while cash-flowing — sheltering income. Rental losses are passive: they offset passive income freely, and up to $25,000/yr can offset ordinary (W-2) income if you actively participate and your MAGI is under $100k (phasing out to $0 by $150k); unused losses carry forward. On sale, claimed depreciation is recaptured at up to 25%, and gains may owe capital-gains tax (a 1031 exchange can defer both). Figures are a year-1 estimate at your 24.0% rate — not tax advice; consult a CPA.
Schools (NCES district)
- District
- Glendale Union High School District (4285)
- NCES district ID
- 0403450
- Math proficiency
- 23% ▼ -38.00%
- Reading proficiency
- 31% ▼ -19.00%
- Median HH income
- $40,846
- Composite
- 22.81/100
- National rank
- #8020
- State rank
- #130 of 249 in AZ
Livability — Glendale
- Score
- 76/100
- State rank
- #12
- US rank
- #3235
Category grades
Schools grade is shown separately in the Schools card above.
Census & demographics
- Census place
- Glendale, AZ
- County
- Maricopa County · 4,537,380 people
- City population
- 294,586
- Metro
- Phoenix-Mesa-Chandler, AZ
- Population (ZIP)
- 33,663
- Household income
- $80,650
- Rent vs Own
- Severe rent burden
- 864.0
Population outlook (Maricopa County) Hauer SSP2
- Today (2025)
- 4,979,203 people
- By 2030
- 5,378,229 · +8.0%
- By 2040
- 6,156,598 · +23.6%
- By 2050
- 6,872,376 · +38.0%
- By 2075
- 8,401,270 · +68.7%
- By 2100
- 9,247,439 · +85.7%
Race, ethnicity, and origin ACS 2023
- Neighborhood character
- Diverse neighborhood (Simpson 0.59)
- Race & ethnicity
- Hispanic / Latino 59% Two or more races 26% White 23% Black 8% Asian 5% Native American 2%
- Hispanic origin (detail)
- Mexican 53%
- Common ancestry
- Italian 2% Lithuanian 1% Slovak 1%
- Foreign-born
- 20% · Canada, Vietnam, China
- Languages at home
- 55% English-only · Spanish 39% Vietnamese 2% Tagalog/Filipino 1%
Political lean MEDSL · Maricopa
- 2024 margin
- Toss-up / Even · D 47.7% · R 51.2% · Other 1.1%
- 2008→2024 swing
- +7.1pp toward D · 2008: -10.6pp · 2024: -3.5pp
- All cycles
- 2024: R+3.5 2020: D+2.2 2016: R+3.5 2012: R+12.0 2008: R+10.6
Not yet ingested
- Civics
- —
Market trends
- HPI YoY
- ▼ -77.33%
- Current HPI
- 318.1348
- Rent YoY
- ▼ -1.19%
- Metro
- Phoenix-Mesa-Chandler, AZ
- State GDP YoY
- ▲ 4.54%
- F500 in state
- 20
Industry mix (Fortune 500 HQ in AZ)
| Industry | F500 HQs | Revenue |
|---|---|---|
| Technology | 2 | $13B |
|
||
| Mining / Metals | 1 | $23B |
|
||
| Environmental Services | 1 | $16B |
|
||
| Metals / Steel | 1 | $14B |
|
||
| Technology Distribution | 1 | $9B |
|
||
| Homebuilding | 1 | $8B |
|
||
Price history
-3.8% since first listed2 events — show timeline
- 2026-04-30 Price Changed $77,000 ARMLS
- 2026-01-30 Listed $80,000 ARMLS
Cash-flow waterfall
monthlySold comps — $/sqft
last 12 mo · ≤1 miLoading sold comps…