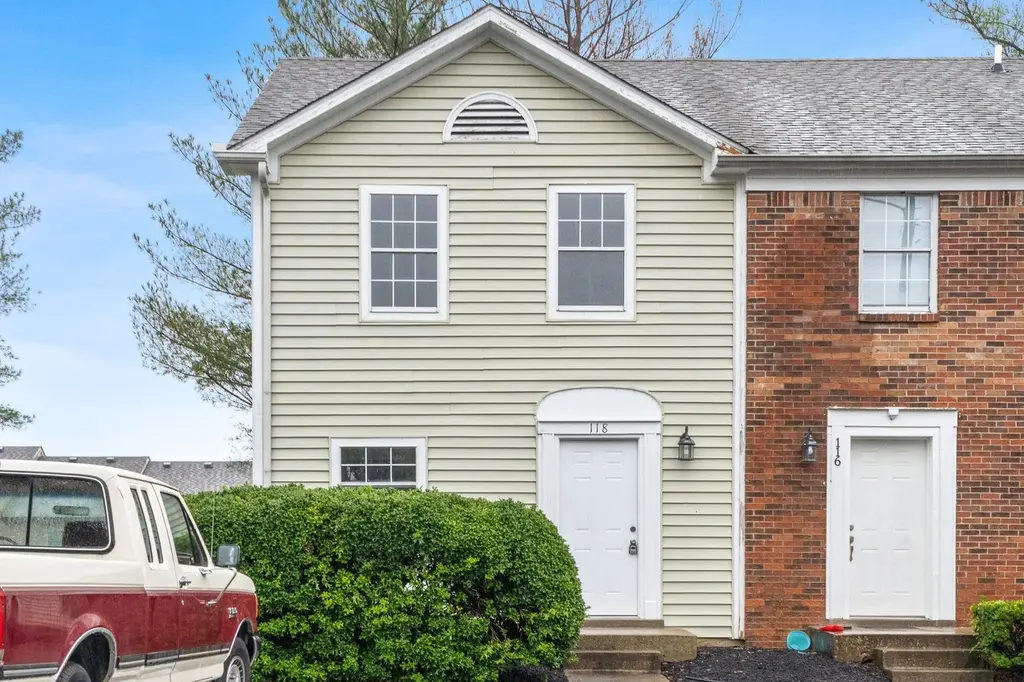
118 Greenland Ct · Clarksville, TN
Flood risk 1/10 · Minimal
- FEMA flood zone
- X (unshaded)
- Chance of flooding over 30 yrs
- 0.0%
- Est. flood insurance / yr
- $507 – $1,088
Fire risk 1/10 · Minimal
- Est. fire insurance / yr
- $949 – $1,763
Heat risk 6/10 · Moderate
- Hot days now (above 107°F)
- 7 days/yr
- Hot days in 30 yrs
- 21 days/yr
Wind risk 4/10 · Minor
- Chance of severe wind over 30 yrs
- 9.0%
Air-quality risk 2/10 · Minimal
- Unhealthy air days now
- 1 days/yr
- Unhealthy air days in 30 yrs
- 1 days/yr
Risk factors via First Street. Map © Google.
Why this score? — see what drove the D grade
The composite is a weighted blend of 9 inputs, each scored 0–100. Each bar is that input's sub-score; the figure is the points it added to the 100-point composite (weight × sub-score).
- Cash flow +13.8/30.0
- ARV discount +7.5/15.0
- DSCR +4.2/10.0
- Livability +4.2/5.0
- 1% rule +3.3/10.0
- Rent growth +2.8/5.0
- Schools +2.5/10.0
- Condition / age +2.5/5.0
- Appreciation +0.0/10.0
$155,000
🖨 Deal sheet 📄 Offer letter ✓ Due diligence
Listing remarks
Welcome home to this updated 2-bedroom, 1-bath townhouse located at 118 Greenland Court, conveniently just minutes from Fort Campbell. This property features recent updates throughout, offering modern comfort and low-maintenance living. Ideal for homeowners seeking a prime location with easy access to local amenities and the base.
Key facts
- 1,742 sq ft lot
- 2 parking spots
- Built 1986
Property features AI
Finance
- Other: Living area about 1,092 square feet (per assessor)
- HOA & community: HOA with annual fee of $191 and a one-time fee of $300
Exterior
- Parking: 2 open parking spaces (parking lot)
- Security: Smoke detectors
- Utilities: Public water; Public sewer; Water available
- Home design: Single-family residence; Residential property; Two levels; Existing construction
- Construction: Vinyl siding
- Exterior features: Patio
Interior
- Kitchen: Electric range; Dishwasher; Microwave; Refrigerator
- Bedrooms: 2 bedrooms (Bedroom 1: 15 x 12; Bedroom 2: 14 x 11)
- Flooring: Carpet; Tile; Vinyl
- Bathrooms: 1 full bath; 1 half bath
- Heating & cooling: Central heating; Central air
- Interior features: Ceiling fans; Wood-burning fireplace (1)
- Laundry & utility: Washer hookup; Electric dryer hookup
Neighborhood map
What this means for you Summary
Snapshot
- This is a 2-bed/2.0-bath condo listed at $155k.
Deal economics
- At list price, monthly cash flow is $13 ($161/yr) — positive.
- The deal already cash-flows at list — no discount required.
- To meet the 1% rule (rent ≥ 1% of price), the offer needs to be $129k (16.7% below list).
- Recommended offer: $129k (16.7% below list) — sets the bar for 1% rule.
- Cap rate 6.4% vs local median 3.5% in Clarksville — top-decile yield for the area; either an underpriced asset or a hidden risk that comps aren't pricing in. Stress-test before assuming the spread holds.
Location & tenants
- Location reads 84/100 on livability (#1 in TN, #798 nationally) — a professional / high-income tenant draw. Strengths: amenities A+, commute A+, cost of living A+; Watch: employment C-, crime D+.
- Montgomery County (urban): math 25% / reading 31% proficiency, ranked #65 of 139 in TN (top 47%) — low school quality limits family demand, transient renter base, plan for 1-2y turnover.
- Zoned schools: Ringgold Elementary (math 19% / reading 23%, grade F, #633 of 952 statewide, top 67%, 801 students, 0% FRL); Kenwood High (math 5% / reading 29%, grade F, #225 of 332 statewide, top 69%, 1,291 students, 0% FRL) — zoned schools average 0% FRL vs 40% district-wide (40 pts lower); this property's tenant base skews higher-income than the district average.
- Market conditions: Rents rising (+1.3%/yr); 893 active listings in the ZIP; 40 comparable units currently listed for rent nearby; rentals at typical pace (median 21d on market — plan ~3-4 weeks tenant-placement turnaround); 2,583 units permitted in Montgomery County in 2024 (617 in 5+ unit buildings).
Forward outlook
- Local home prices are declining (-3.0%/yr); year-one equity from $1k of loan paydown is wiped out by about $5k of value loss. Plan a longer hold.
- Montgomery County population projected at +49% by 2050 — long-run rental-demand tailwind backs the buy-and-hold thesis.
Negotiation context
- It's been on market 69 days — a 6% lower offer ($146k) is reasonable based on typical stale-listing flexibility.
- 3 sale attempts since 7y ago with the ask held roughly flat each time — persistent listings suggest the price (not the market) is what's stuck; bring a comps-based counter.
- Current owner paid $42k; list at $155k implies a 269% gain — meaningful room to come down on a strong offer.
Risks & watch-outs
- Climate carrying-cost: extreme-heat days projected 7→21/yr by 2055 (HVAC capex compounding) — expect insurance premiums to compound above CPI over the hold.
Questions for the listing agent
- It's been on market 69 days. Have you received any prior offers? Is the seller open to a 17% concession, seller financing, or rate buy-down credit?
- What does the HOA fee cover, when was the last increase, and are there any pending special assessments or reserve-fund shortfalls?
- Any open or pending special assessments — roof, HVAC, plumbing, elevator, façade? What's the per-unit balance and payoff schedule, and is the seller paying it off at close or rolling it to the buyer?
- Why hasn't it sold? Are there any deal-killer items the seller is aware of (foundation, flood, title, zoning, code violations)?
- Is there a deadline driving the sale (1031 exchange, divorce, estate, relocation)? That informs how much negotiation room exists.
- Crime grade is D in this area — have there been break-ins, vandalism, or insurance claims at this property in the last 3 years? What carrier currently insures it and at what premium?
- The area grade is low — what's the realistic commute time and amenity access for the typical tenant pool here? Any planned neighborhood developments (good or bad) we should know about?
- What's the average days-on-market for RENTAL listings here right now (not sales)? A rising rental-DOM trend means longer vacancies and softer asking-rent achievability than the comps imply.
- What's the recent tenant-quality profile in this submarket — average credit score on applications, eviction rate, late-payment / NSF rate, and stable-employment percentage? A property-management company in the area should have these aggregated.
- How much new apartment / multifamily construction is in the pipeline within 1–3 miles? Heavy new supply (>2% of stock underway) typically softens rents 12–24 months out; light construction supports rent growth.
Investment metrics
- 1% rule
- 0.83% ✗
- Cap rate
- 6.40%
- Cash-on-cash
- 0.37%
- DSCR
- 1.02
- GRM
- 10.0
CMA / ARV
No comps found within radius.
Projected returns pro-forma
-3.0% appreciation · 1.27% rent growth · sell at horizon
- IRR
- -17.6%
- Equity multiple
- 0.39×
- Total profit
- $-26,493
- Equity at exit
- $23,111
- IRR
- -13.1%
- Equity multiple
- 0.29×
- Total profit
- $-30,812
- Equity at exit
- $13,402
Cash invested: $43,400 (down + closing). Projections, not guarantees.
Landlord ↔ Tenant lean methodology
- Overall (STATE)
- 87 Strongly Landlord-Friendly
- State Tennessee
- 87 Strongly Landlord-Friendly · R+13
- County
- — inherits STATE
- City
- — inherits STATE
ZIP-level market 37042
- Home prices YoY
- -18.2%
- Rents YoY
- 1.3%
- Active inventory
- 893
- Price-to-rent
- 10.0×
Monthly cashflow live
- Estimated rent
- $1,292 high interval (Pro) →
- Mortgage (P&I)
- −$813
- Tax from tax record
- −$114 /mo · $1,363/yr
- Insurance
- −$65
- HOA
- −$16
- Vacancy / Maint / Mgmt
- −$271
- Net cashflow
- $13
Break-even live
UW: 25.0% down · 7.5% · 30yr · 1.5% tax · 5.0% vac · 8.0% maint · 8.0% mgmt
Financing live
Cash to close
- Down payment
- $38,750
- Closing costs
- $4,650
- Reserves months
- —
- Total cash needed
- —
Loan-product check · same deal, 3 products live
Conventional
25% down · 7.5% · 30yr
- Down + closing
- —
- Monthly P&I
- —
- Monthly cashflow
- —
- DSCR
- —
- Eligible?
- —
Personal DTI + credit; lowest rate.
DSCR
20% down · 8.5% · 30yr
- Down + closing
- —
- Monthly P&I
- —
- Monthly cashflow
- —
- DSCR
- —
- Eligible?
- —
No personal income docs; deal must DSCR.
Hard money
10% down · 12.0% · 12mo
- Down + closing
- —
- Monthly P&I
- —
- Monthly cashflow
- —
- DSCR
- —
- Eligible?
- —
Short-term bridge; refi at stabilization.
Rent comps 40 comps
| Address | Beds | Baths | Sqft | Rent | $/sqft | DOM | Units | Dist |
|---|---|---|---|---|---|---|---|---|
| 1986 Timberline Way Clarksville, TN | 3.0 | 2.0 | 1254 | $1,511 | $1.20 | 21d | 1 | 0.09mi |
| 102 Eaglewood Ct Clarksville, TN | 3.0 | 2.0 | 1062 | $1,395 | $1.31 | 21d | 1 | 0.23mi |
| 300 Ringgold Rd Clarksville, TN | 2.0 | 1.5 | 1050 | $995 | $0.95 | 21d | 1 | 0.24mi |
| 2113 Ringgold Ct Unit 207 Clarksville, TN | 2.0 | 2.0 | 960 | $875 | $0.91 | 21d | 1 | 0.25mi |
| 2113 Ringgold Ct #306 Clarksville, TN | 3.0 | 2.0 | 1090 | $1,015 | $0.93 | 21d | 1 | 0.26mi |
| 2119 Ringgold Ct Unit 208 Clarksville, TN | 2.0 | 2.0 | 1090 | $875 | $0.80 | 21d | 1 | 0.29mi |
| 144 Waterwheel Cir Clarksville, TN | 3.0 | 2.0 | 1261 | $1,650 | $1.31 | 21d | 1 | 0.34mi |
| 144 Waterwheel Cir Clarksville, TN | 3.0 | 2.0 | 1261 | $1,550 | $1.23 | 13d | 1 | 0.34mi |
| 15 Millswood Dr Unit D-112 Clarksville, TN | 3.0 | 2.0 | 1172 | $1,585 | $1.35 | 21d | 1 | 0.46mi |
| 2011 Windroe Dr Clarksville, TN | 3.0 | 2.0 | 1400 | $1,500 | $1.07 | 21d | 1 | 0.49mi |
| 1260 Parkway Pl Clarksville, TN | 2.0 | 1.5 | 1080 | $1,095 | $1.01 | 21d | 1 | 0.68mi |
| 1671 Fort Campbell Blvd Clarksville, TN | 1.0–2.0 | 1.0–1.5 | 726 | $1,206 | $1.66 | 21d | 18 | 0.70mi |
| 1235 Parkway Pl Clarksville, TN | 2.0 | 1.0 | 920 | $795 | $0.86 | 21d | 1 | 0.74mi |
| 1244 Parkway Pl Unit C Clarksville, TN | 2.0 | 1.5 | 1100 | $1,000 | $0.91 | 21d | 1 | 0.75mi |
| 1237 Parkway Pl Unit C Clarksville, TN | 2.0 | 1.0 | 984 | $850 | $0.86 | 21d | 1 | 0.75mi |
| 1245 Parkway Pl Unit D Clarksville, TN | 2.0 | 1.0 | 984 | $850 | $0.86 | 21d | 1 | 0.79mi |
| 221 Mills Dr Clarksville, TN | 3.0 | 1.5 | 1100 | $1,150 | $1.05 | 13d | 1 | 0.83mi |
| 248 Drayton Dr Clarksville, TN | 2.0–3.0 | 1.5–2.5 | 1060 | $1,205 | $1.14 | 13d | 21 | 1.01mi |
| 325 Mills Dr Clarksville, TN | 3.0 | 2.0 | 1100 | $1,800 | $1.64 | 13d | 1 | 1.07mi |
| 205 Norris Dr Clarksville, TN | 3.0 | 2.0 | 1225 | $2,000 | $1.63 | 21d | 1 | 1.07mi |
| 509 Britton Springs Rd Unit B2 Clarksville, TN | 2.0 | 1.5 | 880 | $1,095 | $1.24 | 21d | 1 | 1.09mi |
| 161 Hadley Dr Unit B Clarksville, TN | 3.0 | 2.0 | 1250 | $1,450 | $1.16 | 21d | 1 | 1.09mi |
| 511 Britton Springs Rd Apt C1 Clarksville, TN | 2.0 | 1.5 | 880 | $1,095 | $1.24 | 21d | 1 | 1.11mi |
| 113 W Fork Dr Unit D Clarksville, TN | 2.0 | 1.0 | 750 | $850 | $1.13 | 21d | 1 | 1.11mi |
| 1040 Glenkirk Dr Unit D Clarksville, TN | 2.0 | 2.5 | 1146 | $1,450 | $1.27 | 21d | 1 | 1.12mi |
| 200 Drayton Dr Unit A Clarksville, TN | 2.0 | 2.5 | 1146 | $1,500 | $1.31 | 21d | 1 | 1.13mi |
| 208 Drayton Dr Unit F Clarksville, TN | 2.0 | 2.5 | 1146 | $1,295 | $1.13 | 21d | 1 | 1.16mi |
| 220 Drayton Dr Unit D Clarksville, TN | 2.0 | 2.5 | 1146 | $1,295 | $1.13 | 13d | 1 | 1.18mi |
| 212 Drayton Dr Unit E Clarksville, TN | 2.0 | 2.5 | 1146 | $1,650 | $1.44 | 21d | 1 | 1.18mi |
| 227 Short St Clarksville, TN | 3.0 | 2.0 | 1189 | $1,675 | $1.41 | 21d | 1 | 1.18mi |
| 216 Drayton Dr Unit B Clarksville, TN | 2.0 | 1.5 | 1146 | $1,200 | $1.05 | 21d | 1 | 1.20mi |
| 216 Drayton Dr Unit C Clarksville, TN | 2.0 | 1.5 | 1146 | $1,395 | $1.22 | 21d | 1 | 1.20mi |
| 216 Drayton Dr Clarksville, TN | 2.0 | 2.5 | 1146 | $1,395 | $1.22 | 21d | 1 | 1.20mi |
| 1024 Glenkirk Dr Clarksville, TN | 2.0 | 1.5 | 1146 | $1,395 | $1.22 | 21d | 1 | 1.22mi |
| 1031 Glenkirk Dr Clarksville, TN | 2.0 | 1.5 | 1146 | $1,395 | $1.22 | 21d | 1 | 1.22mi |
| 1032 Glenkirk Dr Clarksville, TN | 2.0 | 1.5 | 1146 | $1,395 | $1.22 | 21d | 1 | 1.22mi |
| 1023 Glenkirk Dr Clarksville, TN | 2.0 | 1.5 | 1146 | $1,415 | $1.23 | 21d | 1 | 1.22mi |
| 533 Patriot Park Ct Unit C Clarksville, TN | 2.0 | 1.5 | 1100 | $1,150 | $1.05 | 21d | 1 | 1.32mi |
| 524 Patriot Park Ct Unit D Clarksville, TN | 2.0 | 1.5 | 1020 | $995 | $0.98 | 21d | 1 | 1.32mi |
| 3 Lexington Dr #3 Clarksville, TN | 2.0 | 1.0 | 788 | $850 | $1.08 | 21d | 1 | 1.34mi |
HOA detail condo
- Monthly dues
- $16 · $192/yr
- Assessments
- None detected in remarks — confirm with the listing agent.
Listing history 22 events
-
2026-06-18days on market $155,000 Active 69 DOM
-
2026-06-17days on market $155,000 Active 68 DOM
-
2026-06-16days on market $155,000 Active 67 DOM
-
2026-06-15days on market $155,000 Active 66 DOM
-
2026-06-14days on market $155,000 Active 64 DOM
-
2026-06-13days on market $155,000 Active 63 DOM
-
2026-06-10days on market $155,000 Active 61 DOM
-
2026-06-09days on market $155,000 Active 60 DOM
-
2026-06-08days on market $155,000 Active 59 DOM
-
2026-06-07days on market $155,000 Active 58 DOM
-
2026-06-05days on market $155,000 Active 55 DOM
-
2026-06-03days on market $155,000 Active 54 DOM
-
2026-06-02days on market $155,000 Active 53 DOM
-
2026-05-31days on market $155,000 Active 51 DOM
-
2026-05-30days on market $155,000 Active 50 DOM
-
2026-04-10$155,000 Active
-
2025-01-27historical $1,100
-
2025-01-22$1,100
-
2019-07-24soldstatus $42,000 Closed
-
2019-07-23soldstatus $42,000
-
2019-06-19historical
-
2019-06-19$42,000
ⓘ Source: listings_history table (triggers on properties + properties_extension) + one-shot
backfill from property_details.listing_events for pre-trigger history.
Tax reassessment forecast TN · Resets to sale price
- Current annual tax
- $1,363 · $114/mo
- Projected year-2 tax
- $1,363 · $114/mo
- Expected delta
- $0/yr ($0/mo · 0.0%)
ⓘ Screening estimate from a state-policy table — verify with the county assessor before closing.
Climate risk First Street
- Flood 1/10 Low FEMA zone X (unshaded) · 0% chance over 30 yrs
- Wildfire 1/10 Low
- Heat 6/10 Major 7 d/yr ≥107°F today · 21 d/yr by 30 yrs out
- Wind 4/10 Moderate 9% chance of damaging wind over 30 yrs
- Air quality 2/10 Low 1 unhealthy d/yr today · 1 by 30 yrs out
Nearby sold comps map
Loading sold comps map…
Walkable amenities ~0.75 mi
Loading nearby amenities…
Taxation est. · year 1
- Rental income
- $15,500
- − Mortgage interest
- −$8,682
- − Property taxes
- −$1,363
- − Insurance
- −$775
- − Repairs & maintenance
- −$1,240
- − Management
- −$1,240
- − HOA
- −$192
- − Depreciation
- −$4,509
- Taxable loss
- −$2,502
- Est. tax savings @ 24.0%
- +$600
- After-tax cash flow
- $761/yr
For passive investors: Depreciation is non-cash, so a rental often shows a tax loss while cash-flowing — sheltering income. Rental losses are passive: they offset passive income freely, and up to $25,000/yr can offset ordinary (W-2) income if you actively participate and your MAGI is under $100k (phasing out to $0 by $150k); unused losses carry forward. On sale, claimed depreciation is recaptured at up to 25%, and gains may owe capital-gains tax (a 1031 exchange can defer both). Figures are a year-1 estimate at your 24.0% rate — not tax advice; consult a CPA.
Schools (NCES district)
- District
- Montgomery County
- NCES district ID
- 4703030
- Math proficiency
- 25% ▼ -20.00%
- Reading proficiency
- 31% ▼ -10.00%
- Median HH income
- $50,423
- Composite
- 24.56/100
- National rank
- #7641
- State rank
- #65 of 139 in TN
Livability — Clarksville
- Score
- 84/100
- State rank
- #1
- US rank
- #798
Category grades
Schools grade is shown separately in the Schools card above.
Census & demographics
- Census place
- Clarksville, TN
- County
- Montgomery County · 211,371 people
- City population
- 211,371
- Metro
- Clarksville, TN-KY
- Population (ZIP)
- 87,652
- Household income
- $70,393
- Rent vs Own
- Severe rent burden
- 2093.0
Population outlook (Montgomery County) Hauer SSP2
- Today (2025)
- 236,633 people
- By 2030
- 258,978 · +9.4%
- By 2040
- 305,456 · +29.1%
- By 2050
- 353,147 · +49.2%
- By 2075
- 471,289 · +99.2%
- By 2100
- 564,122 · +138.4%
Race, ethnicity, and origin ACS 2023
- Neighborhood character
- Diverse neighborhood (Simpson 0.68)
- Race & ethnicity
- White 48% Black 26% Hispanic / Latino 15% Two or more races 13% Asian 3%
- Hispanic origin (detail)
- Mexican 6% Puerto Rican 4%
- Common ancestry
- Italian 4% Slovak 1% Lithuanian 1%
- Foreign-born
- 8% · Canada, South Korea, China
- Languages at home
- 88% English-only · Spanish 8% German/W. Germanic 1% Other Indo-European 1%
Political lean MEDSL · Montgomery
- 2024 margin
- R (+18.4) · D 40.0% · R 58.5% · Other 1.5%
- 2008→2024 swing
- -10.5pp toward R · 2008: -7.9pp · 2024: -18.4pp
- All cycles
- 2024: R+18.4 2020: R+12.7 2016: R+18.6 2012: R+10.5 2008: R+7.9
Not yet ingested
- Civics
- —
Market trends
- HPI YoY
- ▼ -58.81%
- Current HPI
- 264.4911
- Rent YoY
- ▲ 1.27%
- Metro
- Clarksville, TN-KY
- State GDP YoY
- ▲ 2.78%
- F500 in state
- 22
Industry mix (Fortune 500 HQ in TN)
| Industry | F500 HQs | Revenue |
|---|---|---|
| Healthcare | 3 | $91B |
|
||
| Retail | 3 | $72B |
|
||
| Transportation / Logistics | 1 | $88B |
|
||
| Paper / Packaging | 1 | $19B |
|
||
| Insurance | 1 | $13B |
|
||
| Energy | 1 | $12B |
|
||
Price history
+269.0% since first listed7 events — show timeline
- 2026-04-10 Listed $155,000 REALTRACS as Distributed by MLS Grid
- 2025-01-27 Rental Removed $1,100 REALTRACS
- 2025-01-22 Listed for Rent $1,100 REALTRACS
- 2019-07-24 Sold (MLS) $42,000 REALTRACS as Distributed by MLS Grid
- 2019-07-23 Sold (Public Records) $42,000 Public Records
- 2019-06-19 Listing Removed — REALTRACS as Distributed by MLS Grid
- 2019-06-19 Listed $42,000 REALTRACS as Distributed by MLS Grid
Property tax history
+9.1%/yrLatest (2025): $1,363 · +1.3% YoY. Source: county tax records.
Cash-flow waterfall
monthlySold comps — $/sqft
last 12 mo · ≤1 miLoading sold comps…