 🏷️ Likely Rental
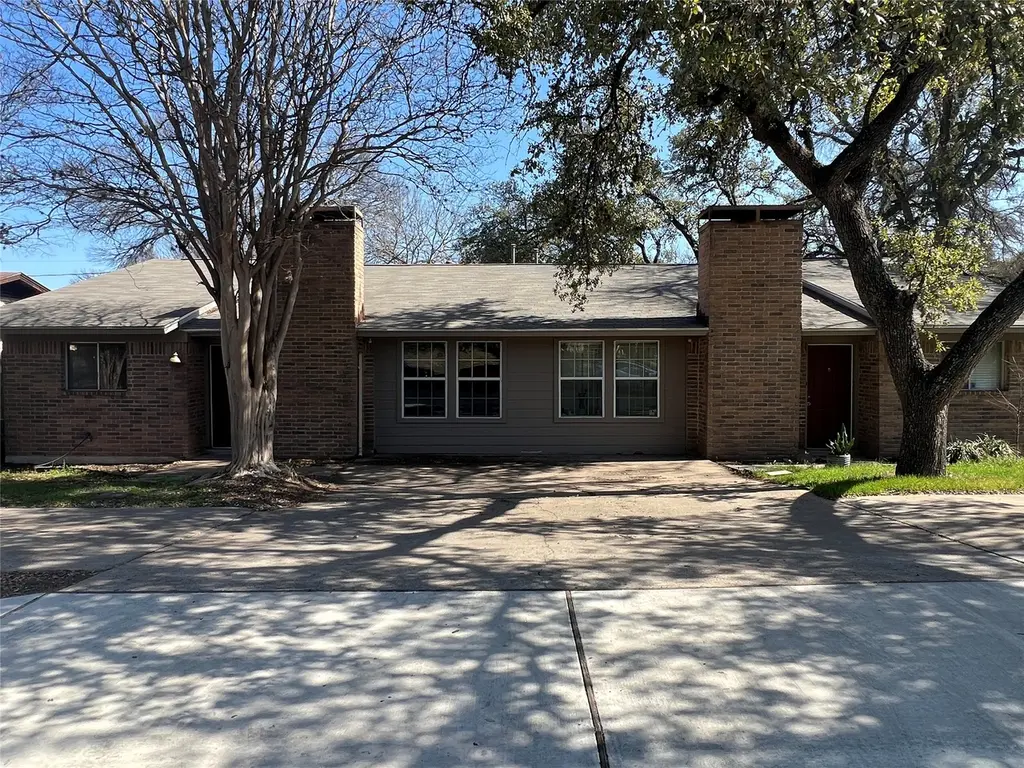
7105 Cannonleague Dr · Austin, TX
Flood risk 1/10 · Minimal
- FEMA flood zone
- X (unshaded)
- Chance of flooding over 30 yrs
- 0.0%
- Est. flood insurance / yr
- $507 – $1,088
Fire risk 3/10 · Minor
- Est. fire insurance / yr
- $1,222 – $2,270
Heat risk 8/10 · Major
- Hot days now (above 108°F)
- 7 days/yr
- Hot days in 30 yrs
- 22 days/yr
Wind risk 8/10 · Major
- Chance of severe wind over 30 yrs
- 80.0%
Air-quality risk 2/10 · Minimal
- Unhealthy air days now
- 1 days/yr
- Unhealthy air days in 30 yrs
- 1 days/yr
Risk factors via First Street. Map © Google.
Why this score? — see what drove the D grade
The composite is a weighted blend of 9 inputs, each scored 0–100. Each bar is that input's sub-score; the figure is the points it added to the 100-point composite (weight × sub-score).
- ARV discount +15.0/15.0
- Cash flow +9.5/30.0
- Livability +4.1/5.0
- 1% rule +3.4/10.0
- Schools +3.4/10.0
- DSCR +2.7/10.0
- Condition / age +2.5/5.0
- Rent growth +2.0/5.0
- Appreciation +0.0/10.0
$439,500
🖨 Deal sheet (PDF) 📄 Offer letter ✓ Due diligence
Multi-family units
County records classify this as Multi-Family (2-4 Unit). Listing-text estimate: 2 units. confirmed
Listing remarks MLS
Well maintained duplex in prime location! Both units have 2 bedrooms, 1 bathroom, dining area, large living room, laundry room and nice size backyards. Updates have been done to both sides with Side A having new flooring in the bedrooms, all new paint and kitchen countertops. Side B has new laminate flooring in the living room and bedrooms. Exterior was painted in January and roof was replaced in August 2025. Side A is vacant and is a GO. Side B can be shown with offer. Please do not disturb the tenant. Great opportunity for owner/occupant or investor in amazing South Austin location.
Key facts
- Nice size backyards
- Laundry room
- New flooring
Tags
Neighborhood map
What this means for you Summary
Snapshot
- This is a 2 × 2-bed/1.0-bath units multifamily listed at $440k.
Deal economics
- At list price, monthly cash flow is $-308 ($-4k/yr) — negative. Per door: $-154/mo.
- To cash-flow at today's rent, offer at most $385k (12.4% below list).
- To meet the 1% rule (rent ≥ 1% of price), the offer needs to be $369k (16.1% below list).
- Recommended offer: $369k (16.1% below list) — sets the bar for 1% rule.
- Cap rate 5.5% vs local median 1.8% in Austin — top-decile yield for the area; either an underpriced asset or a hidden risk that comps aren't pricing in. Stress-test before assuming the spread holds.
Location & tenants
- Location reads 82/100 on livability (#16 in TX, #1,208 nationally) — a professional / high-income tenant draw. Strengths: amenities A+, commute A+, employment A+; Watch: cost of living D, crime F.
- Austin ISD (urban): math 33% / reading 44% proficiency, ranked #431 of 826 in TX (top 52%) — families likely to look elsewhere, expect single-tenant / working-renter base with shorter leases.
- Market conditions: Rents soft (-2.2%/yr); 450 active listings in the ZIP; 33 comparable units currently listed for rent nearby; rentals at typical pace (median 20d on market — plan ~3-4 weeks tenant-placement turnaround); solid renter incomes; 17,121 units permitted in Travis County in 2024 (11,963 in 5+ unit buildings).
- At $3,688/mo this rent would consume 51% of the median local household income ($86k/yr) (locally 3006% of renters already pay >50% of income on rent) — very limited rent-growth headroom before tenants either downsize or default.
Forward outlook
- Local home prices are declining (-3.0%/yr); year-one equity from $3k of loan paydown is wiped out by about $13k of value loss. Plan a longer hold.
- Travis County population projected at +60% by 2050 — long-run rental-demand tailwind backs the buy-and-hold thesis.
Negotiation context
- It's been on market 79 days — a 6% lower offer ($413k) is reasonable based on typical stale-listing flexibility.
- 7 sale attempts since 20y ago; this cycle's ask has dropped $34k (7%) from the opening price — seller is motivated, your offer sets the floor, not the list.
- Current owner paid $214k; list at $440k implies a 105% gain — meaningful room to come down on a strong offer.
Risks & watch-outs
- Climate carrying-cost: severe wind risk, 80% chance of damaging wind over 30y; extreme-heat days projected 7→22/yr by 2055 (HVAC capex compounding) — expect insurance premiums to compound above CPI over the hold.
Questions for the listing agent
- What do current leases actually rent for vs. the listed asking? Can we see a recent rent roll and the last 12 months of T-12 income?
- It's been on market 79 days. Have you received any prior offers? Is the seller open to a 16% concession, seller financing, or rate buy-down credit?
- Can we see the unit-by-unit rent roll, current vacancy, and any below-market leases? What's the average tenancy length?
- What capital expenditures (roof, boiler, parking lot, exteriors) have been made in the last 5 years, and what's planned in the next 2?
- Built in 1976 — when were the roof, HVAC, electrical panel, plumbing, and water heater last replaced?
- Why hasn't it sold? Are there any deal-killer items the seller is aware of (foundation, flood, title, zoning, code violations)?
- Is there a deadline driving the sale (1031 exchange, divorce, estate, relocation)? That informs how much negotiation room exists.
- Crime grade is F in this area — have there been break-ins, vandalism, or insurance claims at this property in the last 3 years? What carrier currently insures it and at what premium?
- The area grade is low — what's the realistic commute time and amenity access for the typical tenant pool here? Any planned neighborhood developments (good or bad) we should know about?
- What's the average days-on-market for RENTAL listings here right now (not sales)? A rising rental-DOM trend means longer vacancies and softer asking-rent achievability than the comps imply.
- What's the recent tenant-quality profile in this submarket — average credit score on applications, eviction rate, late-payment / NSF rate, and stable-employment percentage? A property-management company in the area should have these aggregated.
- How much new apartment / multifamily construction is in the pipeline within 1–3 miles? Heavy new supply (>2% of stock underway) typically softens rents 12–24 months out; light construction supports rent growth.
Investment metrics
- 1% rule
- 0.84% ✗
- Cap rate
- 5.45%
- Cash-on-cash
- -3.01%
- DSCR
- 0.87
- GRM
- 9.9
CMA / ARV
- ARV (median comp)
- $558,191
- List price
- $439,500
- Delta
- -21.26%
- Verdict
- UNDERPRICED
- Comps
- 20 within 1.0 mi
Show comp detail 8 sales within ~0.75 mi
| Address | Dist | Beds/Ba | Sqft | Sold | Price | $/sf | Match |
|---|---|---|---|---|---|---|---|
| 2104 Courtney St | 0.25mi | 4/4.0 | 2,035 (-11%) | 8mo | $499,000 | $245 | 64 |
| 7825 Beauregard Cir #22 | 0.55mi | 4/4.0 | 2,156 (-5%) | 3mo | $380,000 | $176 | 63 |
| 6714 Windrift Way | 0.49mi | 4/4.0 | 2,410 (+6%) | 9mo | $441,000 | $183 | 60 |
| 7825 Beauregard Cir #26 | 0.55mi | 4/5.0 | 2,212 (-3%) | 10mo | $369,900 | $167 | 57 |
| 7825 Beauregard Cir #14 | 0.55mi | 4/4.0 | 2,156 (-5%) | 11mo | $430,000 | $199 | 56 |
| 7825 Beauregard Cir #6 | 0.55mi | 4/4.0 | 2,186 (-4%) | 16mo | $399,000 | $183 | 55 |
| 8105 Dowling Cv | 0.72mi | 4/4.0 | 1,968 (-14%) | 5mo | $420,000 | $213 | 40 |
| 8106 Hood Cir | 0.74mi | 4/3.0 | 2,014 (-12%) | 11mo | $495,000 | $246 | 33 |
Match score weights: distance 35% · size 25% · config 20% · recency 20%. Top-matched comps best support the ARV.
Projected returns pro-forma
-3.0% appreciation · 0.0% rent growth · sell at horizon
- IRR
- -24.9%
- Equity multiple
- 0.18×
- Total profit
- $-101,503
- Equity at exit
- $65,531
- IRR
- -34.5%
- Equity multiple
- -0.26×
- Total profit
- $-154,767
- Equity at exit
- $38,000
Cash invested: $123,060 (down + closing). Projections, not guarantees.
Landlord ↔ Tenant lean methodology
- Overall (STATE)
- 87 Strongly Landlord-Friendly
- State Texas
- 87 Strongly Landlord-Friendly · R+5
- County
- — inherits STATE
- City
- — inherits STATE
ZIP-level market 78745
- Rents YoY
- -2.2%
- Active inventory
- 450
- Price-to-rent
- 19.9×
Monthly cashflow live
- Estimated rent
- $3,688 high interval (Pro) →
- Mortgage (P&I)
- −$2,305
- Tax from tax record
- −$734 /mo · $8,809/yr
- Insurance
- −$183
- HOA
- −$0
- Vacancy / Maint / Mgmt
- −$774
- Net cashflow
- $-308
Break-even live
Sensitivity live
| Price | -10% $-60 | -5% $-184 | +0% $-308 | +5% $-433 | +10% $-557 |
|---|---|---|---|---|---|
| Rent | -10% $-600 | -5% $-454 | +0% $-308 | +5% $-163 | +10% $-17 |
| Rate | -1.0pp $-87 | -0.5pp $-197 | base $-308 | +0.5pp $-422 | +1.0pp $-538 |
2-unit breakdown (identical units grouped — click to expand)
| Units | Beds | Baths | Est. rent |
|---|---|---|---|
| 2× units | 2 | 1 | $3,688 |
| #1 | 2 | 1 | $1,844 |
| #2 | 2 | 1 | $1,844 |
| Total (2 units) | $3,688 | ||
UW: 25.0% down · 7.5% · 30yr · 1.5% tax · 5.0% vac · 8.0% maint · 8.0% mgmt
Financing live
Cash to close
- Down payment
- $109,875
- Closing costs
- $13,185
- Reserves months
- —
- Total cash needed
- —
Loan-product check · same deal, 3 products live
Conventional
25% down · 7.5% · 30yr
- Down + closing
- —
- Monthly P&I
- —
- Monthly cashflow
- —
- DSCR
- —
- Eligible?
- —
Personal DTI + credit; lowest rate.
DSCR
20% down · 8.5% · 30yr
- Down + closing
- —
- Monthly P&I
- —
- Monthly cashflow
- —
- DSCR
- —
- Eligible?
- —
No personal income docs; deal must DSCR.
Hard money
10% down · 12.0% · 12mo
- Down + closing
- —
- Monthly P&I
- —
- Monthly cashflow
- —
- DSCR
- —
- Eligible?
- —
Short-term bridge; refi at stabilization.
Rent comps 33 comps
| Address | Beds | Baths | Sqft | Rent | $/sqft | DOM | Units | Dist |
|---|---|---|---|---|---|---|---|---|
| 7200 Dan Jean Dr Austin, TX | 3.0 | 4.0 | 1640 | $2,600 | $1.59 | 45d | 1 | 0.08mi |
| 6800 Menchaca Rd #45 Austin, TX | 3.0 | 2.5 | 1865 | $2,500 | $1.34 | 0d | 1 | 0.29mi |
| 2114 Lear Ln Austin, TX | 3.0 | 2.0 | 1652 | $2,500 | $1.51 | 45d | 1 | 0.47mi |
| 6504 Libyan Dr Austin, TX | 3.0 | 2.0 | 1592 | $3,000 | $1.88 | 6d | 1 | 0.65mi |
| 1204 Spearson Ln Austin, TX | 3.0 | 2.0 | 1618 | $3,200 | $1.98 | 6d | 1 | 0.67mi |
| 1204 Spearson Ln Austin, TX | 4.0 | 3.0 | 1618 | $3,200 | $1.98 | 4d | 1 | 0.67mi |
| 2525 Berkeley Ave Austin, TX | 3.0 | 2.0 | 1650 | $2,650 | $1.61 | 26d | 1 | 0.68mi |
| 2502 Aldford Dr Austin, TX | 3.0 | 2.0 | 2100 | $3,500 | $1.67 | 26d | 1 | 0.69mi |
| 2508 Aldford Dr Austin, TX | 3.0 | 3.0 | 1927 | $3,700 | $1.92 | 17d | 1 | 0.73mi |
| 7901 Keswick Dr Austin, TX | 3.0 | 2.0 | 1598 | $3,399 | $2.13 | 45d | 1 | 0.79mi |
| 718 Ann Taylor Dr Austin, TX | 3.0 | 2.0 | 2120 | $2,850 | $1.34 | 45d | 1 | 0.87mi |
| 8353 Steamline Cir Austin, TX | 3.0 | 2.5 | 2526 | $3,250 | $1.29 | 0d | 1 | 0.93mi |
| 1507 Homespun Rd Austin, TX | 3.0 | 2.5 | 2035 | $3,300 | $1.62 | 6d | 1 | 0.95mi |
| 7102 Moat Cv Austin, TX | 3.0 | 2.0 | 1600 | $2,500 | $1.56 | 26d | 1 | 1.01mi |
| 8301 Winterstein Dr Austin, TX | 3.0 | 2.5 | 2163 | $2,750 | $1.27 | 18d | 1 | 1.01mi |
| 5915 Swayden Ln Austin, TX | 3.0 | 2.5 | 1844 | $3,200 | $1.74 | 0d | 1 | 1.01mi |
| 5915 Swayden Ln Austin, TX | 3.0 | 3.0 | 1844 | $3,200 | $1.74 | 18d | 1 | 1.01mi |
| 1410 Casa Dr Austin, TX | 4.0 | 2.5 | 2289 | $3,495 | $1.53 | 4d | 1 | 1.02mi |
| 5809 Swayden Ln Austin, TX | 3.0 | 2.5 | 1873 | $3,200 | $1.71 | 19d | 1 | 1.08mi |
| 7900 W Gate Blvd Unit B Austin, TX | 3.0 | 2.0 | 1984 | $1,795 | $0.90 | 17d | 1 | 1.09mi |
| 7601 Cooper Ln #4 Austin, TX | 3.0 | 2.5 | 1949 | $3,150 | $1.62 | 26d | 1 | 1.21mi |
| 7601 Cooper Ln #4 Austin, TX | 3.0 | 2.5 | 1949 | $3,150 | $1.62 | 6d | 1 | 1.21mi |
| 5504 Kings Hwy Austin, TX | 3.0 | 2.0 | 1800 | $3,850 | $2.14 | 26d | 1 | 1.24mi |
| 323 W William Cannon Dr Unit A Austin, TX | 3.0 | 1.5 | 1905 | $1,595 | $0.84 | 45d | 1 | 1.29mi |
| 8110 Ranch Rd Unit 98 Austin, TX | 3.0 | 2.5 | 2133 | $4,300 | $2.02 | 45d | 1 | 1.30mi |
| 11203 Ranch Rd Unit 501 Austin, TX | 3.0 | 3.0 | 1730 | $2,400 | $1.39 | 19d | 1 | 1.30mi |
| 1308 Central Park Ct Austin, TX | 3.0 | 2.5 | 2012 | $3,150 | $1.57 | 14d | 1 | 1.31mi |
| 1201 Salem Park Ct Austin, TX | 4.0 | 3.0 | 2061 | $3,095 | $1.50 | 0d | 1 | 1.33mi |
| 5420 Fairmont Cir Austin, TX | 3.0 | 2.0 | 1800 | $3,700 | $2.06 | 26d | 1 | 1.34mi |
| 2406 Sheri Oak Ln Austin, TX | 4.0 | 2.0 | 1686 | $2,250 | $1.33 | 45d | 1 | 1.38mi |
| 8900 Jodie Ln Austin, TX | 4.0 | 2.5 | 2586 | $3,200 | $1.24 | 45d | 1 | 1.42mi |
| 1803 Fair Oaks Dr Austin, TX | 3.0 | 2.5 | 1896 | $6,000 | $3.16 | 18d | 1 | 1.46mi |
| 6509 Skycrest Dr Austin, TX | 4.0 | 2.0 | 2246 | $2,700 | $1.20 | 22d | 1 | 1.48mi |
Listing history 29 events
-
2026-05-09status Pending 591-char remark
Show marketing remark (591 chars)
Well maintained duplex in prime location! Both units have 2 bedrooms, 1 bathroom, dining area, large living room, laundry room and nice size backyards. Updates have been done to both sides with Side A having new flooring in the bedrooms, all new paint and kitchen countertops. Side B has new laminate flooring in the living room and bedrooms. Exterior was painted in January and roof was replaced in August 2025. Side A is vacant and is a GO. Side B can be shown with offer. Please do not disturb the tenant. Great opportunity for owner/occupant or investor in amazing South Austin location.
-
2026-04-17price $439,500 591-char remark
Show marketing remark (591 chars)
Well maintained duplex in prime location! Both units have 2 bedrooms, 1 bathroom, dining area, large living room, laundry room and nice size backyards. Updates have been done to both sides with Side A having new flooring in the bedrooms, all new paint and kitchen countertops. Side B has new laminate flooring in the living room and bedrooms. Exterior was painted in January and roof was replaced in August 2025. Side A is vacant and is a GO. Side B can be shown with offer. Please do not disturb the tenant. Great opportunity for owner/occupant or investor in amazing South Austin location.
-
2026-04-02price $455,000 591-char remark
Show marketing remark (591 chars)
Well maintained duplex in prime location! Both units have 2 bedrooms, 1 bathroom, dining area, large living room, laundry room and nice size backyards. Updates have been done to both sides with Side A having new flooring in the bedrooms, all new paint and kitchen countertops. Side B has new laminate flooring in the living room and bedrooms. Exterior was painted in January and roof was replaced in August 2025. Side A is vacant and is a GO. Side B can be shown with offer. Please do not disturb the tenant. Great opportunity for owner/occupant or investor in amazing South Austin location.
-
2026-03-07price $465,000 591-char remark
Show marketing remark (591 chars)
Well maintained duplex in prime location! Both units have 2 bedrooms, 1 bathroom, dining area, large living room, laundry room and nice size backyards. Updates have been done to both sides with Side A having new flooring in the bedrooms, all new paint and kitchen countertops. Side B has new laminate flooring in the living room and bedrooms. Exterior was painted in January and roof was replaced in August 2025. Side A is vacant and is a GO. Side B can be shown with offer. Please do not disturb the tenant. Great opportunity for owner/occupant or investor in amazing South Austin location.
-
2026-02-19$474,000 Active 591-char remark
Show marketing remark (591 chars)
Well maintained duplex in prime location! Both units have 2 bedrooms, 1 bathroom, dining area, large living room, laundry room and nice size backyards. Updates have been done to both sides with Side A having new flooring in the bedrooms, all new paint and kitchen countertops. Side B has new laminate flooring in the living room and bedrooms. Exterior was painted in January and roof was replaced in August 2025. Side A is vacant and is a GO. Side B can be shown with offer. Please do not disturb the tenant. Great opportunity for owner/occupant or investor in amazing South Austin location.
-
2023-04-13price
-
2023-03-15Active
-
2014-01-29soldstatus
-
2014-01-27soldstatus Sold
-
2013-12-13status Pending - Taking Backups
-
2013-11-21price $230,000 Active
-
2013-11-21status Active
-
2013-10-24historical Temporarily Off Market
-
2013-09-06price $218,900
-
2013-07-16$230,000 Active
-
2011-06-14soldstatus Sold
-
2011-05-03status Pending
-
2011-04-12$169,900 Active
-
2008-11-28historical
-
2008-05-28
-
2006-09-08soldstatus $214,000
-
2006-09-06soldstatus
-
2006-07-30historical
-
2006-04-13$209,900
-
1996-01-02soldstatus $95,000
-
1992-04-30soldstatus
-
1984-07-10soldstatus
-
1983-07-28soldstatus
-
1978-05-26soldstatus
ⓘ Source: listings_history table (triggers on properties + properties_extension) + one-shot
backfill from property_details.listing_events for pre-trigger history.
Tax reassessment forecast TX · Resets to sale price
- Current annual tax
- $8,809 · $734/mo
- Projected year-2 tax
- $8,809 · $734/mo
- Expected delta
- $0/yr ($0/mo · 0.0%)
ⓘ Screening estimate from a state-policy table — verify with the county assessor before closing.
Climate risk First Street
- Flood 1/10 Low FEMA zone X (unshaded) · 0% chance over 30 yrs
- Wildfire 3/10 Moderate
- Heat 8/10 Severe 7 d/yr ≥108°F today · 22 d/yr by 30 yrs out
- Wind 8/10 Severe 80% chance of damaging wind over 30 yrs
- Air quality 2/10 Low 1 unhealthy d/yr today · 1 by 30 yrs out
Nearby sold comps map
Loading sold comps map…
Walkable amenities ~0.75 mi
Loading nearby amenities…
Taxation est. · year 1
- Rental income
- $44,256
- − Mortgage interest
- −$24,619
- − Property taxes
- −$8,809
- − Insurance
- −$2,198
- − Repairs & maintenance
- −$3,540
- − Management
- −$3,540
- − Depreciation
- −$12,785
- Taxable loss
- −$11,236
- Est. tax savings @ 24.0%
- +$2,697
- After-tax cash flow
- $-1,005/yr
For passive investors: Depreciation is non-cash, so a rental often shows a tax loss while cash-flowing — sheltering income. Rental losses are passive: they offset passive income freely, and up to $25,000/yr can offset ordinary (W-2) income if you actively participate and your MAGI is under $100k (phasing out to $0 by $150k); unused losses carry forward. On sale, claimed depreciation is recaptured at up to 25%, and gains may owe capital-gains tax (a 1031 exchange can defer both). Figures are a year-1 estimate at your 24.0% rate — not tax advice; consult a CPA.
Schools (NCES district)
- District
- Austin ISD
- NCES district ID
- 4808940
- Math proficiency
- 33% ▼ -19.00%
- Reading proficiency
- 44% ▼ -7.00%
- Median HH income
- $54,627
- Composite
- 33.65/100
- National rank
- #5397
- State rank
- #431 of 826 in TX
Livability — Austin
- Score
- 82/100
- State rank
- #16
- US rank
- #1208
Category grades
Schools grade is shown separately in the Schools card above.
Census & demographics
- Census place
- Austin, TX
- County
- Travis County · 1,299,254 people
- City population
- 1,066,854
- Metro
- Austin-Round Rock-Georgetown, TX
- Population (ZIP)
- 61,219
- Household income
- $86,109
- Rent vs Own
- Severe rent burden
- 3006.0
Population outlook (Travis County) Hauer SSP2
- Today (2025)
- 1,545,133 people
- By 2030
- 1,729,269 · +11.9%
- By 2040
- 2,097,596 · +35.8%
- By 2050
- 2,463,890 · +59.5%
- By 2075
- 3,249,374 · +110.3%
- By 2100
- 3,801,868 · +146.1%
Race, ethnicity, and origin ACS 2023
- Neighborhood character
- Diverse neighborhood (Simpson 0.58)
- Race & ethnicity
- White 54% Hispanic / Latino 35% Two or more races 12% Black 4% Asian 3%
- Hispanic origin (detail)
- Mexican 27% Puerto Rican 2%
- Common ancestry
- Italian 2% Slovak 2% Lithuanian 2%
- Foreign-born
- 11% · Canada, Jamaica
- Languages at home
- 76% English-only · Spanish 20% Other Indo-European 1%
Political lean MEDSL · Travis
- 2024 margin
- Solid D (+39.3) · D 68.8% · R 29.4% · Other 1.8%
- 2008→2024 swing
- +9.9pp toward D · 2008: 29.4pp · 2024: 39.3pp
- All cycles
- 2024: D+39.3 2020: D+45.0 2016: D+38.9 2012: D+23.9 2008: D+29.4
Not yet ingested
- Civics
- —
Market trends
- HPI YoY
- ▼ -596.81%
- Current HPI
- 278.8433
- Rent YoY
- ▼ -2.17%
- Metro
- Austin-Round Rock-Georgetown, TX
- State GDP YoY
- ▲ 3.95%
- F500 in state
- 110
Industry mix (Fortune 500 HQ in TX)
| Industry | F500 HQs | Revenue |
|---|---|---|
| Energy | 16 | $1,198B |
|
||
| Technology | 5 | $198B |
|
||
| Engineering / Construction | 4 | $72B |
|
||
| Energy Services | 3 | $60B |
|
||
| Utilities | 3 | $41B |
|
||
| Healthcare | 2 | $330B |
|
||
Price history
+362.6% since first listed29 events — show timeline
- 2026-05-09 Pending — Unlock MLS
- 2026-04-17 Price Changed $439,500 Unlock MLS
- 2026-04-02 Price Changed $455,000 Unlock MLS
- 2026-03-07 Price Changed $465,000 Unlock MLS
- 2026-02-19 Listed $474,000 Unlock MLS
- 2023-04-13 Price Changed — Unlock MLS
- 2023-03-15 Listed — Unlock MLS
- 2014-01-29 Sold (Public Records) — Public Records
- 2014-01-27 Sold (MLS) — Unlock MLS
- 2013-12-13 Pending — Unlock MLS
- 2013-11-21 Relisted — Unlock MLS
- 2013-11-21 Price Changed $230,000 Unlock MLS
- 2013-10-24 Delisted — Unlock MLS
- 2013-09-06 Price Changed $218,900 Unlock MLS
- 2013-07-16 Listed $230,000 Unlock MLS
- 2011-06-14 Sold (MLS) — Unlock MLS
- 2011-05-03 Pending — Unlock MLS
- 2011-04-12 Listed $169,900 Unlock MLS
- 2008-11-28 Delisted — Unlock MLS
- 2008-05-28 Listed — Unlock MLS
- 2006-09-08 Sold (Public Records) $214,000 Public Records
- 2006-09-06 Sold (MLS) — Unlock MLS
- 2006-07-30 Delisted — Unlock MLS
- 2006-04-13 Listed $209,900 Unlock MLS
- 1996-01-02 Sold (Public Records) $95,000 Public Records
- 1992-04-30 Sold (Public Records) — Public Records
- 1984-07-10 Sold (Public Records) — Public Records
- 1983-07-28 Sold (Public Records) — Public Records
- 1978-05-26 Sold (Public Records) — Public Records
Property tax history
+3.4%/yrLatest (2026): $8,809 · -9.3% YoY. Source: county tax records.
Cash-flow waterfall
monthlySold comps — $/sqft
last 12 mo · ≤1 miLoading sold comps…