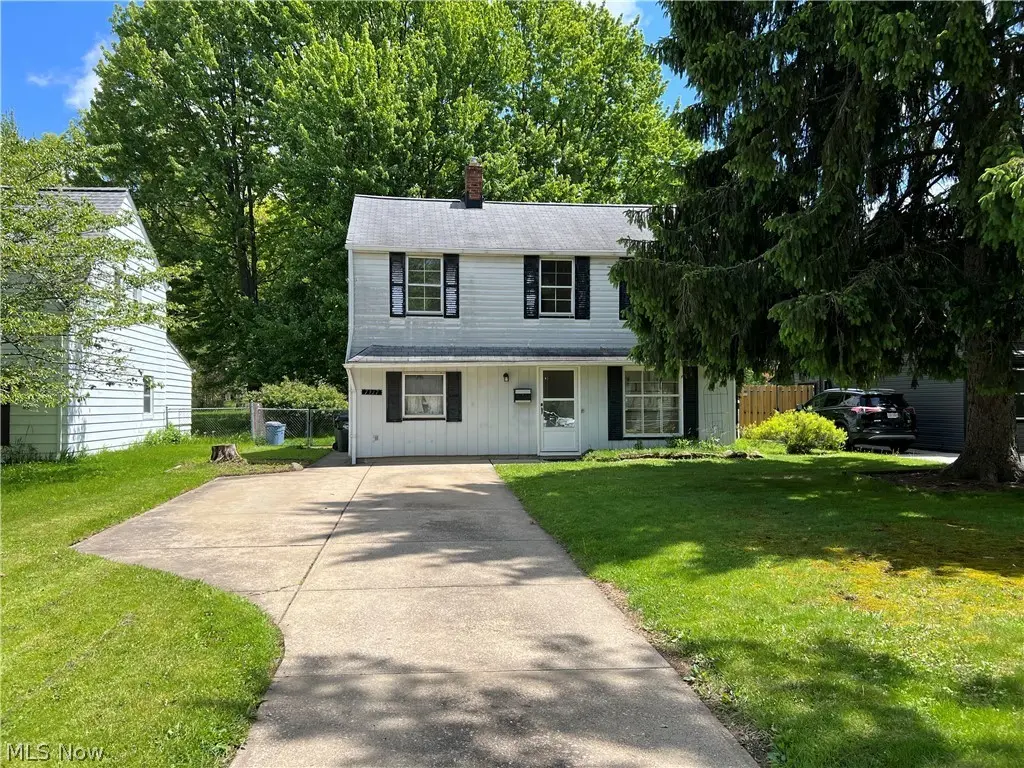
7317 Parma Park Blvd · Parma, OH
Flood risk 1/10 · Minimal
- FEMA flood zone
- X (unshaded)
- Chance of flooding over 30 yrs
- 0.0%
- Est. flood insurance / yr
- $507 – $1,088
Fire risk 1/10 · Minimal
- Est. fire insurance / yr
- $713 – $1,323
Heat risk 3/10 · Minor
- Hot days now (above 95°F)
- 7 days/yr
- Hot days in 30 yrs
- 17 days/yr
Wind risk 1/10 · Minimal
- Chance of severe wind over 30 yrs
- —
Air-quality risk 2/10 · Minimal
- Unhealthy air days now
- 1 days/yr
- Unhealthy air days in 30 yrs
- 3 days/yr
Risk factors via First Street. Map © Google.
Why this score? — see what drove the C+ grade
The composite is a weighted blend of 9 inputs, each scored 0–100. Each bar is that input's sub-score; the figure is the points it added to the 100-point composite (weight × sub-score).
- Cash flow +21.9/30.0
- ARV discount +15.0/15.0
- DSCR +7.0/10.0
- 1% rule +5.9/10.0
- Schools +4.1/10.0
- Livability +4.1/5.0
- Rent growth +3.2/5.0
- Condition / age +2.5/5.0
- Appreciation +0.0/10.0
$165,000
🖨 Deal sheet 📄 Offer letter ✓ Due diligence
Listing remarks
Opportunity awaits in this charming 3-bedroom, 1.5-bath Colonial located in a prime Parma location! Full of character and potential, this home offers the perfect chance to bring your vision and make it shine once again. Step inside to a cozy living room that flows into a formal dining area featuring a sliding glass door leading to the backyard patio — ideal for indoor-outdoor entertaining. The spacious, fully fenced backyard overlooks a peaceful shaded green space, creating a private setting perfect for relaxing, gardening, pets, or summer gatherings. The kitchen offers great space and endless possibilities to redesign and restore it into the heart of the home. Main-floor laundry, a c
Key facts
- Bonus storage room
- Backyard patio
- Formal dining area
Tags
Property features AI
Finance
- Financial info: Annual property tax listed (not included per instructions)
Exterior
- Parking: Driveway (no garage)
- Utilities: Public water; Public sewer
- Home design: 2-story house; Above-grade finished living area approximately 1,320 (public records)
- Construction: Aluminum siding; Asphalt/fiberglass roof; Year built per public records
- Exterior features: Full fenced yard
Interior
- Kitchen: Range; Refrigerator
- Bathrooms: 1 full bathroom; 1 half bathroom; One main-level bathroom
- Heating & cooling: Forced air heating; Ceiling fan(s) for cooling
- Interior features: Ceiling fan(s)
- Laundry & utility: Washer; Dryer
Neighborhood map
What this means for you Summary
Snapshot
- This is a 3-bed/1.5-bath single-family listed at $165k.
Deal economics
- At list price, monthly cash flow is $261 ($3k/yr) — positive.
- The deal already cash-flows at list — no discount required.
- Meets the 1% rule at list price ($2k rent vs $165k).
- Cap rate 8.2% vs local median 5.0% in Parma — top-decile yield for the area; either an underpriced asset or a hidden risk that comps aren't pricing in. Stress-test before assuming the spread holds.
Location & tenants
- Location reads 82/100 on livability (#84 in OH, #1,232 nationally) — a professional / high-income tenant draw. Strengths: crime A+, amenities A+, cost of living A+; Watch: employment C-, commute F.
- Parma City (suburban): math 43% / reading 52% proficiency, ranked #469 of 656 in OH (top 72%) — families likely to look elsewhere, expect single-tenant / working-renter base with shorter leases.
- Market conditions: Rents rising (+2.7%/yr); 151 active listings in the ZIP; 9 comparable units currently listed for rent nearby; rentals leasing fast (median 2d on market — plan ~1-2 weeks tenant-placement turnaround); 1,441 units permitted in Cuyahoga County in 2024 (700 in 5+ unit buildings).
- This rent runs 31% of the median local income ($70k/yr) — at the standard rent-burdened threshold; future hikes will face affordability resistance.
Forward outlook
- Local home prices are declining (-3.0%/yr); year-one equity from $1k of loan paydown is wiped out by about $5k of value loss. Plan a longer hold.
- Cuyahoga County population projected to shrink 8% by 2050 — rents likely to lag national; underwrite the cash flow, not the appreciation.
Negotiation context
- Only 4 days on market — expect competitive offers; lowballing is unlikely to land.
Risks & watch-outs
- Watch-outs: built in 1947 — expect roof / HVAC / electrical / plumbing capex.
Questions for the listing agent
- Built in 1947 — when were the roof, HVAC, electrical panel, plumbing, and water heater last replaced?
- Is there a deadline driving the sale (1031 exchange, divorce, estate, relocation)? That informs how much negotiation room exists.
- Schools are B-rated — typically a magnet for longer-tenancy family renters. What's the average tenant stay here, and is there a school-zone premium baked into asking?
- What's the average days-on-market for RENTAL listings here right now (not sales)? A rising rental-DOM trend means longer vacancies and softer asking-rent achievability than the comps imply.
- What's the recent tenant-quality profile in this submarket — average credit score on applications, eviction rate, late-payment / NSF rate, and stable-employment percentage? A property-management company in the area should have these aggregated.
- How much new for-sale + rental construction is in the pipeline within 1–3 miles? Heavy new supply typically softens prices + rents 12–24 months out; constrained supply supports both.
Investment metrics
- 1% rule
- 1.09% ✓
- Cap rate
- 8.19%
- Cash-on-cash
- 6.78%
- DSCR
- 1.30
- GRM
- 7.6
CMA / ARV
- ARV (median comp)
- $217,392
- List price
- $165,000
- Delta
- -24.10%
- Verdict
- UNDERPRICED
- Comps
- 20 within 1.0 mi
Show comp detail 12 sales within ~0.75 mi
| Address | Dist | Beds/Ba | Sqft | Sold | Price | $/sf | Match |
|---|---|---|---|---|---|---|---|
| 7317 Parma Park Blvd | 0.00mi | 3/1.5 | 1,320 (0%) | 0mo | $175,000 | $133 | 100 |
| 7377 Greenleaf Ave | 0.15mi | 3/2.0 | 1,260 (-4%) | 2mo | $285,000 | $226 | 82 |
| 7198 Greenleaf Ave | 0.26mi | 3/2.0 | 1,357 (+3%) | 4mo | $161,000 | $119 | 78 |
| 7504 Skylark Dr | 0.42mi | 3/2.0 | 1,284 (-3%) | 1mo | $261,000 | $203 | 73 |
| 7295 Oakwood Rd | 0.23mi | 3/1.5 | 1,176 (-11%) | 1mo | $276,000 | $235 | 70 |
| 7334 Greenleaf Ave | 0.13mi | 3/1.5 | 1,484 (+12%) | 4mo | $294,000 | $198 | 70 |
| 11907 Glamer Dr | 0.43mi | 3/2.0 | 1,353 (+2%) | 5mo | $252,000 | $186 | 70 |
| 7311 Beresford Ave | 0.16mi | 3/2.0 | 1,130 (-14%) | 1mo | $270,000 | $239 | 66 |
| 6883 Orchard Blvd | 0.73mi | 3/2.0 | 1,336 (+1%) | 3mo | $207,000 | $155 | 59 |
| 6932 Greenleaf Ave | 0.63mi | 3/2.0 | 1,236 (-6%) | 1mo | $245,000 | $198 | 57 |
| 7588 Sleepy Hollow Dr | 0.46mi | 3/2.0 | 1,133 (-14%) | 5mo | $220,000 | $194 | 49 |
| 6954 Orchard Blvd | 0.59mi | 3/3.0 | 1,192 (-10%) | 3mo | $216,000 | $181 | 47 |
Match score weights: distance 35% · size 25% · config 20% · recency 20%. Top-matched comps best support the ARV.
Projected returns pro-forma
-3.0% appreciation · 2.69% rent growth · sell at horizon
- IRR
- -6.2%
- Equity multiple
- 0.77×
- Total profit
- $-10,624
- Equity at exit
- $24,602
- IRR
- 3.1%
- Equity multiple
- 1.22×
- Total profit
- $10,047
- Equity at exit
- $14,266
Cash invested: $46,200 (down + closing). Projections, not guarantees.
Landlord ↔ Tenant lean methodology
- Overall (STATE)
- 73 Landlord-Friendly
- State Ohio
- 73 Landlord-Friendly · R+6
- County
- — inherits STATE
- City
- — inherits STATE
ZIP-level market 44130
- Rents YoY
- 2.7%
- Active inventory
- 151
- Price-to-rent
- 7.6×
Monthly cashflow live
- Estimated rent
- $1,800 high interval (Pro) →
- Mortgage (P&I)
- −$865
- Tax from tax record
- −$227 /mo · $2,726/yr
- Insurance
- −$69
- HOA
- −$0
- Vacancy / Maint / Mgmt
- −$378
- Net cashflow
- $261
Break-even live
UW: 25.0% down · 7.5% · 30yr · 1.5% tax · 5.0% vac · 8.0% maint · 8.0% mgmt
Financing live
Cash to close
- Down payment
- $41,250
- Closing costs
- $4,950
- Reserves months
- —
- Total cash needed
- —
Loan-product check · same deal, 3 products live
Conventional
25% down · 7.5% · 30yr
- Down + closing
- —
- Monthly P&I
- —
- Monthly cashflow
- —
- DSCR
- —
- Eligible?
- —
Personal DTI + credit; lowest rate.
DSCR
20% down · 8.5% · 30yr
- Down + closing
- —
- Monthly P&I
- —
- Monthly cashflow
- —
- DSCR
- —
- Eligible?
- —
No personal income docs; deal must DSCR.
Hard money
10% down · 12.0% · 12mo
- Down + closing
- —
- Monthly P&I
- —
- Monthly cashflow
- —
- DSCR
- —
- Eligible?
- —
Short-term bridge; refi at stabilization.
Rent comps 9 comps
| Address | Beds | Baths | Sqft | Rent | $/sqft | DOM | Units | Dist |
|---|---|---|---|---|---|---|---|---|
| 7046 Greenleaf Ave Cleveland, OH | 3.0 | 1.0 | 1200 | $1,950 | $1.62 | 43d | 1 | 0.44mi |
| 7072 Oakwood Rd Cleveland, OH | 3.0 | 1.0 | 1053 | $1,800 | $1.71 | 1d | 1 | 0.45mi |
| 7048 Oakwood Rd Cleveland, OH | 3.0 | 1.0 | 1053 | $1,900 | $1.80 | 10d | 1 | 0.49mi |
| 6987 Greenleaf Ave Cleveland, OH | 4.0 | 1.0 | 1250 | $2,100 | $1.68 | 1d | 1 | 0.54mi |
| 7085 W 130th St Cleveland, OH | 2.0 | 2.0 | 1150 | $1,440 | $1.25 | 1d | 7 | 0.62mi |
| 6771 Greenleaf Ave Unit 1496046P Parma Heights, OH | 3.0 | 2.0 | 1323 | $4,874 | $3.68 | 1d | 1 | 0.95mi |
| 6558 Lawnwood Ave Cleveland, OH | 3.0 | 2.0 | 1331 | $2,100 | $1.58 | 1d | 1 | 1.41mi |
| 6536 Lawnwood Ave Unit 1496105P Parma Heights, OH | 3.0 | 2.0 | 1087 | $6,186 | $5.69 | 1d | 1 | 1.45mi |
| 6500 Beverly Dr Cleveland, OH | 3.0 | 1.5 | 1341 | $2,300 | $1.72 | 23d | 1 | 1.46mi |
Listing history 2 events
-
2026-05-18status Pending 1286-char remark
-
2026-05-14$165,000 Active 1286-char remark
ⓘ Source: listings_history table (triggers on properties + properties_extension) + one-shot
backfill from property_details.listing_events for pre-trigger history.
Tax reassessment forecast OH · Partial reset (capped growth)
- Current annual tax
- $2,726 · $227/mo
- Projected year-2 tax
- $2,726 · $227/mo
- Expected delta
- $0/yr ($0/mo · 0.0%)
ⓘ Screening estimate from a state-policy table — verify with the county assessor before closing.
Climate risk First Street
- Flood 1/10 Low FEMA zone X (unshaded) · 0% chance over 30 yrs
- Wildfire 1/10 Low
- Heat 3/10 Moderate 7 d/yr ≥95°F today · 17 d/yr by 30 yrs out
- Wind 1/10 Low
- Air quality 2/10 Low 1 unhealthy d/yr today · 3 by 30 yrs out
Nearby sold comps map
Loading sold comps map…
Walkable amenities ~0.75 mi
Loading nearby amenities…
Taxation est. · year 1
- Rental income
- $21,606
- − Mortgage interest
- −$9,243
- − Property taxes
- −$2,726
- − Insurance
- −$825
- − Repairs & maintenance
- −$1,728
- − Management
- −$1,728
- − Depreciation
- −$4,800
- Taxable income
- $555
- Est. tax owed @ 24.0%
- −$133
- After-tax cash flow
- $3,001/yr
For passive investors: Depreciation is non-cash, so a rental often shows a tax loss while cash-flowing — sheltering income. Rental losses are passive: they offset passive income freely, and up to $25,000/yr can offset ordinary (W-2) income if you actively participate and your MAGI is under $100k (phasing out to $0 by $150k); unused losses carry forward. On sale, claimed depreciation is recaptured at up to 25%, and gains may owe capital-gains tax (a 1031 exchange can defer both). Figures are a year-1 estimate at your 24.0% rate — not tax advice; consult a CPA.
Schools (NCES district)
- District
- Parma City
- NCES district ID
- 3904463
- Math proficiency
- 43% ▼ -18.00%
- Reading proficiency
- 52% ▼ -10.00%
- Median HH income
- $50,371
- Composite
- 40.72/100
- National rank
- #3662
- State rank
- #469 of 656 in OH
Livability — Parma
- Score
- 82/100
- State rank
- #84
- US rank
- #1232
Category grades
Schools grade is shown separately in the Schools card above.
Census & demographics
- Census place
- Parma, OH
- County
- Cuyahoga County · 1,090,369 people
- City population
- 66,574
- Metro
- Cleveland-Elyria, OH
- Population (ZIP)
- 49,679
- Household income
- $69,655
- Rent vs Own
- Severe rent burden
- 1758.0
Population outlook (Cuyahoga County) Hauer SSP2
- Today (2025)
- 1,244,621 people
- By 2030
- 1,230,093 · -1.2%
- By 2040
- 1,189,108 · -4.5%
- By 2050
- 1,145,706 · -7.9%
- By 2075
- 1,076,557 · -13.5%
- By 2100
- 978,987 · -21.3%
Race, ethnicity, and origin ACS 2023
- Neighborhood character
- Predominantly White (78%)
- Race & ethnicity
- White 78% Black 8% Hispanic / Latino 6% Two or more races 6% Asian 4%
- Hispanic origin (detail)
- Mexican 2% Puerto Rican 3%
- Common ancestry
- Romanian 13% Lithuanian 2% Subsaharan African 2%
- Foreign-born
- 10% · Canada, India
- Languages at home
- 85% English-only · Other Indo-European 5% Spanish 3% Russian/Polish/Slavic 2%
Political lean MEDSL · Cuyahoga
- 2024 margin
- Solid D (+31.5) · D 65.4% · R 33.9%
- 2008→2024 swing
- -7.4pp toward R · 2008: 38.9pp · 2024: 31.5pp
- All cycles
- 2024: D+31.5 2020: D+34.1 2016: D+35.0 2012: D+38.7 2008: D+38.9
Not yet ingested
- Civics
- —
Market trends
- HPI YoY
- ▼ -231.10%
- Current HPI
- 188.8415
- Rent YoY
- ▲ 2.69%
- Metro
- Cleveland-Elyria, OH
- State GDP YoY
- ▲ 1.98%
- F500 in state
- 48
Industry mix (Fortune 500 HQ in OH)
| Industry | F500 HQs | Revenue |
|---|---|---|
| Insurance | 3 | $145B |
|
||
| Industrial Machinery | 3 | $49B |
|
||
| Financial Services | 3 | $24B |
|
||
| Consumer Goods | 2 | $93B |
|
||
| Aerospace / Defense | 2 | $47B |
|
||
| Utilities | 2 | $33B |
|
||
Price history
+6.1% since first listed3 events — show timeline
- 2026-06-05 Sold (MLS) $175,000 MLSNOW
- 2026-05-18 Pending — MLSNOW
- 2026-05-14 Listed $165,000 MLSNOW
Property tax history
+3.8%/yrLatest (2025): $2,726 · -5.7% YoY. Source: county tax records.
Cash-flow waterfall
monthlySold comps — $/sqft
last 12 mo · ≤1 miLoading sold comps…