5034 Draco Cir · Orangetree, FL
Flood risk 1/10 · Minimal
- FEMA flood zone
- AH
- Chance of flooding over 30 yrs
- 0.0%
- Est. flood insurance / yr
- $1,142 – $2,507
Fire risk 1/10 · Minimal
- Est. fire insurance / yr
- $947 – $1,759
Heat risk 9/10 · Severe
- Hot days now (above 111°F)
- 5 days/yr
- Hot days in 30 yrs
- 20 days/yr
Wind risk 10/10 · Severe
- Chance of severe wind over 30 yrs
- 99.0%
Air-quality risk 2/10 · Minimal
- Unhealthy air days now
- 0 days/yr
- Unhealthy air days in 30 yrs
- 1 days/yr
Risk factors via First Street. Map © Google.
Why this score? — see what drove the C- grade
The composite is a weighted blend of 9 inputs, each scored 0–100. Each bar is that input's sub-score; the figure is the points it added to the 100-point composite (weight × sub-score).
- Cash flow +19.3/30.0
- ARV discount +7.5/15.0
- DSCR +6.1/10.0
- 1% rule +5.1/10.0
- Schools +5.0/10.0
- Livability +3.2/5.0
- Condition / age +2.5/5.0
- Rent growth +2.1/5.0
- Appreciation +0.0/10.0
$345,525
🖨 Deal sheet 📄 Offer letter ✓ Due diligence
Listing remarks
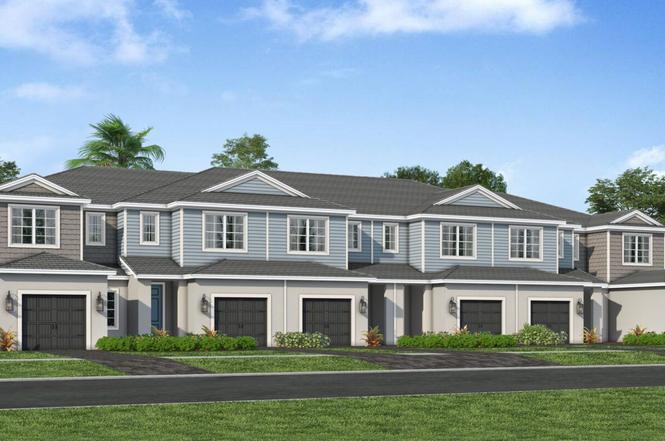
Pre-Construction - WInslow at SkySail - Homesite 2904 Come home to the Winslow- a new townhome design by award winning Neal Communities. This 2 story townhome includes 3 bedrooms, 2.1 baths and an attached 1 car garage. As you enter the front door you are greeted by the large living room with a well appointed kitchen and dining space leading out to the covered lanai. A powder room and access to the garage are also on the first floor. The bedrooms are on the upper level with two full baths. Images are not an exact representation of this feature home.
Key facts
- New townhome design
- Large living room
- Covered lanai
Tags
Property features AI
Finance
- Financial info: List price $345,525
Exterior
- Parking: 1 garage space (1 total parking space)
- Home design: Single-family property (Winslow plan)
- Exterior features: Living area approximately 1555; Address: 5034 Draco Cir, Naples, FL 34120
Interior
- Bedrooms: 3 bedrooms
- Bathrooms: 2 full bathrooms and 1 half bathroom
- Interior features: Spec home (Winslow plan); Active listing
Neighborhood map
What this means for you Summary
Snapshot
- This is a 3-bed/2.0-bath townhouse listed at $346k.
Deal economics
- At list price, monthly cash flow is $228 ($3k/yr) — positive.
- The deal already cash-flows at list — no discount required.
- Meets the 1% rule at list price ($4k rent vs $346k).
- Recommended offer: $304k (12.0% below list) — sets the bar for market timing.
Location & tenants
- Location reads 65/100 on livability (#636 in FL) — a middle-class / working-renter tenant base. Strengths: crime A+, employment A+, housing A+; Watch: health & safety D, schools D-, amenities F.
- Collier (suburban): math 60% / reading 56% proficiency, ranked #16 of 73 in FL (top 22%) — acceptable for families but not a draw, mixed tenant base, ~2y average lease.
- Market conditions: Rents soft (-1.6%/yr); 1124 active listings in the ZIP; 4 comparable units currently listed for rent nearby; rentals at typical pace (median 24d on market — plan ~3-4 weeks tenant-placement turnaround); solid renter incomes; 3,520 units permitted in Collier County in 2024 (959 in 5+ unit buildings).
- This rent runs 45% of the median local income ($94k/yr) — at the standard rent-burdened threshold; future hikes will face affordability resistance.
Forward outlook
- Local home prices are declining (-3.0%/yr); year-one equity from $2k of loan paydown is wiped out by about $10k of value loss. Plan a longer hold.
- Collier County population projected at +30% by 2050 — long-run rental-demand tailwind backs the buy-and-hold thesis.
Negotiation context
- It's been on market 130 days — a 12% lower offer ($304k) is reasonable based on typical stale-listing flexibility.
Risks & watch-outs
- Watch-outs: flood insurance adds $152/mo.
- Climate carrying-cost: in FEMA flood zone AH (mandatory federal flood insurance); severe wind risk, 99% chance of damaging wind over 30y; extreme-heat days projected 5→20/yr by 2055 (HVAC capex compounding) — expect insurance premiums to compound above CPI over the hold.
Questions for the listing agent
- It's been on market 130 days. Have you received any prior offers? Is the seller open to a 12% concession, seller financing, or rate buy-down credit?
- What's the actual annual flood-insurance premium (NFIP or private), and is the property in a SFHA with mandatory coverage?
- Why hasn't it sold? Are there any deal-killer items the seller is aware of (foundation, flood, title, zoning, code violations)?
- Is there a deadline driving the sale (1031 exchange, divorce, estate, relocation)? That informs how much negotiation room exists.
- Schools are D-rated, which usually means shorter tenancies and higher turnover. Who's the typical renter profile here, and what's been the actual vacancy rate?
- What's the average days-on-market for RENTAL listings here right now (not sales)? A rising rental-DOM trend means longer vacancies and softer asking-rent achievability than the comps imply.
- What's the recent tenant-quality profile in this submarket — average credit score on applications, eviction rate, late-payment / NSF rate, and stable-employment percentage? A property-management company in the area should have these aggregated.
- How much new for-sale + rental construction is in the pipeline within 1–3 miles? Heavy new supply typically softens prices + rents 12–24 months out; constrained supply supports both.
Investment metrics
- 1% rule
- 1.01% ✓
- Cap rate
- 7.61%
- Cash-on-cash
- 4.71%
- DSCR
- 1.21
- GRM
- 8.2
CMA / ARV
No comps found within radius.
Projected returns pro-forma
-3.0% appreciation · 0.0% rent growth · sell at horizon
- IRR
- -15.4%
- Equity multiple
- 0.47×
- Total profit
- $-51,599
- Equity at exit
- $51,519
- IRR
- -13.6%
- Equity multiple
- 0.32×
- Total profit
- $-65,330
- Equity at exit
- $29,875
Cash invested: $96,747 (down + closing). Projections, not guarantees.
Landlord ↔ Tenant lean methodology
- Overall (STATE)
- 87 Strongly Landlord-Friendly
- State Florida
- 87 Strongly Landlord-Friendly · R+3
- County
- — inherits STATE
- City
- — inherits STATE
ZIP-level market 34120
- Rents YoY
- -1.6%
- Active inventory
- 1124
- Price-to-rent
- 8.2×
Monthly cashflow live
- Estimated rent
- $3,503 medium interval (Pro) →
- Mortgage (P&I)
- −$1,812
- Tax est. 1.5%
- −$432 /mo · $5,183/yr
- Insurance
- −$144
- Flood insurance flood zone
- −$152 /mo · $1,824/yr
- HOA
- −$0
- Vacancy / Maint / Mgmt
- −$736
- Net cashflow
- $228
Break-even live
UW: 25.0% down · 7.5% · 30yr · 1.5% tax · 5.0% vac · 8.0% maint · 8.0% mgmt
Financing live
Cash to close
- Down payment
- $86,381
- Closing costs
- $10,366
- Reserves months
- —
- Total cash needed
- —
Loan-product check · same deal, 3 products live
Conventional
25% down · 7.5% · 30yr
- Down + closing
- —
- Monthly P&I
- —
- Monthly cashflow
- —
- DSCR
- —
- Eligible?
- —
Personal DTI + credit; lowest rate.
DSCR
20% down · 8.5% · 30yr
- Down + closing
- —
- Monthly P&I
- —
- Monthly cashflow
- —
- DSCR
- —
- Eligible?
- —
No personal income docs; deal must DSCR.
Hard money
10% down · 12.0% · 12mo
- Down + closing
- —
- Monthly P&I
- —
- Monthly cashflow
- —
- DSCR
- —
- Eligible?
- —
Short-term bridge; refi at stabilization.
Rent comps 4 comps
| Address | Beds | Baths | Sqft | Rent | $/sqft | DOM | Units | Dist |
|---|---|---|---|---|---|---|---|---|
| 4003 Pegasus Way Naples, FL | 3.0 | 2.5 | 1966 | $3,300 | $1.68 | 23d | 1 | 0.32mi |
| 4191 Pegasus Way Naples, FL | 4.0 | 3.5 | 2014 | $4,000 | $1.99 | 21d | 1 | 0.48mi |
| 3660 39th Ave NE Naples, FL | 3.0 | 2.0 | 1389 | $2,900 | $2.09 | 21d | 1 | 0.90mi |
| 4383 Randall Blvd Naples, FL | 3.0 | 2.0 | 1735 | $3,600 | $2.07 | 23d | 1 | 1.30mi |
Listing history 12 events
-
2026-06-18days on market $345,525 Active 130 DOM
-
2026-06-17days on market $345,525 Active 129 DOM
-
2026-06-16days on market $345,525 Active 128 DOM
-
2026-06-15days on market $345,525 Active 127 DOM
-
2026-06-10days on market $345,525 Active 122 DOM
-
2026-06-09days on market $345,525 Active 121 DOM
-
2026-06-08days on market $345,525 Active 120 DOM
-
2026-06-07days on market $345,525 Active 119 DOM
-
2026-06-02days on market $345,525 Active 114 DOM
-
2026-06-01days on market $345,525 Active 113 DOM
-
2026-05-31days on market $345,525 Active 112 DOM
-
2026-05-30days on market $345,525 Active 111 DOM
ⓘ Source: listings_history table (triggers on properties + properties_extension) + one-shot
backfill from property_details.listing_events for pre-trigger history.
Climate risk First Street
- Flood 1/10 Low FEMA zone AH · 0% chance over 30 yrs
- Wildfire 1/10 Low
- Heat 9/10 Extreme 5 d/yr ≥111°F today · 20 d/yr by 30 yrs out
- Wind 10/10 Extreme 99% chance of damaging wind over 30 yrs
- Air quality 2/10 Low 0 unhealthy d/yr today · 1 by 30 yrs out
Nearby sold comps map
Loading sold comps map…
Walkable amenities ~0.75 mi
Loading nearby amenities…
Taxation est. · year 1
- Rental income
- $42,042
- − Mortgage interest
- −$19,355
- − Property taxes
- −$5,183
- − Insurance
- −$3,552
- − Repairs & maintenance
- −$3,363
- − Management
- −$3,363
- − Depreciation
- −$10,052
- Taxable loss
- −$2,827
- Est. tax savings @ 24.0%
- +$678
- After-tax cash flow
- $3,413/yr
For passive investors: Depreciation is non-cash, so a rental often shows a tax loss while cash-flowing — sheltering income. Rental losses are passive: they offset passive income freely, and up to $25,000/yr can offset ordinary (W-2) income if you actively participate and your MAGI is under $100k (phasing out to $0 by $150k); unused losses carry forward. On sale, claimed depreciation is recaptured at up to 25%, and gains may owe capital-gains tax (a 1031 exchange can defer both). Figures are a year-1 estimate at your 24.0% rate — not tax advice; consult a CPA.
Schools (NCES district)
- District
- Collier
- NCES district ID
- 1200330
- Math proficiency
- 60% ▼ -4.00%
- Reading proficiency
- 56% ▼ -2.00%
- Median HH income
- $58,275
- Composite
- 50.23/100
- National rank
- #1892
- State rank
- #16 of 73 in FL
Livability — Orangetree
- Score
- 65/100
- State rank
- #636
- US rank
- #12453
Category grades
Schools grade is shown separately in the Schools card above.
Census & demographics
- County
- Collier County · 396,295 people
- Metro
- Naples-Marco Island, FL
- Population (ZIP)
- 42,345
- Household income
- $93,861
- Rent vs Own
- Severe rent burden
- 409.0
Population outlook (Collier County) Hauer SSP2
- Today (2025)
- 420,858 people
- By 2030
- 450,054 · +6.9%
- By 2040
- 502,232 · +19.3%
- By 2050
- 544,932 · +29.5%
- By 2075
- 627,203 · +49.0%
- By 2100
- 659,015 · +56.6%
Race, ethnicity, and origin ACS 2023
- Neighborhood character
- Diverse neighborhood (Simpson 0.58)
- Race & ethnicity
- White 56% Hispanic / Latino 32% Two or more races 23% Black 8% Asian 2%
- Hispanic origin (detail)
- Mexican 8% Puerto Rican 2% Cuban 13%
- Common ancestry
- Hispanic 4% Romanian 3% Italian 2%
- Foreign-born
- 28% · Canada, Jamaica, China
- Languages at home
- 62% English-only · Spanish 28% French/Haitian/Cajun 5% Other Indo-European 3%
Political lean MEDSL · Collier
- 2024 margin
- Solid R (+33.1) · D 33.1% · R 66.2%
- 2008→2024 swing
- -10.6pp toward R · 2008: -22.5pp · 2024: -33.1pp
- All cycles
- 2024: R+33.1 2020: R+24.7 2016: R+26.0 2012: R+30.1 2008: R+22.5
Not yet ingested
- Civics
- —
Market trends
- HPI YoY
- ▼ -223.18%
- Current HPI
- 316.2474
- Rent YoY
- ▼ -1.65%
- Metro
- Naples-Marco Island, FL
- State GDP YoY
- ▲ 3.28%
- F500 in state
- 36
Industry mix (Fortune 500 HQ in FL)
| Industry | F500 HQs | Revenue |
|---|---|---|
| Industrial Technology | 2 | $29B |
|
||
| Insurance | 2 | $17B |
|
||
| Retail | 1 | $60B |
|
||
| Technology Distribution | 1 | $58B |
|
||
| Homebuilding | 1 | $35B |
|
||
| Technology Manufacturing | 1 | $35B |
|
||
Cash-flow waterfall
monthlySold comps — $/sqft
last 12 mo · ≤1 miLoading sold comps…