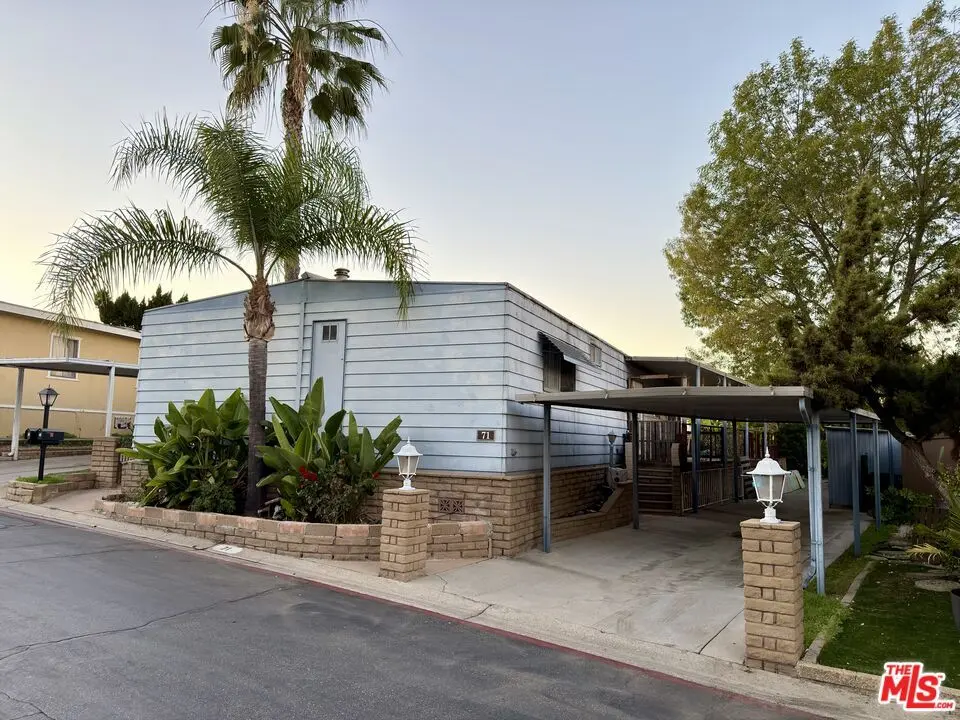
17350 Temple Ave #71 · South San Jose Hills, CA
Flood risk 1/10 · Minimal
- FEMA flood zone
- X (unshaded)
- Chance of flooding over 30 yrs
- 0.0%
- Est. flood insurance / yr
- $507 – $1,088
Fire risk 1/10 · Minimal
- Est. fire insurance / yr
- $659 – $1,223
Heat risk 6/10 · Moderate
- Hot days now (above 99°F)
- 7 days/yr
- Hot days in 30 yrs
- 19 days/yr
Wind risk 1/10 · Minimal
- Chance of severe wind over 30 yrs
- —
Air-quality risk 7/10 · Major
- Unhealthy air days now
- 13 days/yr
- Unhealthy air days in 30 yrs
- 14 days/yr
Risk factors via First Street. Map © Google.
Why this score? — see what drove the B- grade
The composite is a weighted blend of 9 inputs, each scored 0–100. Each bar is that input's sub-score; the figure is the points it added to the 100-point composite (weight × sub-score).
- Cash flow +30.0/30.0
- 1% rule +10.0/10.0
- DSCR +10.0/10.0
- Rent growth +5.0/5.0
- Schools +4.5/10.0
- Livability +3.2/5.0
- Condition / age +2.5/5.0
- ARV discount +0.0/15.0
- Appreciation +0.0/10.0
$230,000
🖨 Deal sheet 📄 Offer letter ✓ Due diligence
Listing remarks MLS
Spacious and rare 4-bedroom, 2-bath double-wide located in the highly desirable Covina Hills Mobile Home Community. Very few homes in the park offer four true bedrooms, making this a standout opportunity. One bedroom has a private exterior entrance, perfect for guests, extended family, or a home office setup. Enjoy peaceful views of the San Gabriel Mountains from the back patio area. The home features central A/C and heating, washer and dryer included in a dedicated laundry/pantry room with built-in cabinetry, plus two large storage sheds for extra space. Covina Hills offers resort-style amenities including two heated pools, infant pool, spa, sauna, fitness center, basketball court, and two clubhouses available to reserve. Motivated seller. Buyer to verify all information, space rent, park rules, and amenities to their own satisfaction.
Key facts
- Heated pools
- Fitness center
- Large storage sheds
Tags
Neighborhood map
What this means for you Summary
Snapshot
- This is a 4-bed/2.0-bath manufactured listed at $230k.
Deal economics
- At list price, monthly cash flow is $1k ($14k/yr) — positive.
- The deal already cash-flows at list — no discount required.
- Meets the 1% rule at list price ($3k rent vs $230k).
- Recommended offer: $202k (12.0% below list) — sets the bar for market timing.
- Cap rate 12.3% vs local median 3.2% in South San Jose Hills — top-decile yield for the area; either an underpriced asset or a hidden risk that comps aren't pricing in. Stress-test before assuming the spread holds.
Location & tenants
- Location reads 63/100 on livability (#449 in CA) — a middle-class / working-renter tenant base. Strengths: commute A+, housing A, employment A-; Watch: crime F, amenities F, cost of living F.
- Rowland Unified (suburban): math 40% / reading 62% proficiency, ranked #134 of 517 in CA (top 26%) — acceptable for families but not a draw, mixed tenant base, ~2y average lease.
- Market conditions: Rents rising fast (+13.2%/yr); 70 active listings in the ZIP; 14 comparable units currently listed for rent nearby; rentals at typical pace (median 18d on market — plan ~3-4 weeks tenant-placement turnaround); solid renter incomes; 19,697 units permitted in Los Angeles County in 2024 (9,426 in 5+ unit buildings).
- This rent runs 45% of the median local income ($94k/yr) — at the standard rent-burdened threshold; future hikes will face affordability resistance.
Forward outlook
- Local home prices are declining (-3.0%/yr); year-one equity from $2k of loan paydown is wiped out by about $7k of value loss. Plan a longer hold.
- Los Angeles County population projected at +9% by 2050 — modest demand growth; plan on rents tracking national, not racing it.
- At projected returns (-3.0% appreciation + 8.0% rent growth), your $64k cash investment doubles in ~5 years — after that, you're playing with house money.
Negotiation context
- It's been on market 182 days — a 12% lower offer ($202k) is reasonable based on typical stale-listing flexibility.
- 10 sale attempts since 23y ago; this cycle's ask has dropped $20k (8%) from the opening price — seller is motivated, your offer sets the floor, not the list.
- Current owner paid $95k; list at $230k implies a 142% gain — meaningful room to come down on a strong offer.
Risks & watch-outs
- Climate carrying-cost: extreme-heat days projected 7→19/yr by 2055 (HVAC capex compounding) — expect insurance premiums to compound above CPI over the hold.
Questions for the listing agent
- It's been on market 182 days. Have you received any prior offers? Is the seller open to a 12% concession, seller financing, or rate buy-down credit?
- Built in 1972 — when were the roof, HVAC, electrical panel, plumbing, and water heater last replaced?
- Why hasn't it sold? Are there any deal-killer items the seller is aware of (foundation, flood, title, zoning, code violations)?
- Is there a deadline driving the sale (1031 exchange, divorce, estate, relocation)? That informs how much negotiation room exists.
- Schools are B-rated — typically a magnet for longer-tenancy family renters. What's the average tenant stay here, and is there a school-zone premium baked into asking?
- Crime grade is F in this area — have there been break-ins, vandalism, or insurance claims at this property in the last 3 years? What carrier currently insures it and at what premium?
- What's the average days-on-market for RENTAL listings here right now (not sales)? A rising rental-DOM trend means longer vacancies and softer asking-rent achievability than the comps imply.
- What's the recent tenant-quality profile in this submarket — average credit score on applications, eviction rate, late-payment / NSF rate, and stable-employment percentage? A property-management company in the area should have these aggregated.
- How much new for-sale + rental construction is in the pipeline within 1–3 miles? Heavy new supply typically softens prices + rents 12–24 months out; constrained supply supports both.
Investment metrics
- 1% rule
- 1.51% ✓
- Cap rate
- 12.30%
- Cash-on-cash
- 21.46%
- DSCR
- 1.95
- GRM
- 5.5
CMA / ARV
- ARV (median comp)
- $161,000
- List price
- $230,000
- Delta
- 42.86%
- Verdict
- OVERPRICED
- Comps
- 11 within 1.0 mi
Show comp detail 12 sales within ~0.75 mi
| Address | Dist | Beds/Ba | Sqft | Sold | Price | $/sf | Match |
|---|---|---|---|---|---|---|---|
| 17350 Temple #288 | 0.00mi | 3/2.0 (-1) | 1,440 (0%) | 3mo | $145,000 | $101 | 92 |
| 17350 Temple Ave #383 | 0.00mi | 3/2.0 (-1) | 1,431 (-1%) | 8mo | $187,000 | $131 | 87 |
| 17350 Temple Ave #214 | 0.00mi | 3/2.0 (-1) | 1,456 (+1%) | 13mo | $219,000 | $150 | 82 |
| 17350 Temple 237 | 0.00mi | 3/2.0 (-1) | 1,320 (-8%) | 2mo | $189,000 | $143 | 79 |
| 17350 E Temple Ave #84 | 0.00mi | 3/2.0 (-1) | 1,344 (-7%) | 6mo | $180,000 | $134 | 79 |
| 17350 Temple Ave #484 | 0.00mi | 3/2.0 (-1) | 1,344 (-7%) | 12mo | $276,000 | $205 | 74 |
| 17350 Temple Ave #397 | 0.00mi | 3/2.0 (-1) | 1,344 (-7%) | 12mo | $140,000 | $104 | 74 |
| 17350 Temple #411 | 0.00mi | 3/2.0 (-1) | 1,632 (+13%) | 2mo | $295,000 | $181 | 71 |
| 17350 E Temple Ave #451 | 0.00mi | 3/2.0 (-1) | 1,566 (+9%) | 11mo | $274,000 | $175 | 71 |
| 17350 Temple Ave #320 | 0.25mi | 3/2.0 (-1) | 1,500 (+4%) | 7mo | $126,500 | $84 | 71 |
| 17350 E Temple Ave #405 | 0.00mi | 3/2.0 (-1) | 1,344 (-7%) | 18mo | $170,000 | $126 | 69 |
| 17350 Temple Ave #434 | 0.00mi | 3/2.0 (-1) | 1,344 (-7%) | 18mo | $219,000 | $163 | 68 |
Match score weights: distance 35% · size 25% · config 20% · recency 20%. Top-matched comps best support the ARV.
Projected returns pro-forma
-3.0% appreciation · 8.0% rent growth · sell at horizon
- IRR
- 19.6%
- Equity multiple
- 1.85×
- Total profit
- $54,469
- Equity at exit
- $34,294
- IRR
- 31.1%
- Equity multiple
- 4.50×
- Total profit
- $225,551
- Equity at exit
- $19,886
Cash invested: $64,400 (down + closing). Projections, not guarantees.
Landlord ↔ Tenant lean methodology
- Overall (STATE)
- 18 Strongly Tenant-Friendly
- State California
- 18 Strongly Tenant-Friendly · D+13
- County
- — inherits STATE
- City
- — inherits STATE
ZIP-level market 91744
- Rents YoY
- 13.2%
- Active inventory
- 70
- Price-to-rent
- 5.5×
Monthly cashflow live
- Estimated rent
- $3,470 high interval (Pro) →
- Mortgage (P&I)
- −$1,206
- Tax est. 1.5%
- −$288 /mo · $3,450/yr
- Insurance
- −$96
- HOA
- −$0
- Vacancy / Maint / Mgmt
- −$729
- Net cashflow
- $1,152
Break-even live
UW: 25.0% down · 7.5% · 30yr · 1.5% tax · 5.0% vac · 8.0% maint · 8.0% mgmt
Financing live
Cash to close
- Down payment
- $57,500
- Closing costs
- $6,900
- Reserves months
- —
- Total cash needed
- —
Loan-product check · same deal, 3 products live
Conventional
25% down · 7.5% · 30yr
- Down + closing
- —
- Monthly P&I
- —
- Monthly cashflow
- —
- DSCR
- —
- Eligible?
- —
Personal DTI + credit; lowest rate.
DSCR
20% down · 8.5% · 30yr
- Down + closing
- —
- Monthly P&I
- —
- Monthly cashflow
- —
- DSCR
- —
- Eligible?
- —
No personal income docs; deal must DSCR.
Hard money
10% down · 12.0% · 12mo
- Down + closing
- —
- Monthly P&I
- —
- Monthly cashflow
- —
- DSCR
- —
- Eligible?
- —
Short-term bridge; refi at stabilization.
Rent comps 14 comps
| Address | Beds | Baths | Sqft | Rent | $/sqft | DOM | Units | Dist |
|---|---|---|---|---|---|---|---|---|
| 2600 S Azusa Ave West Covina, CA | 1.0–3.0 | 1.0–2.0 | 934 | $3,214 | $3.44 | 5d | 12 | 0.44mi |
| 2442 S Nancy St Unit 1 West Covina, CA | 3.0 | 1.5 | 1165 | $3,345 | $2.87 | 43d | 1 | 0.58mi |
| 2100 S Lark Ellen Ave West Covina, CA | 1.0–3.0 | 1.0–2.0 | 967 | $3,200 | $3.31 | 5d | 8 | 0.98mi |
| 2452 E Brenda St West Covina, CA | 4.0 | 2.0 | 1460 | $4,095 | $2.80 | 1d | 1 | 1.00mi |
| 3424 S Rachel Ave West Covina, CA | 4.0 | 2.0 | 1445 | $3,500 | $2.42 | 7d | 1 | 1.02mi |
| 2013 S Brentwood Dr West Covina, CA | 4.0 | 2.0 | 1568 | $3,650 | $2.33 | 1d | 1 | 1.10mi |
| 2316 Cravath Ct West Covina, CA | 3.0 | 2.0 | 1335 | $3,050 | $2.28 | 17d | 1 | 1.13mi |
| 2622 E Marlena St West Covina, CA | 4.0 | 2.0 | 1579 | $3,650 | $2.31 | 43d | 1 | 1.19mi |
| 856 Francesca Dr Walnut, CA | 3.0 | 3.0 | 1594 | $3,900 | $2.45 | 43d | 1 | 1.31mi |
| 1366 Oahu St West Covina, CA | 3.0 | 3.0 | 1596 | $3,475 | $2.18 | 43d | 1 | 1.35mi |
| 1511 Wailea St West Covina, CA | 3.0 | 2.5 | 1509 | $3,400 | $2.25 | 24d | 1 | 1.36mi |
| 684 Panorama Ln La Puente, CA | 3.0 | 3.5 | 1683 | $3,600 | $2.14 | 17d | 1 | 1.38mi |
| 684 Panorama Ln La Puente, CA | 3.0 | 3.5 | 1683 | $3,600 | $2.14 | 20d | 1 | 1.38mi |
| 1818 Bauer Dr West Covina, CA | 3.0 | 2.0 | 1125 | $3,000 | $2.67 | 6d | 1 | 1.46mi |
Listing history 40 events
-
2026-06-18days on market $230,000 Active 182 DOM
-
2026-06-17days on market $230,000 Active 181 DOM
-
2026-06-16days on market $230,000 Active 180 DOM
-
2026-06-15days on market $230,000 Active 179 DOM
-
2026-06-13days on market $230,000 Active 177 DOM
-
2026-06-13days on market $230,000 Active 176 DOM
-
2026-06-09days on market $230,000 Active 173 DOM
-
2026-06-08days on market $230,000 Active 172 DOM
-
2026-06-07days on market $230,000 Active 171 DOM
-
2026-06-04days on market $230,000 Active 168 DOM
-
2026-06-03days on market $230,000 Active 167 DOM
-
2026-06-02days on market $230,000 Active 166 DOM
-
2026-06-01days on market $230,000 Active 165 DOM
-
2026-05-31days on market $230,000 Active 164 DOM
-
2026-01-26price $230,000 848-char remark
Show marketing remark (848 chars)
Spacious and rare 4-bedroom, 2-bath double-wide located in the highly desirable Covina Hills Mobile Home Community. Very few homes in the park offer four true bedrooms, making this a standout opportunity. One bedroom has a private exterior entrance, perfect for guests, extended family, or a home office setup. Enjoy peaceful views of the San Gabriel Mountains from the back patio area. The home features central A/C and heating, washer and dryer included in a dedicated laundry/pantry room with built-in cabinetry, plus two large storage sheds for extra space. Covina Hills offers resort-style amenities including two heated pools, infant pool, spa, sauna, fitness center, basketball court, and two clubhouses available to reserve. Motivated seller. Buyer to verify all information, space rent, park rules, and amenities to their own satisfaction.
-
2025-12-18$250,000 Active 848-char remark
Show marketing remark (848 chars)
Spacious and rare 4-bedroom, 2-bath double-wide located in the highly desirable Covina Hills Mobile Home Community. Very few homes in the park offer four true bedrooms, making this a standout opportunity. One bedroom has a private exterior entrance, perfect for guests, extended family, or a home office setup. Enjoy peaceful views of the San Gabriel Mountains from the back patio area. The home features central A/C and heating, washer and dryer included in a dedicated laundry/pantry room with built-in cabinetry, plus two large storage sheds for extra space. Covina Hills offers resort-style amenities including two heated pools, infant pool, spa, sauna, fitness center, basketball court, and two clubhouses available to reserve. Motivated seller. Buyer to verify all information, space rent, park rules, and amenities to their own satisfaction.
-
2019-12-23soldstatus $95,000 Closed Sale 429-char remark
Show marketing remark (429 chars)
You can bring the family to this unique Mobil Park this unit has a beautiful back yard that overlooks the whole valley, great for those family BBQs. Come take a look at this 4-bedroom 2-bath. It has a newer Air Conditioner and Water Heater. The park has a variety of activities for the whole family with two swimming pools, basketball courts, tetherball, pool tables, several table games, yoga, Zumba classes. This is a must-see!
-
2019-12-09status Pending Sale 429-char remark
Show marketing remark (429 chars)
You can bring the family to this unique Mobil Park this unit has a beautiful back yard that overlooks the whole valley, great for those family BBQs. Come take a look at this 4-bedroom 2-bath. It has a newer Air Conditioner and Water Heater. The park has a variety of activities for the whole family with two swimming pools, basketball courts, tetherball, pool tables, several table games, yoga, Zumba classes. This is a must-see!
-
2019-10-14$97,000 Active 429-char remark
Show marketing remark (429 chars)
You can bring the family to this unique Mobil Park this unit has a beautiful back yard that overlooks the whole valley, great for those family BBQs. Come take a look at this 4-bedroom 2-bath. It has a newer Air Conditioner and Water Heater. The park has a variety of activities for the whole family with two swimming pools, basketball courts, tetherball, pool tables, several table games, yoga, Zumba classes. This is a must-see!
-
2013-07-31soldstatus $36,000 Closed
-
2013-07-12status Pending
-
2013-06-30soldstatus $36,000 Closed
-
2013-05-20status Pending
-
2012-10-04$39,900 Active
-
2012-09-13historical
-
2012-03-14$39,000 Active
-
2009-11-01price $75,900 Expired
-
2008-11-12historical
-
2008-11-05$68,900
-
2008-08-07historical
-
2008-03-06$74,900
-
2007-11-01historical
-
2007-09-29price $79,900
-
2007-05-17historical
-
2007-04-21$85,000
-
2006-11-16$85,000
-
2004-09-16soldstatus $52,900
-
2004-07-01$52,900
-
2003-05-20soldstatus $43,000
-
2003-03-24$48,000
ⓘ Source: listings_history table (triggers on properties + properties_extension) + one-shot
backfill from property_details.listing_events for pre-trigger history.
Climate risk First Street
- Flood 1/10 Low FEMA zone X (unshaded) · 0% chance over 30 yrs
- Wildfire 1/10 Low
- Heat 6/10 Major 7 d/yr ≥99°F today · 19 d/yr by 30 yrs out
- Wind 1/10 Low
- Air quality 7/10 Severe 13 unhealthy d/yr today · 14 by 30 yrs out
Nearby sold comps map
Loading sold comps map…
Walkable amenities ~0.75 mi
Loading nearby amenities…
Taxation est. · year 1
- Rental income
- $41,637
- − Mortgage interest
- −$12,884
- − Property taxes
- −$3,450
- − Insurance
- −$1,150
- − Repairs & maintenance
- −$3,331
- − Management
- −$3,331
- − Depreciation
- −$6,691
- Taxable income
- $10,801
- Est. tax owed @ 24.0%
- −$2,592
- After-tax cash flow
- $11,228/yr
For passive investors: Depreciation is non-cash, so a rental often shows a tax loss while cash-flowing — sheltering income. Rental losses are passive: they offset passive income freely, and up to $25,000/yr can offset ordinary (W-2) income if you actively participate and your MAGI is under $100k (phasing out to $0 by $150k); unused losses carry forward. On sale, claimed depreciation is recaptured at up to 25%, and gains may owe capital-gains tax (a 1031 exchange can defer both). Figures are a year-1 estimate at your 24.0% rate — not tax advice; consult a CPA.
Schools (NCES district)
- District
- Rowland Unified
- NCES district ID
- 0633750
- Math proficiency
- 40% ▼ -1.00%
- Reading proficiency
- 62% ▲ 11.00%
- Median HH income
- $63,667
- Composite
- 44.83/100
- National rank
- #2733
- State rank
- #134 of 517 in CA
Livability — South San Jose Hills
- Score
- 63/100
- State rank
- #449
- US rank
- #15206
Category grades
Schools grade is shown separately in the Schools card above.
Census & demographics
- Census place
- South San Jose Hills, CA
- County
- Los Angeles County · 9,444,647 people
- Metro
- Los Angeles-Long Beach-Anaheim, CA
- Population (ZIP)
- 76,942
- Household income
- $93,557
- Rent vs Own
- Severe rent burden
- 1299.0
Population outlook (Los Angeles County) Hauer SSP2
- Today (2025)
- 10,940,515 people
- By 2030
- 11,256,481 · +2.9%
- By 2040
- 11,729,929 · +7.2%
- By 2050
- 11,948,407 · +9.2%
- By 2075
- 11,818,114 · +8.0%
- By 2100
- 10,842,928 · -0.9%
Race, ethnicity, and origin ACS 2023
- Neighborhood character
- Predominantly Hispanic (79%)
- Race & ethnicity
- Hispanic / Latino 79% Two or more races 18% Asian 14% White 4% Native American 2% Black 1%
- Hispanic origin (detail)
- Mexican 69%
- Foreign-born
- 39% · Canada, China, Vietnam
- Languages at home
- 26% English-only · Spanish 62% Chinese 6% Tagalog/Filipino 3%
Political lean MEDSL · Los Angeles
- 2024 margin
- Solid D (+32.9) · D 64.8% · R 31.9% · Other 3.3%
- 2008→2024 swing
- -7.4pp toward R · 2008: 40.4pp · 2024: 32.9pp
- All cycles
- 2024: D+32.9 2020: D+44.2 2016: D+48.0 2012: D+40.0 2008: D+40.4
Not yet ingested
- Civics
- —
Market trends
- HPI YoY
- ▼ -953.57%
- Current HPI
- 447.0241
- Rent YoY
- ▲ 13.19%
- Metro
- Los Angeles-Long Beach-Anaheim, CA
- State GDP YoY
- ▲ 3.21%
- F500 in state
- 116
Industry mix (Fortune 500 HQ in CA)
| Industry | F500 HQs | Revenue |
|---|---|---|
| Technology | 27 | $1,492B |
|
||
| Financial Services | 3 | $174B |
|
||
| Retail | 3 | $44B |
|
||
| Insurance | 3 | $26B |
|
||
| Media / Entertainment | 2 | $115B |
|
||
| Pharmaceuticals / Biotech | 2 | $62B |
|
||
Price history
+379.2% since first listed26 events — show timeline
- 2026-01-26 Price Changed $230,000 TheMLS
- 2025-12-18 Listed $250,000 TheMLS
- 2019-12-23 Sold (MLS) $95,000 CRMLS
- 2019-12-09 Pending — CRMLS
- 2019-10-14 Listed $97,000 CRMLS
- 2013-07-31 Sold (MLS) $36,000 CRMLS
- 2013-07-12 Pending — CRMLS
- 2013-06-30 Sold (MLS) $36,000 CRMLS
- 2013-05-20 Pending — CRMLS
- 2012-10-04 Listed $39,900 CRMLS
- 2012-09-13 Listing Removed — CRMLS
- 2012-03-14 Listed $39,000 CRMLS
- 2009-11-01 Price Changed $75,900 CRMLS
- 2008-11-12 Listing Removed — CRMLS
- 2008-11-05 Listed $68,900 CRMLS
- 2008-08-07 Listing Removed — CRMLS
- 2008-03-06 Listed $74,900 CRMLS
- 2007-11-01 Listing Removed — CRMLS
- 2007-09-29 Price Changed $79,900 CRMLS
- 2007-05-17 Listing Removed — CRMLS
- 2007-04-21 Listed $85,000 CRMLS
- 2006-11-16 Listed $85,000 CRMLS
- 2004-09-16 Sold (MLS) $52,900 CRMLS
- 2004-07-01 Listed $52,900 CRMLS
- 2003-05-20 Sold (MLS) $43,000 CRMLS
- 2003-03-24 Listed $48,000 CRMLS
Property tax history
+8.2%/yrLatest (2025): $314 · +8.2% YoY. Source: county tax records.
Cash-flow waterfall
monthlySold comps — $/sqft
last 12 mo · ≤1 miLoading sold comps…