 🌊 Lakefront
5214 Ciatto Way · Ave Maria, FL
Flood risk 1/10 · Minimal
- FEMA flood zone
- X (unshaded)
- Chance of flooding over 30 yrs
- 0.0%
- Est. flood insurance / yr
- $507 – $1,088
Fire risk 5/10 · Moderate
- Est. fire insurance / yr
- $947 – $1,759
Heat risk 10/10 · Severe
- Hot days now (above 112°F)
- 7 days/yr
- Hot days in 30 yrs
- 29 days/yr
Wind risk 10/10 · Severe
- Chance of severe wind over 30 yrs
- 99.0%
Air-quality risk 2/10 · Minimal
- Unhealthy air days now
- 0 days/yr
- Unhealthy air days in 30 yrs
- 1 days/yr
Risk factors via First Street. Map © Google.
Why this score? — see what drove the C- grade
The composite is a weighted blend of 9 inputs, each scored 0–100. Each bar is that input's sub-score; the figure is the points it added to the 100-point composite (weight × sub-score).
- Cash flow +16.0/30.0
- ARV discount +7.5/15.0
- 1% rule +5.5/10.0
- DSCR +5.0/10.0
- Schools +5.0/10.0
- Appreciation +4.5/10.0
- Rent growth +3.2/5.0
- Livability +2.5/5.0
- Condition / age +2.5/5.0
$464,900
🖨 Deal sheet 📄 Offer letter ✓ Due diligence
Listing remarks
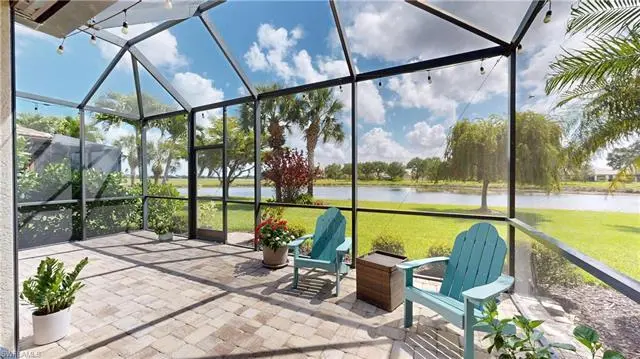
Ave Maria Florida Living at its Finest, Del Webb Naples is a Premier 55+ Amenities & Lifestyle Rich Community. Exceptionally Optioned “Abbeyville” Model, w/ Covered & Extended Rear Lanai/Patio Providing Approximately 500 Sq. Ft. of Outdoor Living/Entertaining Space, Stone Front Elevation, Florida Rm, 3rd Bedroom Option, 4’ Garage Ext. on Oversized Premium Water Lot, Stunning Beautifully Landscaped Views, 1805 Sq. Ft. 2225 Total Sq. Ft. , 3 Bedrooms, 2 Full Baths, 2 Car Garage. Other Options Include; Kinetico Water Filtration System, Hurricane Electrical Roll Down Shutters at Rear Lanai, Accordion Hurricane Shutters on Windows, Tile on Diagonal Through Most, Woo
Key facts
- Resort pool
- 6,969 sq ft lot
- 2 garage spots
Tags
Property features AI
Finance
- Financial info: One-time special assessment fee noted
- HOA & community: Mandatory HOA; HOA fee approximately $1,263.12 quarterly; Master HOA fee approximately $203 quarterly; HOA maintenance covers cable, internet/Wi‑Fi, irrigation water, lawn/land maintenance, legal/accounting, on-site manager, recreation facilities, reserves, street lights and street maintenance; On-site management; Community amenities include clubhouse, community pool and room, exercise room, tennis, pickleball, basketball, bocce, putting green, golf course (non‑equity), dog park, bike/jog paths, restaurant, sauna, library, billiards, beauty salon, BBQ/picnic areas and underground utilities; Total annual recurring fees approx. $5,864; total one-time fees approx. $1,825; one-time other fee $250
Exterior
- Parking: Attached 2-car garage
- Security: Gated community; Entry card; Entry keypad; Electric shutters and other shutters
- Utilities: Central water; Central sewer; Cable available; Reclaimed irrigation
- Home design: Single-family home, 1 story (ranch/Florida); Built in 2016; Stucco exterior; Tile roof; Rear exposure to the east; Located in Ave Maria community (gated, golf course community)
- Construction: Concrete block construction
- Exterior features: Patio; Room for pool; Automatic sprinklers; Screened lanai/porch; Florida room; Lake view / waterfront
Interior
- Kitchen: Kitchen island; Pantry and walk-in pantry
- Bedrooms: 3 bedrooms
- Flooring: Tile flooring; Wood flooring
- Bathrooms: 2 full bathrooms; Master bathroom with dual sinks and shower
- Heating & cooling: Central electric heat; Central electric air conditioning; Ceiling fans
- Interior features: Cable pre-wired and high-speed internet available; Laundry tub; Multiple phone lines; Pantry; Smoke detectors; Tray ceiling; Walk-in closet(s); Window coverings; Great room floor plan; Five ceiling fans; Unfurnished
- Laundry & utility: Laundry located in residence; Auto garage door
Neighborhood map
What this means for you Summary
Snapshot
- This is a 3-bed/2.0-bath single-family listed at $465k.
Deal economics
- At list price, monthly cash flow is $234 ($3k/yr) — positive.
- The deal already cash-flows at list — no discount required.
- Meets the 1% rule at list price ($5k rent vs $465k).
- Recommended offer: $437k (6.0% below list) — sets the bar for market timing.
Location & tenants
- Location reads: area grade C — affects rentability + tenant quality, not the cash-flow math above.
- Collier (suburban): math 60% / reading 56% proficiency, ranked #16 of 73 in FL (top 22%) — acceptable for families but not a draw, mixed tenant base, ~2y average lease.
- Market conditions: Rents rising (+3.0%/yr); 449 active listings in the ZIP; 40 comparable units currently listed for rent nearby; rentals at typical pace (median 23d on market — plan ~3-4 weeks tenant-placement turnaround); 3,520 units permitted in Collier County in 2024 (959 in 5+ unit buildings).
- At $4,877/mo this rent would consume 94% of the median local household income ($62k/yr) (locally 1093% of renters already pay >50% of income on rent) — very limited rent-growth headroom before tenants either downsize or default.
Forward outlook
- Local home prices are declining (-1.1%/yr); year-one equity from $3k of loan paydown is wiped out by about $5k of value loss. Plan a longer hold.
- Collier County population projected at +30% by 2050 — long-run rental-demand tailwind backs the buy-and-hold thesis.
Negotiation context
- It's been on market 70 days — a 6% lower offer ($437k) is reasonable based on typical stale-listing flexibility.
- Current owner paid $316k; 47% above their basis — modest negotiation headroom, anchor on the comps not their cost.
Risks & watch-outs
- Climate carrying-cost: severe wind risk, 99% chance of damaging wind over 30y; moderate wildfire risk; extreme-heat days projected 7→29/yr by 2055 (HVAC capex compounding) — expect insurance premiums to compound above CPI over the hold.
Questions for the listing agent
- It's been on market 70 days. Have you received any prior offers? Is the seller open to a 6% concession, seller financing, or rate buy-down credit?
- What does the HOA fee cover, when was the last increase, and are there any pending special assessments or reserve-fund shortfalls?
- Why hasn't it sold? Are there any deal-killer items the seller is aware of (foundation, flood, title, zoning, code violations)?
- Is there a deadline driving the sale (1031 exchange, divorce, estate, relocation)? That informs how much negotiation room exists.
- This sits on a lake — are riparian / water-frontage rights deeded with the parcel? Any dock permits, shoreline easements, or HOA water-use restrictions?
- What's the documented flood / surge / shoreline-erosion history here (FEMA AND non-FEMA — e.g., storm surge, creek backup, septic-field saturation)?
- Any water-quality or seasonal algae-bloom issues that affect tenant satisfaction or short-term-rental demand?
- What's the average days-on-market for RENTAL listings here right now (not sales)? A rising rental-DOM trend means longer vacancies and softer asking-rent achievability than the comps imply.
- What's the recent tenant-quality profile in this submarket — average credit score on applications, eviction rate, late-payment / NSF rate, and stable-employment percentage? A property-management company in the area should have these aggregated.
- How much new for-sale + rental construction is in the pipeline within 1–3 miles? Heavy new supply typically softens prices + rents 12–24 months out; constrained supply supports both.
Investment metrics
- 1% rule
- 1.05% ✓
- Cap rate
- 6.90%
- Cash-on-cash
- 2.15%
- DSCR
- 1.10
- GRM
- 7.9
CMA / ARV
No comps found within radius.
Projected returns pro-forma
-1.05% appreciation · 2.95% rent growth · sell at horizon
- IRR
- -3.7%
- Equity multiple
- 0.84×
- Total profit
- $-21,062
- Equity at exit
- $111,146
- IRR
- 3.1%
- Equity multiple
- 1.29×
- Total profit
- $37,950
- Equity at exit
- $115,798
Cash invested: $130,172 (down + closing). Projections, not guarantees.
Landlord ↔ Tenant lean methodology
- Overall (STATE)
- 87 Strongly Landlord-Friendly
- State Florida
- 87 Strongly Landlord-Friendly · R+3
- County
- — inherits STATE
- City
- — inherits STATE
ZIP-level market 34142
- Home prices YoY
- -0.5%
- Rents YoY
- 3.0%
- Active inventory
- 449
- Price-to-rent
- 7.9×
Monthly cashflow live
- Estimated rent
- $4,877 high interval (Pro) →
- Mortgage (P&I)
- −$2,438
- Tax from tax record
- −$498 /mo · $5,981/yr
- Insurance
- −$194
- HOA
- −$489
- Vacancy / Maint / Mgmt
- −$1,024
- Net cashflow
- $234
Break-even live
UW: 25.0% down · 7.5% · 30yr · 1.5% tax · 5.0% vac · 8.0% maint · 8.0% mgmt
Financing live
Cash to close
- Down payment
- $116,225
- Closing costs
- $13,947
- Reserves months
- —
- Total cash needed
- —
Loan-product check · same deal, 3 products live
Conventional
25% down · 7.5% · 30yr
- Down + closing
- —
- Monthly P&I
- —
- Monthly cashflow
- —
- DSCR
- —
- Eligible?
- —
Personal DTI + credit; lowest rate.
DSCR
20% down · 8.5% · 30yr
- Down + closing
- —
- Monthly P&I
- —
- Monthly cashflow
- —
- DSCR
- —
- Eligible?
- —
No personal income docs; deal must DSCR.
Hard money
10% down · 12.0% · 12mo
- Down + closing
- —
- Monthly P&I
- —
- Monthly cashflow
- —
- DSCR
- —
- Eligible?
- —
Short-term bridge; refi at stabilization.
Rent comps 40 comps
| Address | Beds | Baths | Sqft | Rent | $/sqft | DOM | Units | Dist |
|---|---|---|---|---|---|---|---|---|
| 5476 Katia Ct Ave Maria, FL | 3.0 | 2.5 | 1983 | $4,300 | $2.17 | 23d | 1 | 0.20mi |
| 8010 Helena Ct Ave Maria, FL | 2.0 | 2.0 | 1554 | $2,500 | $1.61 | 21d | 1 | 0.21mi |
| 6003 Diamonte Pl Ave Maria, FL | 3.0 | 2.5 | 2395 | $11,995 | $5.01 | 23d | 1 | 0.22mi |
| 6023 Diamonte Pl Ave Maria, FL | 3.0 | 3.0 | 2379 | $4,995 | $2.10 | 23d | 1 | 0.30mi |
| 5909 Berwick Ln Ave Maria, FL | 2.0 | 2.0 | 1850 | $10,995 | $5.94 | 23d | 1 | 0.31mi |
| 6036 Ellerston WAY #1311 Ave Maria, FL | 3.0 | 2.0 | 1741 | $4,490 | $2.58 | 23d | 1 | 0.34mi |
| 5445 Double Eagle Cir #3011 Ave Maria, FL | 2.0 | 2.0 | 1569 | $2,495 | $1.59 | 23d | 1 | 0.34mi |
| 6039 Ellerston WAY #2017 Ave Maria, FL | 2.0 | 2.0 | 1355 | $6,295 | $4.65 | 23d | 1 | 0.34mi |
| 5710 Melbourne Ct #6511 Ave Maria, FL | 3.0 | 2.0 | 1741 | $7,295 | $4.19 | 23d | 1 | 0.34mi |
| 5651 Double Eagle Cir #4338 Ave Maria, FL | 2.0 | 2.0 | 1301 | $6,295 | $4.84 | 23d | 1 | 0.34mi |
| 5704 Melbourne Ct #6712 Ave Maria, FL | 3.0 | 2.0 | 1741 | $7,295 | $4.19 | 23d | 1 | 0.34mi |
| 6012 Ellerston WAY #1121 Ave Maria, FL | 3.0 | 2.0 | 2110 | $6,295 | $2.98 | 23d | 1 | 0.34mi |
| 5629 Double Eagle Cir #4218 Ave Maria, FL | 3.0 | 2.0 | 1301 | $6,295 | $4.84 | 23d | 1 | 0.34mi |
| 5466 Double Eagle Cir #3425 Ave Maria, FL | 2.0 | 2.0 | 1355 | $5,995 | $4.42 | 23d | 1 | 0.36mi |
| 5478 Double Eagle Cir #3521 Ave Maria, FL | 2.0 | 2.0 | 1569 | $4,995 | $3.18 | 23d | 1 | 0.37mi |
| 5937 Berwick Ln Ave Maria, FL | 3.0 | 2.0 | 2061 | $4,995 | $2.42 | 23d | 1 | 0.38mi |
| 5433 Double Eagle Cir #2915 Ave Maria, FL | 2.0 | 2.0 | 1366 | $6,295 | $4.61 | 21d | 1 | 0.38mi |
| 5433 Double Eagle Cir Ave Maria, FL | 2.0 | 2.0 | 1366 | $3,295 | $2.41 | 23d | 1 | 0.38mi |
| 5938 Berwick Ln Ave Maria, FL | 3.0 | 3.0 | 2247 | $10,995 | $4.89 | 23d | 1 | 0.38mi |
| 5428 Double Eagle Cir #2517 Ave Maria, FL | 2.0 | 2.0 | 1355 | $2,695 | $1.99 | 23d | 1 | 0.39mi |
| 5515 Whistling Straights Ct Ave Maria, FL | 3.0 | 2.5 | 2419 | $6,500 | $2.69 | 21d | 1 | 0.39mi |
| 5454 Double Eagle Cir #3325 Ave Maria, FL | 2.0 | 2.0 | 1355 | $2,495 | $1.84 | 23d | 1 | 0.40mi |
| 5478 Double Eagle Cir #3515 Ave Maria, FL | 2.0 | 2.0 | 1355 | $2,395 | $1.77 | 23d | 1 | 0.41mi |
| 5410 Double Eagle Cir #2222 Ave Maria, FL | 2.0 | 2.0 | 1355 | $2,395 | $1.77 | 23d | 1 | 0.41mi |
| 5939 Gala Dr Immokalee, FL | 3.0 | 3.0 | 2300 | $5,995 | $2.61 | 23d | 1 | 0.41mi |
| 5427 Double Eagle Cir #2812 Ave Maria, FL | 2.0 | 2.0 | 1355 | $2,395 | $1.77 | 13d | 1 | 0.43mi |
| 5427 Double Eagle Cir Ave Maria, FL | 2.0 | 2.0 | 1355 | $2,995 | $2.21 | 23d | 1 | 0.43mi |
| 5807 Double Eagle Cir #4631 Ave Maria, FL | 3.0 | 2.0 | 1301 | $5,695 | $4.38 | 23d | 1 | 0.45mi |
| 6082 National Blvd Ave Maria, FL | 2.0 | 2.0 | 1366 | $4,145 | $3.03 | 23d | 2 | 0.47mi |
| 5435 Pikewood Ct Ave Maria, FL | 2.0 | 2.5 | 1850 | $3,695 | $2.00 | 21d | 1 | 0.47mi |
| 5491 Double Eagle Cir #3728 Ave Maria, FL | 3.0 | 2.0 | 1301 | $2,195 | $1.69 | 13d | 1 | 0.48mi |
| 5981 Berwick Ln Ave Maria, FL | 3.0 | 3.0 | 2224 | $5,995 | $2.70 | 23d | 1 | 0.49mi |
| 5985 Berwick Ln Ave Maria, FL | 2.0 | 2.0 | 2061 | $10,995 | $5.33 | 23d | 1 | 0.50mi |
| 6023 Ellerston Way #1823 Ave Maria, FL | 3.0 | 2.0 | 1695 | $2,995 | $1.77 | 23d | 1 | 0.51mi |
| 6058 National Blvd Ave Maria, FL | 2.0–3.0 | 2.0 | 1210 | $5,795 | $4.79 | 23d | 2 | 0.52mi |
| 5997 Berwick Ln Ave Maria, FL | 3.0 | 3.0 | 2247 | $6,995 | $3.11 | 23d | 1 | 0.53mi |
| 5444 Fancourt Links Way Ave Maria, FL | 3.0 | 3.0 | 2247 | $3,995 | $1.78 | 21d | 1 | 0.53mi |
| 5538 Useppa Dr Ave Maria, FL | 2.0 | 2.5 | 1850 | $10,995 | $5.94 | 23d | 1 | 0.56mi |
| 5428 Fancourt Links Way Ave Maria, FL | 3.0 | 3.0 | 2247 | $7,895 | $3.51 | 21d | 1 | 0.57mi |
| 5527 Double Eagle Cir Unit 3838 Ave Maria, FL | 3.0 | 2.0 | 1301 | $2,295 | $1.76 | 23d | 1 | 0.58mi |
HOA detail
- Monthly dues
- $489 · $5,868/yr
- Likely covers
- waterelectric
Listing history 18 events
-
2026-06-18days on market $464,900 Active 70 DOM
-
2026-06-17days on market $464,900 Active 69 DOM
-
2026-06-16days on market $464,900 Active 68 DOM
-
2026-06-15days on market $464,900 Active 67 DOM
-
2026-06-14days on market $464,900 Active 65 DOM
-
2026-06-10days on market $464,900 Active 62 DOM
-
2026-06-09days on market $464,900 Active 61 DOM
-
2026-06-08days on market $464,900 Active 60 DOM
-
2026-06-07days on market $464,900 Active 59 DOM
-
2026-06-03days on market $464,900 Active 55 DOM
-
2026-06-02days on market $464,900 Active 54 DOM
-
2026-06-01days on market $464,900 Active 53 DOM
-
2026-05-31days on market $464,900 Active 52 DOM
-
2026-05-30days on market $464,900 Active 51 DOM
-
2026-04-09$471,900 Active
-
2021-10-04soldstatus $316,000
-
2021-08-26soldstatus $316,000
-
2017-09-27soldstatus $287,500
ⓘ Source: listings_history table (triggers on properties + properties_extension) + one-shot
backfill from property_details.listing_events for pre-trigger history.
Tax reassessment forecast FL · Resets to sale price
- Current annual tax
- $5,981 · $498/mo
- Projected year-2 tax
- $5,981 · $498/mo
- Expected delta
- $0/yr ($0/mo · 0.0%)
ⓘ Screening estimate from a state-policy table — verify with the county assessor before closing.
Climate risk First Street
- Flood 1/10 Low FEMA zone X (unshaded) · 0% chance over 30 yrs
- Wildfire 5/10 Major
- Heat 10/10 Extreme 7 d/yr ≥112°F today · 29 d/yr by 30 yrs out
- Wind 10/10 Extreme 99% chance of damaging wind over 30 yrs
- Air quality 2/10 Low 0 unhealthy d/yr today · 1 by 30 yrs out
Nearby sold comps map
Loading sold comps map…
Walkable amenities ~0.75 mi
Loading nearby amenities…
Taxation est. · year 1
- Rental income
- $58,521
- − Mortgage interest
- −$26,042
- − Property taxes
- −$5,981
- − Insurance
- −$2,324
- − Repairs & maintenance
- −$4,682
- − Management
- −$4,682
- − HOA
- −$5,868
- − Depreciation
- −$13,524
- Taxable loss
- −$4,581
- Est. tax savings @ 24.0%
- +$1,100
- After-tax cash flow
- $3,902/yr
For passive investors: Depreciation is non-cash, so a rental often shows a tax loss while cash-flowing — sheltering income. Rental losses are passive: they offset passive income freely, and up to $25,000/yr can offset ordinary (W-2) income if you actively participate and your MAGI is under $100k (phasing out to $0 by $150k); unused losses carry forward. On sale, claimed depreciation is recaptured at up to 25%, and gains may owe capital-gains tax (a 1031 exchange can defer both). Figures are a year-1 estimate at your 24.0% rate — not tax advice; consult a CPA.
Schools (NCES district)
- District
- Collier
- NCES district ID
- 1200330
- Math proficiency
- 60% ▼ -4.00%
- Reading proficiency
- 56% ▼ -2.00%
- Median HH income
- $58,275
- Composite
- 50.23/100
- National rank
- #1892
- State rank
- #16 of 73 in FL
Livability — Ave Maria
No livability data for this city. (Only ~50 U.S. cities are tracked.)
Census & demographics
- Census place
- Ave Maria, FL
- County
- Collier County · 396,295 people
- Metro
- Naples-Marco Island, FL
- Population (ZIP)
- 35,149
- Household income
- $62,333
- Rent vs Own
- Severe rent burden
- 1093.0
Population outlook (Collier County) Hauer SSP2
- Today (2025)
- 420,858 people
- By 2030
- 450,054 · +6.9%
- By 2040
- 502,232 · +19.3%
- By 2050
- 544,932 · +29.5%
- By 2075
- 627,203 · +49.0%
- By 2100
- 659,015 · +56.6%
Race, ethnicity, and origin ACS 2023
- Neighborhood character
- Majority Hispanic (63%)
- Race & ethnicity
- Hispanic / Latino 63% Two or more races 39% Black 19% White 16% Native American 7%
- Hispanic origin (detail)
- Mexican 43% Puerto Rican 3% Cuban 2% Dominican 1%
- Common ancestry
- Hispanic 8% Slovak 1% Serbian 1%
- Foreign-born
- 32% · Canada, Jamaica
- Languages at home
- 34% English-only · Spanish 53% French/Haitian/Cajun 12%
Political lean MEDSL · Collier
- 2024 margin
- Solid R (+33.1) · D 33.1% · R 66.2%
- 2008→2024 swing
- -10.6pp toward R · 2008: -22.5pp · 2024: -33.1pp
- All cycles
- 2024: R+33.1 2020: R+24.7 2016: R+26.0 2012: R+30.1 2008: R+22.5
Not yet ingested
- Civics
- —
Market trends
- HPI YoY
- ▼ -1.05%
- Current HPI
- 226.9105
- Rent YoY
- ▲ 2.95%
- Metro
- Naples-Marco Island, FL
- State GDP YoY
- ▲ 3.28%
- F500 in state
- 36
Industry mix (Fortune 500 HQ in FL)
| Industry | F500 HQs | Revenue |
|---|---|---|
| Industrial Technology | 2 | $29B |
|
||
| Insurance | 2 | $17B |
|
||
| Retail | 1 | $60B |
|
||
| Technology Distribution | 1 | $58B |
|
||
| Homebuilding | 1 | $35B |
|
||
| Technology Manufacturing | 1 | $35B |
|
||
Price history
+64.1% since first listed4 events — show timeline
- 2026-04-09 Listed $471,900 NAPLESMLS
- 2021-10-04 Sold (Public Records) $316,000 Public Records
- 2021-08-26 Sold (Public Records) $316,000 Public Records
- 2017-09-27 Sold (Public Records) $287,500 Public Records
Property tax history
+36.3%/yrLatest (2025): $5,981 · +7.4% YoY. Source: county tax records.
Cash-flow waterfall
monthlySold comps — $/sqft
last 12 mo · ≤1 miLoading sold comps…