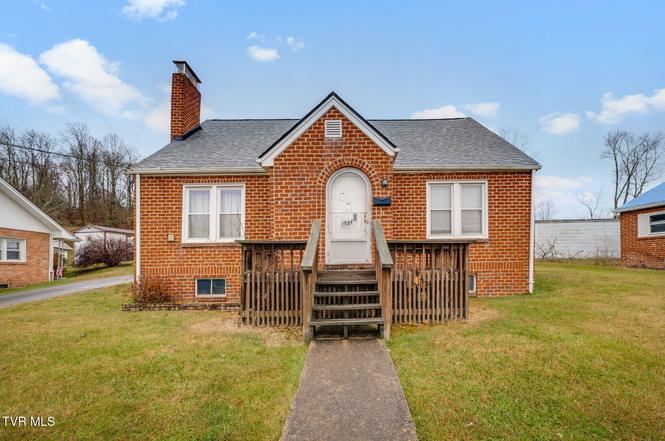
1524 Fairview Ave · Kingsport, TN
Flood risk 1/10 · Minimal
- FEMA flood zone
- X (unshaded)
- Chance of flooding over 30 yrs
- 0.0%
- Est. flood insurance / yr
- $473 – $860
Fire risk 3/10 · Minor
- Est. fire insurance / yr
- $949 – $1,763
Heat risk 4/10 · Minor
- Hot days now (above 100°F)
- 7 days/yr
- Hot days in 30 yrs
- 20 days/yr
Wind risk 2/10 · Minimal
- Chance of severe wind over 30 yrs
- —
Air-quality risk 1/10 · Minimal
- Unhealthy air days now
- 0 days/yr
- Unhealthy air days in 30 yrs
- 0 days/yr
Risk factors via First Street. Map © Google.
Why this score? — see what drove the C+ grade
The composite is a weighted blend of 9 inputs, each scored 0–100. Each bar is that input's sub-score; the figure is the points it added to the 100-point composite (weight × sub-score).
- Cash flow +21.2/30.0
- ARV discount +15.0/15.0
- DSCR +6.7/10.0
- 1% rule +4.8/10.0
- Rent growth +4.5/5.0
- Livability +3.6/5.0
- Schools +3.0/10.0
- Condition / age +2.5/5.0
- Appreciation +0.0/10.0
$194,900
🖨 Deal sheet 📄 Offer letter ✓ Due diligence
Listing remarks
* * Back on Market at no fault of Seller, Buyers had a Home Sale Contigency that expired * * Looking for the perfect home? Look no more. Welcome home to this well-maintained 3-bedroom, 1-bath residence located in a convenient Kingsport city location close to schools, shopping, downtown, and hospitals. This move-in-ready home features a newer roof, HVAC system, and water heater, offering peace of mind and comfort for years to come. Inside, you'll find beautiful hardwood floors, a spacious living room, cozy dining area, and a roomy kitchen with charming wood cabinetry. The main level includes two bedrooms, a full bath, and a laundry room conveniently located just off the carport. The finis
Key facts
- Cozy dining area
- Newer roof
- Water heater
Tags
Property features AI
Finance
- Other: Zoned R 1B
- Financial info:
- HOA & community:
Exterior
- Parking: Carport (1 space); Driveway with asphalt surface
- Security:
- Utilities: Public water; Public sewer; Electricity connected; Water connected; Sewer connected; Cable available
- Home design: Single-family house; Two levels; Residential property
- Construction: Brick construction; Block foundation; Composition/shingle roof; Built as a house
- Exterior features: Front porch; Rolling slope topography
Interior
- Kitchen: Electric range; Refrigerator
- Bedrooms:
- Flooring: Hardwood; Tile; Other
- Bathrooms: 1 full bathroom
- Heating & cooling: Central heating; Heat pump; Central air
- Interior features: Electric range; Refrigerator; Finished basement; 7 total rooms
- Laundry & utility: Washer hookup; Electric dryer hookup
Neighborhood map
What this means for you Summary
Snapshot
- This is a 3-bed/1.0-bath single-family listed at $195k.
Deal economics
- At list price, monthly cash flow is $280 ($3k/yr) — positive.
- The deal already cash-flows at list — no discount required.
- To meet the 1% rule (rent ≥ 1% of price), the offer needs to be $192k (1.7% below list).
- Recommended offer: $172k (12.0% below list) — sets the bar for market timing.
- Cap rate 8.0% vs local median 3.8% in Kingsport — top-decile yield for the area; either an underpriced asset or a hidden risk that comps aren't pricing in. Stress-test before assuming the spread holds.
Location & tenants
- Location reads 71/100 on livability (#39 in TN) — a middle-class / working-renter tenant base. Strengths: cost of living A+, health & safety A+, housing A; Watch: amenities C-, crime F, commute F.
- Kingsport (urban): math 35% / reading 38% proficiency, ranked #26 of 139 in TN (top 19%) — families likely to look elsewhere, expect single-tenant / working-renter base with shorter leases.
- Zoned schools: Theodore Roosevelt Elementary School (math 27% / reading 22%, grade F, #546 of 952 statewide, top 61%, 277 students, 0% FRL); John Sevier Middle School (math 21% / reading 24%, grade F, #172 of 333 statewide, top 52%, 750 students, 0% FRL); Dobyns - Bennett High School (math 23% / reading 56%, grade F, #28 of 332 statewide, top 9%, 2,514 students, 0% FRL) — zoned schools average 0% FRL vs 47% district-wide (47 pts lower); this property's tenant base skews higher-income than the district average.
- Market conditions: Rents rising fast (+8.0%/yr); 239 active listings in the ZIP; 6 comparable units currently listed for rent nearby; rentals at typical pace (median 21d on market — plan ~3-4 weeks tenant-placement turnaround); 453 units permitted in Sullivan County in 2024 (6 in 5+ unit buildings).
- At $1,915/mo this rent would consume 47% of the median local household income ($49k/yr) (locally 1384% of renters already pay >50% of income on rent) — very limited rent-growth headroom before tenants either downsize or default.
Forward outlook
- Local home prices are declining (-3.0%/yr); year-one equity from $1k of loan paydown is wiped out by about $6k of value loss. Plan a longer hold.
- Sullivan County population projected to shrink 5% by 2050 — rents likely to lag national; underwrite the cash flow, not the appreciation.
- At projected returns (-3.0% appreciation + 8.0% rent growth), your $55k cash investment doubles in ~9 years — after that, you're playing with house money.
Negotiation context
- It's been on market 191 days — a 12% lower offer ($172k) is reasonable based on typical stale-listing flexibility.
Risks & watch-outs
- Watch-outs: built in 1945 — expect roof / HVAC / electrical / plumbing capex.
Questions for the listing agent
- It's been on market 191 days. Have you received any prior offers? Is the seller open to a 12% concession, seller financing, or rate buy-down credit?
- Built in 1945 — when were the roof, HVAC, electrical panel, plumbing, and water heater last replaced?
- Why hasn't it sold? Are there any deal-killer items the seller is aware of (foundation, flood, title, zoning, code violations)?
- Is there a deadline driving the sale (1031 exchange, divorce, estate, relocation)? That informs how much negotiation room exists.
- Schools are D-rated, which usually means shorter tenancies and higher turnover. Who's the typical renter profile here, and what's been the actual vacancy rate?
- Crime grade is F in this area — have there been break-ins, vandalism, or insurance claims at this property in the last 3 years? What carrier currently insures it and at what premium?
- What's the average days-on-market for RENTAL listings here right now (not sales)? A rising rental-DOM trend means longer vacancies and softer asking-rent achievability than the comps imply.
- What's the recent tenant-quality profile in this submarket — average credit score on applications, eviction rate, late-payment / NSF rate, and stable-employment percentage? A property-management company in the area should have these aggregated.
- How much new for-sale + rental construction is in the pipeline within 1–3 miles? Heavy new supply typically softens prices + rents 12–24 months out; constrained supply supports both.
Investment metrics
- 1% rule
- 0.98% ✗
- Cap rate
- 8.02%
- Cash-on-cash
- 6.16%
- DSCR
- 1.27
- GRM
- 8.5
CMA / ARV
- ARV (on-the-fly)
- $317,800
- Comps found
- 12
Show comp detail 12 sales within ~0.75 mi
| Address | Dist | Beds/Ba | Sqft | Sold | Price | $/sf | Match |
|---|---|---|---|---|---|---|---|
| 428 Allen Dr | 0.22mi | 4/2.0 (+1) | 2,268 (-0%) | 0mo | $260,000 | $115 | 80 |
| 1024 Sharondale Ave | 0.52mi | 3/1.0 | 2,259 (-0%) | 10mo | $197,000 | $87 | 66 |
| 909 Exeter Pl | 0.35mi | 3/2.0 | 2,112 (-7%) | 6mo | $295,000 | $140 | 63 |
| 1809 Duke St | 0.53mi | 3/1.0 | 1,950 (-14%) | 2mo | $230,000 | $118 | 50 |
| 1001 Lake St | 0.50mi | 3/2.0 | 2,059 (-9%) | 14mo | $255,000 | $124 | 45 |
| 1008 Lake St | 0.48mi | 4/3.0 (+1) | 2,088 (-8%) | 9mo | $233,000 | $112 | 43 |
| 2029 Louita Ave | 0.63mi | 4/2.0 (+1) | 2,490 (+10%) | 3mo | $350,000 | $141 | 43 |
| 1395 Clark Point Rd | 0.69mi | 3/2.5 | 2,208 (-3%) | 19mo | $340,000 | $154 | 41 |
| 1125 Drumcastle Ave | 0.49mi | 3/2.5 | 2,104 (-7%) | 22mo | $300,000 | $143 | 41 |
| 931 Riverside Ave | 0.66mi | 4/2.0 (+1) | 2,560 (+13%) | 0mo | $230,000 | $90 | 38 |
| 1921 Orleans Rd | 0.53mi | 4/3.0 (+1) | 1,992 (-12%) | 8mo | $285,000 | $143 | 36 |
| 849 Mimosa Dr | 0.70mi | 3/2.0 | 1,948 (-14%) | 21mo | $312,000 | $160 | 22 |
Match score weights: distance 35% · size 25% · config 20% · recency 20%. Top-matched comps best support the ARV.
Projected returns pro-forma
-3.0% appreciation · 7.95% rent growth · sell at horizon
- IRR
- -1.7%
- Equity multiple
- 0.93×
- Total profit
- $-3,767
- Equity at exit
- $29,060
- IRR
- 12.4%
- Equity multiple
- 2.19×
- Total profit
- $65,063
- Equity at exit
- $16,851
Cash invested: $54,572 (down + closing). Projections, not guarantees.
Landlord ↔ Tenant lean methodology
- Overall (STATE)
- 87 Strongly Landlord-Friendly
- State Tennessee
- 87 Strongly Landlord-Friendly · R+13
- County
- — inherits STATE
- City
- — inherits STATE
ZIP-level market 37660
- Home prices YoY
- -24.2%
- Rents YoY
- 8.0%
- Active inventory
- 239
- Price-to-rent
- 8.5×
Monthly cashflow live
- Estimated rent
- $1,915 high interval (Pro) →
- Mortgage (P&I)
- −$1,022
- Tax from tax record
- −$130 /mo · $1,556/yr
- Insurance
- −$81
- HOA
- −$0
- Vacancy / Maint / Mgmt
- −$402
- Net cashflow
- $280
Break-even live
UW: 25.0% down · 7.5% · 30yr · 1.5% tax · 5.0% vac · 8.0% maint · 8.0% mgmt
Financing live
Cash to close
- Down payment
- $48,725
- Closing costs
- $5,847
- Reserves months
- —
- Total cash needed
- —
Loan-product check · same deal, 3 products live
Conventional
25% down · 7.5% · 30yr
- Down + closing
- —
- Monthly P&I
- —
- Monthly cashflow
- —
- DSCR
- —
- Eligible?
- —
Personal DTI + credit; lowest rate.
DSCR
20% down · 8.5% · 30yr
- Down + closing
- —
- Monthly P&I
- —
- Monthly cashflow
- —
- DSCR
- —
- Eligible?
- —
No personal income docs; deal must DSCR.
Hard money
10% down · 12.0% · 12mo
- Down + closing
- —
- Monthly P&I
- —
- Monthly cashflow
- —
- DSCR
- —
- Eligible?
- —
Short-term bridge; refi at stabilization.
Rent comps 6 comps
| Address | Beds | Baths | Sqft | Rent | $/sqft | DOM | Units | Dist |
|---|---|---|---|---|---|---|---|---|
| 1100 Harrison Ave Unit 1 Kingsport, TN | 3.0 | 1.0 | 2100 | $1,695 | $0.81 | 13d | 1 | 0.65mi |
| 1441 Gress Mag Mtn Kingsport, TN | 3.0 | 2.5 | 2218 | $2,200 | $0.99 | 21d | 1 | 0.69mi |
| 1240 Stamp Lodge Rd Kingsport, TN | 4.0 | 2.5 | 1991 | $2,170 | $1.09 | 21d | 1 | 0.74mi |
| 1104 Tay Sta Kingsport, TN | 3.0 | 3.0 | 2136 | $2,250 | $1.05 | 21d | 1 | 0.81mi |
| 541 N Holston River Dr Kingsport, TN | 3.0 | 2.5 | 1705 | $2,000 | $1.17 | 13d | 1 | 1.30mi |
| 206 Hammond Ave Kingsport, TN | 3.0 | 1.0 | 1696 | $1,525 | $0.90 | 21d | 1 | 1.49mi |
Listing history 20 events
-
2026-06-19days on market $194,900 Active 191 DOM
-
2026-06-18days on market $194,900 Active 190 DOM
-
2026-06-17days on market $194,900 Active 189 DOM
-
2026-06-16days on market $194,900 Active 188 DOM
-
2026-06-15days on market $194,900 Active 187 DOM
-
2026-06-14days on market $194,900 Active 185 DOM
-
2026-06-13days on market $194,900 Active 184 DOM
-
2026-06-10days on market $194,900 Active 182 DOM
-
2026-06-09days on market $194,900 Active 181 DOM
-
2026-06-08days on market $194,900 Active 180 DOM
-
2026-06-07days on market $194,900 Active 179 DOM
-
2026-06-05days on market $194,900 Active 176 DOM
-
2026-06-03days on market $194,900 Active 175 DOM
-
2026-06-02days on market $194,900 Active 174 DOM
-
2026-06-01days on market $194,900 Active 173 DOM
-
2026-05-31days on market $194,900 Active 172 DOM
-
2026-05-30days on market $194,900 Active 171 DOM
-
2026-03-22historical Active Under Contract
-
2026-01-26price $214,900
-
2025-12-10$224,000 Active
ⓘ Source: listings_history table (triggers on properties + properties_extension) + one-shot
backfill from property_details.listing_events for pre-trigger history.
Tax reassessment forecast TN · Resets to sale price
- Current annual tax
- $1,556 · $130/mo
- Projected year-2 tax
- $1,556 · $130/mo
- Expected delta
- $0/yr ($0/mo · 0.0%)
ⓘ Screening estimate from a state-policy table — verify with the county assessor before closing.
Climate risk First Street
- Flood 1/10 Low FEMA zone X (unshaded) · 0% chance over 30 yrs
- Wildfire 3/10 Moderate
- Heat 4/10 Moderate 7 d/yr ≥100°F today · 20 d/yr by 30 yrs out
- Wind 2/10 Low
- Air quality 1/10 Low 0 unhealthy d/yr today · 0 by 30 yrs out
Nearby sold comps map
Loading sold comps map…
Walkable amenities ~0.75 mi
Loading nearby amenities…
Taxation est. · year 1
- Rental income
- $22,984
- − Mortgage interest
- −$10,917
- − Property taxes
- −$1,556
- − Insurance
- −$974
- − Repairs & maintenance
- −$1,839
- − Management
- −$1,839
- − Depreciation
- −$5,670
- Taxable income
- $188
- Est. tax owed @ 24.0%
- −$45
- After-tax cash flow
- $3,316/yr
For passive investors: Depreciation is non-cash, so a rental often shows a tax loss while cash-flowing — sheltering income. Rental losses are passive: they offset passive income freely, and up to $25,000/yr can offset ordinary (W-2) income if you actively participate and your MAGI is under $100k (phasing out to $0 by $150k); unused losses carry forward. On sale, claimed depreciation is recaptured at up to 25%, and gains may owe capital-gains tax (a 1031 exchange can defer both). Figures are a year-1 estimate at your 24.0% rate — not tax advice; consult a CPA.
Schools (NCES district)
- District
- Kingsport
- NCES district ID
- 4702190
- Math proficiency
- 35% ▼ -12.00%
- Reading proficiency
- 38% ▼ -5.00%
- Median HH income
- $38,017
- Composite
- 30.44/100
- National rank
- #6233
- State rank
- #26 of 139 in TN
Livability — Kingsport
- Score
- 71/100
- State rank
- #39
- US rank
- #6587
Category grades
Schools grade is shown separately in the Schools card above.
Census & demographics
- Census place
- Kingsport, TN
- County
- Sullivan County · 121,987 people
- City population
- 83,493
- Metro
- Kingsport-Bristol, TN-VA
- Population (ZIP)
- 40,996
- Household income
- $49,191
- Rent vs Own
- Severe rent burden
- 1384.0
Population outlook (Sullivan County) Hauer SSP2
- Today (2025)
- 157,030 people
- By 2030
- 156,415 · -0.4%
- By 2040
- 153,778 · -2.1%
- By 2050
- 149,018 · -5.1%
- By 2075
- 138,068 · -12.1%
- By 2100
- 119,927 · -23.6%
Race, ethnicity, and origin ACS 2023
- Neighborhood character
- Predominantly White (88%)
- Race & ethnicity
- White 88% Two or more races 4% Black 4% Hispanic / Latino 3%
- Common ancestry
- Serbian 3% Slovak 3% Italian 1%
- Foreign-born
- 2% · Canada
- Languages at home
- 98% English-only · Spanish 2%
Political lean MEDSL · Sullivan
- 2024 margin
- Solid R (+55.0) · D 22.0% · R 77.0% · Other 1.0%
- 2008→2024 swing
- -13.6pp toward R · 2008: -41.3pp · 2024: -55.0pp
- All cycles
- 2024: R+55.0 2020: R+51.9 2016: R+56.2 2012: R+47.2 2008: R+41.3
Not yet ingested
- Civics
- —
Market trends
- HPI YoY
- ▼ -80.93%
- Current HPI
- 252.9821
- Rent YoY
- ▲ 7.95%
- Metro
- Kingsport-Bristol, TN-VA
- State GDP YoY
- ▲ 2.78%
- F500 in state
- 22
Industry mix (Fortune 500 HQ in TN)
| Industry | F500 HQs | Revenue |
|---|---|---|
| Healthcare | 3 | $91B |
|
||
| Retail | 3 | $72B |
|
||
| Transportation / Logistics | 1 | $88B |
|
||
| Paper / Packaging | 1 | $19B |
|
||
| Insurance | 1 | $13B |
|
||
| Energy | 1 | $12B |
|
||
Price history
-4.1% since first listed3 events — show timeline
- 2026-03-22 Contingent — TVRMLS
- 2026-01-26 Price Changed $214,900 TVRMLS
- 2025-12-10 Listed $224,000 TVRMLS
Property tax history
+5.1%/yrLatest (2025): $1,556 · +47.0% YoY. Source: county tax records.
Cash-flow waterfall
monthlySold comps — $/sqft
last 12 mo · ≤1 miLoading sold comps…