210 Offerson Rd #410 · Avon, CO
Flood risk 1/10 · Minimal
- FEMA flood zone
- X (unshaded)
- Chance of flooding over 30 yrs
- 0.0%
- Est. flood insurance / yr
- $507 – $1,088
Fire risk 4/10 · Minor
- Est. fire insurance / yr
- $939 – $1,743
Heat risk 1/10 · Minimal
- Hot days now (above 74°F)
- 14 days/yr
- Hot days in 30 yrs
- 37 days/yr
Wind risk 1/10 · Minimal
- Chance of severe wind over 30 yrs
- —
Air-quality risk 2/10 · Minimal
- Unhealthy air days now
- 1 days/yr
- Unhealthy air days in 30 yrs
- 2 days/yr
Risk factors via First Street. Map © Google.
Why this score? — see what drove the B- grade
The composite is a weighted blend of 9 inputs, each scored 0–100. Each bar is that input's sub-score; the figure is the points it added to the 100-point composite (weight × sub-score).
- Cash flow +22.3/30.0
- 1% rule +8.6/10.0
- Appreciation +8.3/10.0
- ARV discount +7.5/15.0
- DSCR +7.1/10.0
- Condition / age +4.0/5.0
- Livability +3.1/5.0
- Schools +3.0/10.0
- Rent growth +2.5/5.0
$325,000
🖨 Deal sheet 📄 Offer letter ✓ Due diligence
Listing remarks MLS
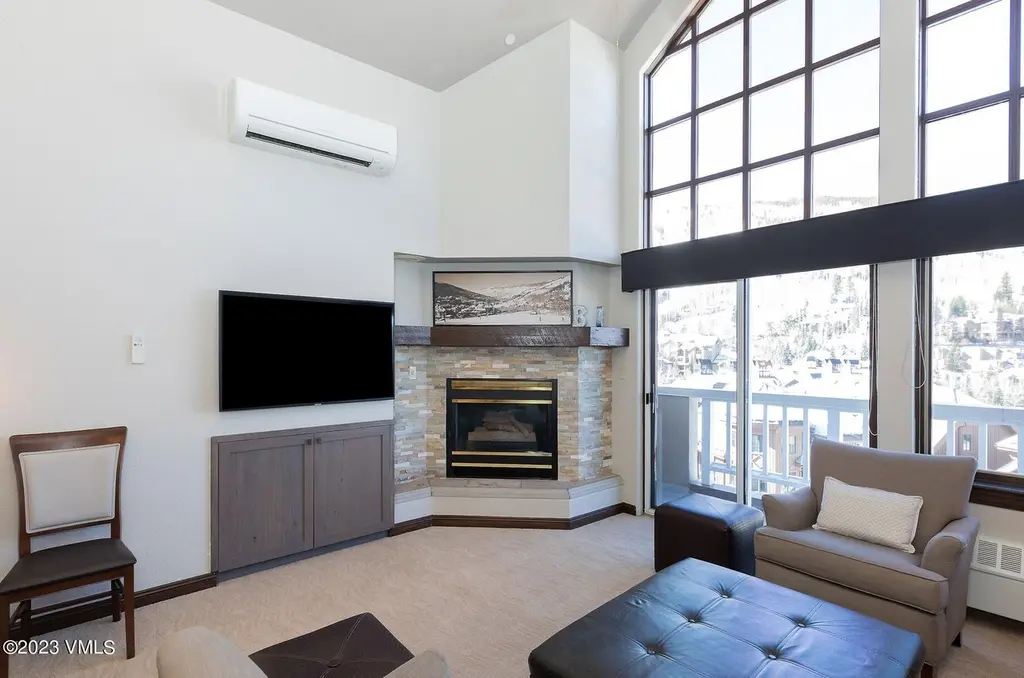
Fractional ownership. One week ownership over Thanksgiving. Beautifully done top floor 3 bedroom condo with vaulted ceilings. Thanksgiving week.
Key facts
- Ski-in access
- Underground parking
- Hot tub
Tags
Property features AI
Finance
- HOA & community: Association with annual fee; Annual association fee: 8390.0; Association covers common area maintenance, insurance, management, snow removal, taxes, and trash; Community amenities include a fitness center and pool; On-site management
Exterior
- Utilities: Cable available; Trash service; Snow removal
- Home design: Multi-family property
- Construction: Shake roof; Poured in place foundation
- Exterior features: Multi-family zoning
Interior
- Kitchen: Dishwasher; Microwave; Range; Refrigerator; Disposal
- Bedrooms: 3 bedrooms
- Flooring: Tile flooring
- Bathrooms: 3 full bathrooms
- Heating & cooling: Central air conditioning; Baseboard heating; Natural gas heating
- Interior features: Dishwasher; Disposal; Microwave; Range; Refrigerator; Washer/Dryer listed (washer and dryer included); Furnished
- Laundry & utility: Washer and Dryer included
Neighborhood map
What this means for you Summary
Snapshot
- This is a 3-bed/3.0-bath condo listed at $325k. Condition is rated good.
Deal economics
- At list price, monthly cash flow is $535 ($6k/yr) — positive.
- The deal already cash-flows at list — no discount required.
- Meets the 1% rule at list price ($4k rent vs $325k).
- Cap rate 8.3% vs local median 2.3% in Avon — top-decile yield for the area; either an underpriced asset or a hidden risk that comps aren't pricing in. Stress-test before assuming the spread holds.
Location & tenants
- Location reads 61/100 on livability (#220 in CO) — a middle-class / working-renter tenant base. Strengths: commute A+, health & safety A+, housing B; Watch: schools F, crime D-, amenities F.
- Eagle County School District No. RE-50 (town): math 22% / reading 42% proficiency, ranked #39 of 86 in CO (top 45%) — families likely to look elsewhere, expect single-tenant / working-renter base with shorter leases.
- Market conditions: 448 active listings in the ZIP; solid renter incomes; 387 units permitted in Eagle County in 2024 (256 in 5+ unit buildings).
- At $4,405/mo this rent would consume 51% of the median local household income ($103k/yr) (locally 744% of renters already pay >50% of income on rent) — very limited rent-growth headroom before tenants either downsize or default.
Forward outlook
- In year one you build about $24k of equity ($2k loan paydown + $22k appreciation (6.6% local appreciation)).
- Eagle County population projected at +4% by 2050 — modest demand growth; plan on rents tracking national, not racing it.
- At projected returns (6.6% appreciation + 3.0% rent growth), your $91k cash investment doubles in ~3 years — after that, you're playing with house money.
- By year 2, paydown + projected appreciation supports a ~$38k cash-out refi (75% LTV) — recoverable capital for the next deal without selling this one.
Negotiation context
- Only 11 days on market — expect competitive offers; lowballing is unlikely to land.
- 8 sale attempts since 26y ago with the ask held roughly flat each time — persistent listings suggest the price (not the market) is what's stuck; bring a comps-based counter.
- Current owner paid $10k; list at $325k implies a 3150% gain — meaningful room to come down on a strong offer.
Questions for the listing agent
- What does the HOA fee cover, when was the last increase, and are there any pending special assessments or reserve-fund shortfalls?
- Any open or pending special assessments — roof, HVAC, plumbing, elevator, façade? What's the per-unit balance and payoff schedule, and is the seller paying it off at close or rolling it to the buyer?
- Is there a deadline driving the sale (1031 exchange, divorce, estate, relocation)? That informs how much negotiation room exists.
- Schools are F-rated, which usually means shorter tenancies and higher turnover. Who's the typical renter profile here, and what's been the actual vacancy rate?
- Crime grade is D in this area — have there been break-ins, vandalism, or insurance claims at this property in the last 3 years? What carrier currently insures it and at what premium?
- What's the average days-on-market for RENTAL listings here right now (not sales)? A rising rental-DOM trend means longer vacancies and softer asking-rent achievability than the comps imply.
- What's the recent tenant-quality profile in this submarket — average credit score on applications, eviction rate, late-payment / NSF rate, and stable-employment percentage? A property-management company in the area should have these aggregated.
- How much new apartment / multifamily construction is in the pipeline within 1–3 miles? Heavy new supply (>2% of stock underway) typically softens rents 12–24 months out; light construction supports rent growth.
Investment metrics
- 1% rule
- 1.36% ✓
- Cap rate
- 8.27%
- Cash-on-cash
- 7.06%
- DSCR
- 1.31
- GRM
- 6.1
CMA / ARV
No comps found within radius.
Projected returns pro-forma
6.63% appreciation · 3.0% rent growth · sell at horizon
- IRR
- 22.6%
- Equity multiple
- 2.55×
- Total profit
- $140,775
- Equity at exit
- $217,463
- IRR
- 21.2%
- Equity multiple
- 5.24×
- Total profit
- $385,601
- Equity at exit
- $406,244
Cash invested: $91,000 (down + closing). Projections, not guarantees.
Landlord ↔ Tenant lean methodology
- Overall (STATE)
- 38 Tenant-Leaning
- State Colorado
- 38 Tenant-Leaning · D+4
- County
- — inherits STATE
- City
- — inherits STATE
ZIP-level market 81620
- Home prices YoY
- 1.9%
- Active inventory
- 448
- Price-to-rent
- 6.1×
Monthly cashflow live
- Estimated rent
- $4,405 medium interval (Pro) →
- Mortgage (P&I)
- −$1,704
- Tax est. 1.5%
- −$406 /mo · $4,875/yr
- Insurance
- −$135
- HOA
- −$699
- Vacancy / Maint / Mgmt
- −$925
- Net cashflow
- $535
Break-even live
UW: 25.0% down · 7.5% · 30yr · 1.5% tax · 5.0% vac · 8.0% maint · 8.0% mgmt
Financing live
Cash to close
- Down payment
- $81,250
- Closing costs
- $9,750
- Reserves months
- —
- Total cash needed
- —
Loan-product check · same deal, 3 products live
Conventional
25% down · 7.5% · 30yr
- Down + closing
- —
- Monthly P&I
- —
- Monthly cashflow
- —
- DSCR
- —
- Eligible?
- —
Personal DTI + credit; lowest rate.
DSCR
20% down · 8.5% · 30yr
- Down + closing
- —
- Monthly P&I
- —
- Monthly cashflow
- —
- DSCR
- —
- Eligible?
- —
No personal income docs; deal must DSCR.
Hard money
10% down · 12.0% · 12mo
- Down + closing
- —
- Monthly P&I
- —
- Monthly cashflow
- —
- DSCR
- —
- Eligible?
- —
Short-term bridge; refi at stabilization.
HOA detail condo
- Monthly dues
- $699 · $8,388/yr
- Assessments
- None detected in remarks — confirm with the listing agent.
Listing history 9 events
-
2026-06-19days on market $325,000 Active 11 DOM
-
2026-06-18days on market $325,000 Active 10 DOM
-
2026-06-17days on market $325,000 Active 9 DOM
-
2026-06-16days on market $325,000 Active 8 DOM
-
2026-06-15days on market $325,000 Active 7 DOM
-
2026-06-14days on market $325,000 Active 5 DOM
-
2026-06-12days on market $325,000 Active 4 DOM
-
2026-06-09remarks 380-char remark
-
2026-06-09$325,000 Active 1 DOM
ⓘ Source: listings_history table (triggers on properties + properties_extension) + one-shot
backfill from property_details.listing_events for pre-trigger history.
Climate risk First Street
- Flood 1/10 Low FEMA zone X (unshaded) · 0% chance over 30 yrs
- Wildfire 4/10 Moderate
- Heat 1/10 Low 14 d/yr ≥74°F today · 37 d/yr by 30 yrs out
- Wind 1/10 Low
- Air quality 2/10 Low 1 unhealthy d/yr today · 2 by 30 yrs out
Nearby sold comps map
Loading sold comps map…
Walkable amenities ~0.75 mi
Loading nearby amenities…
Taxation est. · year 1
- Rental income
- $52,862
- − Mortgage interest
- −$18,205
- − Property taxes
- −$4,875
- − Insurance
- −$1,625
- − Repairs & maintenance
- −$4,229
- − Management
- −$4,229
- − HOA
- −$8,388
- − Depreciation
- −$9,455
- Taxable income
- $1,856
- Est. tax owed @ 24.0%
- −$446
- After-tax cash flow
- $5,975/yr
For passive investors: Depreciation is non-cash, so a rental often shows a tax loss while cash-flowing — sheltering income. Rental losses are passive: they offset passive income freely, and up to $25,000/yr can offset ordinary (W-2) income if you actively participate and your MAGI is under $100k (phasing out to $0 by $150k); unused losses carry forward. On sale, claimed depreciation is recaptured at up to 25%, and gains may owe capital-gains tax (a 1031 exchange can defer both). Figures are a year-1 estimate at your 24.0% rate — not tax advice; consult a CPA.
Condition & rehab AI · 12 photos
This well-maintained, modern 3-bedroom/3-bath condo in the heart of Beaver Creek Village is move-in ready and offers ski-in access, front desk, concierge, and other amenities. The interior is in good condition with modern appliances and large windows, making it an ideal investment property.
Value-add opportunities
- Both update flooring in living room — hardwood flooring is more durable and aesthetically pleasing
- Both update kitchen cabinets — modern cabinets would enhance the overall look and functionality
- Both update bathroom vanity — modern vanity would enhance the overall look and functionality
Renovation cost estimate screening
Value-add ROI direction
- Both update flooring in living room — hardwood flooring is more durable and aesthetically pleasing ↑
- Both update kitchen cabinets — modern cabinets would enhance the overall look and functionality ↑
- Both update bathroom vanity — modern vanity would enhance the overall look and functionality ↑
ⓘ Cost ranges are severity-bucket heuristics (US national rule-of-thumb). Get contractor quotes + a written scope before underwriting a rehab budget.
Schools (NCES district)
- District
- Eagle County School District No. RE-50
- NCES district ID
- 0803540
- Math proficiency
- 22% ▼ -8.00%
- Reading proficiency
- 42% ▼ -4.00%
- Median HH income
- $73,322
- Composite
- 30.01/100
- National rank
- #6360
- State rank
- #39 of 86 in CO
Livability — Avon
- Score
- 61/100
- State rank
- #220
- US rank
- #17858
Category grades
Schools grade is shown separately in the Schools card above.
Census & demographics
- County
- Eagle County · 42,178 people
- City population
- 10,870
- Metro
- Edwards, CO
- Population (ZIP)
- 10,870
- Household income
- $102,775
- Rent vs Own
- Severe rent burden
- 744.0
Population outlook (Eagle County) Hauer SSP2
- Today (2025)
- 57,837 people
- By 2030
- 59,258 · +2.5%
- By 2040
- 60,698 · +4.9%
- By 2050
- 60,206 · +4.1%
- By 2075
- 54,326 · -6.1%
- By 2100
- 47,000 · -18.7%
Race, ethnicity, and origin ACS 2023
- Neighborhood character
- Diverse neighborhood (Simpson 0.56)
- Race & ethnicity
- White 62% Hispanic / Latino 23% Two or more races 23% Asian 3% Black 2%
- Hispanic origin (detail)
- Mexican 14%
- Common ancestry
- Italian 3% Scotch-Irish 2% Slovak 2%
- Foreign-born
- 14% · Canada, Dominican Republic
- Languages at home
- 78% English-only · Spanish 15% Other Indo-European 4% Chinese 1%
Political lean MEDSL · Eagle
- 2024 margin
- Strong D (+24.4) · D 61.0% · R 36.5% · Other 2.5%
- 2008→2024 swing
- +1.3pp toward D · 2008: 23.1pp · 2024: 24.4pp
- All cycles
- 2024: D+24.4 2020: D+29.8 2016: D+19.9 2012: D+14.7 2008: D+23.1
Not yet ingested
- Civics
- —
Market trends
- HPI YoY
- ▲ 6.63%
- Current HPI
- 363.7493
- Rent YoY
- —
- Metro
- Edwards, CO
- State GDP YoY
- ▲ 1.95%
- F500 in state
- 14
Industry mix (Fortune 500 HQ in CO)
| Industry | F500 HQs | Revenue |
|---|---|---|
| Technology Distribution | 1 | $31B |
|
||
| Food / Agriculture | 1 | $18B |
|
||
| Packaging | 1 | $14B |
|
||
| Healthcare | 1 | $13B |
|
||
| Energy | 1 | $10B |
|
||
| Technology | 1 | $4B |
|
||
Price history
+915.6% since first listed13 events — show timeline
- 2026-06-08 Listed $325,000 VMLS
- 2020-10-06 Sold (MLS) $10,000 VMLS
- 2019-10-15 Listed $10,000 VMLS
- 2016-03-07 Listed $10,000 VMLS
- 2002-05-05 Sold (MLS) $60,000 VMLS
- 2002-03-16 Listed $65,000 VMLS
- 2002-03-14 Sold (MLS) $42,500 VMLS
- 2002-01-18 Sold (MLS) $36,000 VMLS
- 2001-12-19 Sold (MLS) $32,000 VMLS
- 2001-11-19 Listed $39,900 VMLS
- 2001-11-19 Listed $39,900 VMLS
- 2001-07-24 Listed $45,000 VMLS
- 2000-12-06 Listed $32,000 VMLS
Cash-flow waterfall
monthlySold comps — $/sqft
last 12 mo · ≤1 miLoading sold comps…