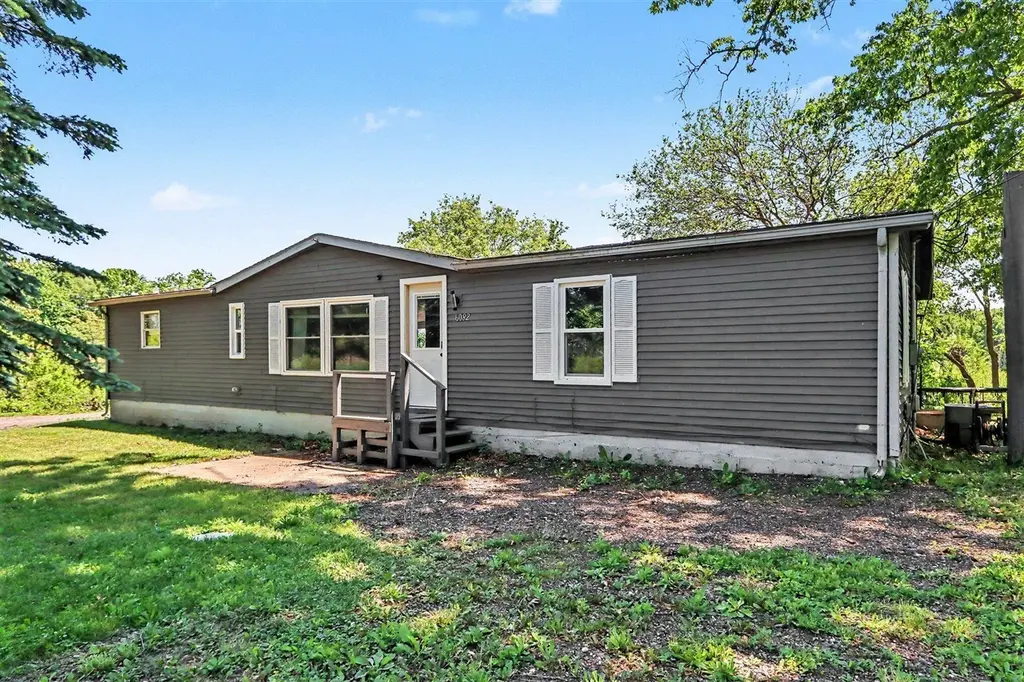
6082 E V Ave · Vicksburg, MI
Flood risk 1/10 · Minimal
- FEMA flood zone
- X (unshaded)
- Chance of flooding over 30 yrs
- 0.0%
- Est. flood insurance / yr
- $473 – $860
Fire risk 1/10 · Minimal
- Est. fire insurance / yr
- $784 – $1,456
Heat risk 2/10 · Minimal
- Hot days now (above 98°F)
- 7 days/yr
- Hot days in 30 yrs
- 16 days/yr
Wind risk 2/10 · Minimal
- Chance of severe wind over 30 yrs
- —
Air-quality risk 2/10 · Minimal
- Unhealthy air days now
- 1 days/yr
- Unhealthy air days in 30 yrs
- 2 days/yr
Risk factors via First Street. Map © Google.
Why this score? — see what drove the C+ grade
The composite is a weighted blend of 9 inputs, each scored 0–100. Each bar is that input's sub-score; the figure is the points it added to the 100-point composite (weight × sub-score).
- Cash flow +23.8/30.0
- ARV discount +15.0/15.0
- DSCR +7.7/10.0
- 1% rule +5.4/10.0
- Schools +4.3/10.0
- Livability +3.8/5.0
- Rent growth +2.5/5.0
- Condition / age +2.5/5.0
- Appreciation +0.0/10.0
$170,000
🖨 Deal sheet 📄 Offer letter ✓ Due diligence
Listing remarks MLS
Nestled in a beautiful private setting within the Vicksburg School District, this 4-bedroom, 2-bath home offers over 1,500 square feet of comfortable living space. The property features a newer one-car garage and additional outbuilding for storage or hobbies, and a fenced backyard perfect for pets, play, or outdoor entertaining. Enjoy the peaceful surroundings while still being conveniently located near local amenities. A great opportunity to enjoy privacy, space, and convenience all in one location!
Key facts
- Two outbuildings
- Private setting
- Newer one-car garage
Tags
Property features AI
Exterior
- Parking: Detached garage (1-car)
- Utilities: Private well; Natural gas available and connected; Electricity available
- Home design: Ranch-style home; Single-story; Residential property; Built in 1988
- Construction: Vinyl siding; Shingle roof; Crawl space foundation
- Exterior features: Paved road access; Shed(s); Pole barn
Interior
- Kitchen: Range; Refrigerator; Eat-in kitchen layout
- Bathrooms: 2 full bathrooms
- Heating & cooling: Forced air heating; Has cooling
- Interior features: Eat-in kitchen; 7 total rooms; Crawl space basement
- Laundry & utility: Washer; Dryer
Neighborhood map
What this means for you Summary
Snapshot
- This is a 4-bed/2.0-bath manufactured listed at $170k.
Deal economics
- At list price, monthly cash flow is $328 ($4k/yr) — positive.
- The deal already cash-flows at list — no discount required.
- Meets the 1% rule at list price ($2k rent vs $170k).
- Cap rate 8.6% vs local median 3.5% in Vicksburg — top-decile yield for the area; either an underpriced asset or a hidden risk that comps aren't pricing in. Stress-test before assuming the spread holds.
Location & tenants
- Location reads 76/100 on livability (#137 in MI, #3,361 nationally) — a middle-class / working-renter tenant base. Strengths: cost of living A+, housing A+, health & safety A+; Watch: crime C-, amenities F, commute F.
- Vicksburg Community Schools (suburban): math 42% / reading 56% proficiency, ranked #100 of 540 in MI (top 18%) — families likely to look elsewhere, expect single-tenant / working-renter base with shorter leases.
- Market conditions: 141 active listings in the ZIP; solid renter incomes; 339 units permitted in Kalamazoo County in 2024 (22 in 5+ unit buildings).
Forward outlook
- Local home prices are declining (-3.0%/yr); year-one equity from $1k of loan paydown is wiped out by about $5k of value loss. Plan a longer hold.
- Kalamazoo County population projected at +18% by 2050 — long-run rental-demand tailwind backs the buy-and-hold thesis.
Negotiation context
- Only 3 days on market — expect competitive offers; lowballing is unlikely to land.
- 25 sale attempts since 21y ago with the ask held roughly flat each time — persistent listings suggest the price (not the market) is what's stuck; bring a comps-based counter.
- Current owner paid $130k; 31% above their basis — modest negotiation headroom, anchor on the comps not their cost.
Questions for the listing agent
- Is there a deadline driving the sale (1031 exchange, divorce, estate, relocation)? That informs how much negotiation room exists.
- Schools are B-rated — typically a magnet for longer-tenancy family renters. What's the average tenant stay here, and is there a school-zone premium baked into asking?
- What's the average days-on-market for RENTAL listings here right now (not sales)? A rising rental-DOM trend means longer vacancies and softer asking-rent achievability than the comps imply.
- What's the recent tenant-quality profile in this submarket — average credit score on applications, eviction rate, late-payment / NSF rate, and stable-employment percentage? A property-management company in the area should have these aggregated.
- How much new for-sale + rental construction is in the pipeline within 1–3 miles? Heavy new supply typically softens prices + rents 12–24 months out; constrained supply supports both.
Investment metrics
- 1% rule
- 1.04% ✓
- Cap rate
- 8.61%
- Cash-on-cash
- 8.27%
- DSCR
- 1.37
- GRM
- 8.0
CMA / ARV
- ARV (on-the-fly)
- $213,192
- Comps found
- 1
Show comp detail 1 sale within ~0.75 mi
| Address | Dist | Beds/Ba | Sqft | Sold | Price | $/sf | Match |
|---|---|---|---|---|---|---|---|
| 13114 Brockway Blvd | 0.21mi | 3/2.0 (-1) | 1,378 (-9%) | 10mo | $194,900 | $141 | 62 |
Match score weights: distance 35% · size 25% · config 20% · recency 20%. Top-matched comps best support the ARV.
Projected returns pro-forma
-3.0% appreciation · 3.0% rent growth · sell at horizon
- IRR
- -3.8%
- Equity multiple
- 0.86×
- Total profit
- $-6,693
- Equity at exit
- $25,348
- IRR
- 5.9%
- Equity multiple
- 1.44×
- Total profit
- $20,917
- Equity at exit
- $14,698
Cash invested: $47,600 (down + closing). Projections, not guarantees.
Landlord ↔ Tenant lean methodology
- Overall (STATE)
- 62 Landlord-Friendly
- State Michigan
- 62 Landlord-Friendly · EVEN
- County
- — inherits STATE
- City
- — inherits STATE
ZIP-level market 49097
- Active inventory
- 141
- Price-to-rent
- 8.0×
Monthly cashflow live
- Estimated rent
- $1,767 medium interval (Pro) →
- Mortgage (P&I)
- −$891
- Tax from tax record
- −$105 /mo · $1,265/yr
- Insurance
- −$71
- HOA
- −$0
- Vacancy / Maint / Mgmt
- −$371
- Net cashflow
- $328
Break-even live
UW: 25.0% down · 7.5% · 30yr · 1.5% tax · 5.0% vac · 8.0% maint · 8.0% mgmt
Financing live
Cash to close
- Down payment
- $42,500
- Closing costs
- $5,100
- Reserves months
- —
- Total cash needed
- —
Loan-product check · same deal, 3 products live
Conventional
25% down · 7.5% · 30yr
- Down + closing
- —
- Monthly P&I
- —
- Monthly cashflow
- —
- DSCR
- —
- Eligible?
- —
Personal DTI + credit; lowest rate.
DSCR
20% down · 8.5% · 30yr
- Down + closing
- —
- Monthly P&I
- —
- Monthly cashflow
- —
- DSCR
- —
- Eligible?
- —
No personal income docs; deal must DSCR.
Hard money
10% down · 12.0% · 12mo
- Down + closing
- —
- Monthly P&I
- —
- Monthly cashflow
- —
- DSCR
- —
- Eligible?
- —
Short-term bridge; refi at stabilization.
Listing history 4 events
-
2026-06-01statusdays on market $170,000 Pending 3 DOM
-
2026-05-31days on market $170,000 Active 2 DOM
-
2026-05-30remarks 505-char remark
-
2026-05-30$170,000 Active 1 DOM
ⓘ Source: listings_history table (triggers on properties + properties_extension) + one-shot
backfill from property_details.listing_events for pre-trigger history.
Tax reassessment forecast MI · Partial reset (capped growth)
- Current annual tax
- $1,265 · $105/mo
- Projected year-2 tax
- $1,941 · $162/mo
- Expected delta
- +$677/yr (+$56/mo · 53.5%)
ⓘ Screening estimate from a state-policy table — verify with the county assessor before closing.
Climate risk First Street
- Flood 1/10 Low FEMA zone X (unshaded) · 0% chance over 30 yrs
- Wildfire 1/10 Low
- Heat 2/10 Low 7 d/yr ≥98°F today · 16 d/yr by 30 yrs out
- Wind 2/10 Low
- Air quality 2/10 Low 1 unhealthy d/yr today · 2 by 30 yrs out
Nearby sold comps map
Loading sold comps map…
Walkable amenities ~0.75 mi
Loading nearby amenities…
Taxation est. · year 1
- Rental income
- $21,201
- − Mortgage interest
- −$9,523
- − Property taxes
- −$1,265
- − Insurance
- −$850
- − Repairs & maintenance
- −$1,696
- − Management
- −$1,696
- − Depreciation
- −$4,945
- Taxable income
- $1,227
- Est. tax owed @ 24.0%
- −$294
- After-tax cash flow
- $3,642/yr
For passive investors: Depreciation is non-cash, so a rental often shows a tax loss while cash-flowing — sheltering income. Rental losses are passive: they offset passive income freely, and up to $25,000/yr can offset ordinary (W-2) income if you actively participate and your MAGI is under $100k (phasing out to $0 by $150k); unused losses carry forward. On sale, claimed depreciation is recaptured at up to 25%, and gains may owe capital-gains tax (a 1031 exchange can defer both). Figures are a year-1 estimate at your 24.0% rate — not tax advice; consult a CPA.
Schools (NCES district)
- District
- Vicksburg Community Schools
- NCES district ID
- 2634950
- Math proficiency
- 42% ▼ -10.00%
- Reading proficiency
- 56% ▼ -4.00%
- Median HH income
- $59,299
- Composite
- 42.79/100
- National rank
- #3146
- State rank
- #100 of 540 in MI
Livability — Vicksburg
- Score
- 76/100
- State rank
- #137
- US rank
- #3361
Category grades
Schools grade is shown separately in the Schools card above.
Census & demographics
- County
- Kalamazoo County · 224,317 people
- City population
- 11,754
- Metro
- Kalamazoo-Portage, MI
- Population (ZIP)
- 11,754
- Household income
- $88,208
- Rent vs Own
- Severe rent burden
- 110.0
Population outlook (Kalamazoo County) Hauer SSP2
- Today (2025)
- 280,982 people
- By 2030
- 292,068 · +3.9%
- By 2040
- 312,191 · +11.1%
- By 2050
- 331,196 · +17.9%
- By 2075
- 379,021 · +34.9%
- By 2100
- 396,579 · +41.1%
Race, ethnicity, and origin ACS 2023
- Neighborhood character
- Predominantly White (92%)
- Race & ethnicity
- White 92% Two or more races 5% Hispanic / Latino 2%
- Common ancestry
- Iranian 9% Romanian 3% Slovak 3%
- Foreign-born
- 1% · Canada
- Languages at home
- 97% English-only · Spanish 1% French/Haitian/Cajun 1%
Political lean MEDSL · Kalamazoo
- 2024 margin
- D (+17.7) · D 58.0% · R 40.3% · Other 1.7%
- 2008→2024 swing
- -1.8pp toward R · 2008: 19.5pp · 2024: 17.7pp
- All cycles
- 2024: D+17.7 2020: D+18.7 2016: D+12.8 2012: D+13.3 2008: D+19.5
Not yet ingested
- Civics
- —
Market trends
- HPI YoY
- ▼ -136.53%
- Current HPI
- 196.1338
- Rent YoY
- —
- Metro
- Kalamazoo-Portage, MI
- State GDP YoY
- ▲ 1.37%
- F500 in state
- 28
Industry mix (Fortune 500 HQ in MI)
| Industry | F500 HQs | Revenue |
|---|---|---|
| Automotive Parts | 3 | $48B |
|
||
| Automotive | 2 | $372B |
|
||
| Chemicals | 1 | $45B |
|
||
| Automotive Retail | 1 | $29B |
|
||
| Healthcare / Medical Devices | 1 | $23B |
|
||
| Automotive Technology | 1 | $20B |
|
||
Price history
+221.4% since first listed54 events — show timeline
- 2026-05-29 Listed $170,000 SW Michigan MLS
- 2026-05-29 Listed $170,000 MiRealSource-MiMLS
- 2026-05-29 Listed $170,000 REALCOMP
- 2023-12-07 Sold (Public Records) $129,900 Public Records
- 2023-11-28 Sold (MLS) $129,900 SW Michigan MLS
- 2023-11-28 Sold (MLS) $129,900 MiRealSource-MiMLS
- 2023-11-28 Sold (MLS) $129,900 REALCOMP
- 2023-09-21 Pending — REALCOMP
- 2023-09-21 Pending — MiRealSource-MiMLS
- 2023-09-21 Pending — SW Michigan MLS
- 2023-09-14 Price Changed $129,900 MiRealSource-MiMLS
- 2023-09-13 Price Changed $129,900 REALCOMP
- 2023-09-13 Price Changed $129,900 SW Michigan MLS
- 2023-09-07 Listed $139,900 SW Michigan MLS
- 2023-09-07 Listed $139,900 MiRealSource-MiMLS
- 2023-09-07 Listed $139,900 REALCOMP
- 2022-07-25 Sold (Public Records) $55,000 Public Records
- 2022-07-01 Sold (MLS) $55,000 SW Michigan MLS
- 2022-07-01 Sold (MLS) $55,000 REALCOMP
- 2022-05-27 Listed $55,000 MiRealSource-MiMLS
- 2022-05-27 Listed $55,000 SW Michigan MLS
- 2022-05-27 Listed $55,000 REALCOMP
- 2022-05-25 Listing Removed — REALCOMP
- 2022-05-25 Listing Removed — REALCOMP
- 2022-05-25 Listing Removed — REALCOMP
- 2022-05-25 Listing Removed — REALCOMP
- 2014-09-26 Listing Removed — SW Michigan MLS
- 2014-09-24 Listing Removed — SW Michigan MLS
- 2014-09-15 Listing Removed — SW Michigan MLS
- 2008-12-31 Listing Removed — REALCOMP
- 2008-09-29 Listed $65,000 REALCOMP
- 2008-09-29 Listed $65,000 SW Michigan MLS
- 2008-09-27 Listing Removed — REALCOMP
- 2008-06-27 Listed $69,900 REALCOMP
- 2008-06-27 Listed $69,900 SW Michigan MLS
- 2008-06-26 Listing Removed — REALCOMP
- 2008-04-07 Listing Removed — SW Michigan MLS
- 2008-04-07 Listed $69,900 REALCOMP
- 2008-04-07 Listed $69,900 SW Michigan MLS
- 2007-07-18 Listed $69,900 SW Michigan MLS
- 2007-07-18 Listed $69,900 REALCOMP
- 2006-11-13 Listing Removed — SW Michigan MLS
- 2006-09-18 Listed $89,900 SW Michigan MLS
- 2006-09-18 Listed $89,900 REALCOMP
- 2005-08-18 Sold (MLS) $38,900 REALCOMP
- 2005-08-18 Sold (MLS) $38,900 SW Michigan MLS
- 2005-07-01 Listed $38,900 REALCOMP
- 2005-07-01 Listed $38,900 SW Michigan MLS
- 2005-06-30 Listing Removed — SW Michigan MLS
- 2005-03-19 Listed $38,900 SW Michigan MLS
- 2005-03-19 Listed $38,900 REALCOMP
- 2005-03-15 Listing Removed — SW Michigan MLS
- 2005-01-06 Listed $52,900 SW Michigan MLS
- 2005-01-06 Listed $52,900 REALCOMP
Property tax history
+3.7%/yrLatest (2025): $1,265 · +7.0% YoY. Source: county tax records.
Cash-flow waterfall
monthlySold comps — $/sqft
last 12 mo · ≤1 miLoading sold comps…