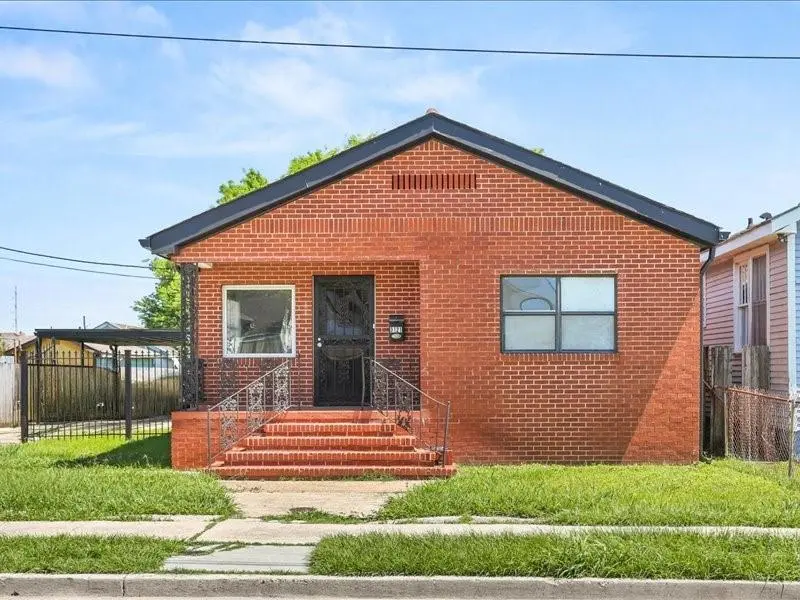
3121 N Galvez St · New Orleans, LA
Flood risk 8/10 · Major
- FEMA flood zone
- X (shaded)
- Chance of flooding over 30 yrs
- 0.6%
- Est. flood insurance / yr
- $507 – $1,088
Fire risk 1/10 · Minimal
- Est. fire insurance / yr
- $1,269 – $2,357
Heat risk 10/10 · Severe
- Hot days now (above 108°F)
- 7 days/yr
- Hot days in 30 yrs
- 21 days/yr
Wind risk 10/10 · Severe
- Chance of severe wind over 30 yrs
- 99.0%
Air-quality risk 3/10 · Minor
- Unhealthy air days now
- 3 days/yr
- Unhealthy air days in 30 yrs
- 3 days/yr
Risk factors via First Street. Map © Google.
Why this score? — see what drove the C grade
The composite is a weighted blend of 9 inputs, each scored 0–100. Each bar is that input's sub-score; the figure is the points it added to the 100-point composite (weight × sub-score).
- Cash flow +19.7/30.0
- ARV discount +15.0/15.0
- DSCR +6.2/10.0
- 1% rule +4.5/10.0
- Livability +4.0/5.0
- Rent growth +3.1/5.0
- Condition / age +2.5/5.0
- Schools +1.6/10.0
- Appreciation +0.0/10.0
$265,000
🖨 Deal sheet 📄 Offer letter ✓ Due diligence
Listing remarks MLS
Money-Making Double in the Heart of New Orleans! This fantastic income-producing property features a spacious 3-bedroom, 2-bath owner's unit alongside a 1-bedroom, 1-bath unit--perfect for generating rental income. Live in the larger unit while the second unit helps cover your mortgage! Situated on a large oversized lot, this property also offers plenty of parking--an added bonus in the city. Don't miss this opportunity to own and earn at the same time!
Key facts
- Parking
- Built 1949
- Listed 44 days
Property features AI
Finance
- Financial info: Two-unit property; tenants pay electricity, gas, and water
Exterior
- Parking: Driveway
- Utilities: Public water; Public sewer
- Home design: Single-story home
- Construction: Shingle roof; Raised foundation; Property in very good condition
- Exterior features: Porch; City lot; Rectangular lot; Lot dimensions approximately 57 x 171
Interior
- Bathrooms: 3 full bathrooms
- Heating & cooling: Central heating; Central air conditioning
- Interior features: Porch
Neighborhood map
What this means for you Summary
Snapshot
- This is a 3-bed/2.0-bath single-family listed at $265k.
Deal economics
- At list price, monthly cash flow is $242 ($3k/yr) — positive.
- The deal already cash-flows at list — no discount required.
- To meet the 1% rule (rent ≥ 1% of price), the offer needs to be $253k (4.5% below list).
- Recommended offer: $253k (4.5% below list) — sets the bar for 1% rule.
- Cap rate 7.7% vs local median 4.4% in New Orleans — top-decile yield for the area; either an underpriced asset or a hidden risk that comps aren't pricing in. Stress-test before assuming the spread holds.
Location & tenants
- Location reads 81/100 on livability (#3 in LA, #1,383 nationally) — a professional / high-income tenant draw. Strengths: amenities A+, commute A+, health & safety A+; Watch: crime C-, employment D.
- Orleans Parish (urban): math 11% / reading 27% proficiency, ranked #69 of 98 in LA (top 70%) — low school quality limits family demand, transient renter base, plan for 1-2y turnover; 68% free/reduced lunch — lower-income household profile, screen leases tightly.
- Market conditions: Rents rising (+2.5%/yr); 581 active listings in the ZIP; 27 comparable units currently listed for rent nearby; rentals at typical pace (median 24d on market — plan ~3-4 weeks tenant-placement turnaround); 710 units permitted in Orleans Parish in 2024 (244 in 5+ unit buildings).
- At $2,530/mo this rent would consume 66% of the median local household income ($46k/yr) (locally 1988% of renters already pay >50% of income on rent) — very limited rent-growth headroom before tenants either downsize or default.
Forward outlook
- Local home prices are declining (-3.0%/yr); year-one equity from $2k of loan paydown is wiped out by about $8k of value loss. Plan a longer hold.
- Orleans County population projected at +61% by 2050 — long-run rental-demand tailwind backs the buy-and-hold thesis.
Negotiation context
- It's been on market 44 days — a 3% lower offer ($257k) is reasonable based on typical stale-listing flexibility.
- 7 sale attempts since 7y ago with the ask held roughly flat each time — persistent listings suggest the price (not the market) is what's stuck; bring a comps-based counter.
- Current owner paid $210k; 26% above their basis — modest negotiation headroom, anchor on the comps not their cost.
Risks & watch-outs
- Watch-outs: flood insurance adds $66/mo; built in 1949 — expect roof / HVAC / electrical / plumbing capex.
- Climate carrying-cost: severe flood risk; severe wind risk, 99% chance of damaging wind over 30y; extreme-heat days projected 7→21/yr by 2055 (HVAC capex compounding) — expect insurance premiums to compound above CPI over the hold.
Questions for the listing agent
- It's been on market 44 days. Have you received any prior offers? Is the seller open to a 5% concession, seller financing, or rate buy-down credit?
- Built in 1949 — when were the roof, HVAC, electrical panel, plumbing, and water heater last replaced?
- What's the actual annual flood-insurance premium (NFIP or private), and is the property in a SFHA with mandatory coverage?
- Is there a deadline driving the sale (1031 exchange, divorce, estate, relocation)? That informs how much negotiation room exists.
- What's the average days-on-market for RENTAL listings here right now (not sales)? A rising rental-DOM trend means longer vacancies and softer asking-rent achievability than the comps imply.
- What's the recent tenant-quality profile in this submarket — average credit score on applications, eviction rate, late-payment / NSF rate, and stable-employment percentage? A property-management company in the area should have these aggregated.
- How much new for-sale + rental construction is in the pipeline within 1–3 miles? Heavy new supply typically softens prices + rents 12–24 months out; constrained supply supports both.
Investment metrics
- 1% rule
- 0.95% ✗
- Cap rate
- 7.69%
- Cash-on-cash
- 4.98%
- DSCR
- 1.22
- GRM
- 8.7
CMA / ARV
- ARV (median comp)
- $345,985
- List price
- $265,000
- Delta
- -23.41%
- Verdict
- UNDERPRICED
- Comps
- 20 within 1.0 mi
Show comp detail 8 sales within ~0.75 mi
| Address | Dist | Beds/Ba | Sqft | Sold | Price | $/sf | Match |
|---|---|---|---|---|---|---|---|
| 2004 Louisa St | 0.10mi | 4/2.5 (+1) | 2,132 (-11%) | 1mo | $240,000 | $113 | 69 |
| 1332 Gallier St | 0.60mi | 3/2.5 | 2,294 (-4%) | 2mo | $422,000 | $184 | 62 |
| 2933 St Claude Ave | 0.74mi | 4/3.0 (+1) | 2,352 (-2%) | 7mo | $250,000 | $106 | 48 |
| 1622 Painters St | 0.58mi | 4/2.0 (+1) | 2,200 (-8%) | 14mo | $245,000 | $111 | 43 |
| 1929 Franklin Ave | 0.45mi | 4/3.0 (+1) | 2,067 (-14%) | 9mo | $200,000 | $97 | 40 |
| 1212 Louisa St | 0.66mi | 3/3.0 | 2,674 (+12%) | 9mo | $485,000 | $181 | 38 |
| 3145 Urquhart St | 0.59mi | 4/3.5 (+1) | 2,160 (-10%) | 19mo | $430,000 | $199 | 30 |
| 3001 Clouet St | 0.73mi | 4/2.0 (+1) | 2,059 (-14%) | 15mo | $90,000 | $44 | 25 |
Match score weights: distance 35% · size 25% · config 20% · recency 20%. Top-matched comps best support the ARV.
Projected returns pro-forma
-3.0% appreciation · 2.49% rent growth · sell at horizon
- IRR
- -10.7%
- Equity multiple
- 0.61×
- Total profit
- $-28,843
- Equity at exit
- $39,512
- IRR
- -2.1%
- Equity multiple
- 0.86×
- Total profit
- $-10,565
- Equity at exit
- $22,912
Cash invested: $74,200 (down + closing). Projections, not guarantees.
Landlord ↔ Tenant lean methodology
- Overall (STATE)
- 90 Strongly Landlord-Friendly
- State Louisiana
- 90 Strongly Landlord-Friendly · R+12
- County
- — inherits STATE
- City
- — inherits STATE
ZIP-level market 70117
- Rents YoY
- 2.5%
- Active inventory
- 581
- Price-to-rent
- 8.7×
Monthly cashflow live
- Estimated rent
- $2,530 high interval (Pro) →
- Mortgage (P&I)
- −$1,390
- Tax from tax record
- −$191 /mo · $2,289/yr
- Insurance
- −$110
- Flood insurance flood zone
- −$66 /mo · $798/yr
- HOA
- −$0
- Vacancy / Maint / Mgmt
- −$531
- Net cashflow
- $242
Break-even live
UW: 25.0% down · 7.5% · 30yr · 1.5% tax · 5.0% vac · 8.0% maint · 8.0% mgmt
Financing live
Cash to close
- Down payment
- $66,250
- Closing costs
- $7,950
- Reserves months
- —
- Total cash needed
- —
Loan-product check · same deal, 3 products live
Conventional
25% down · 7.5% · 30yr
- Down + closing
- —
- Monthly P&I
- —
- Monthly cashflow
- —
- DSCR
- —
- Eligible?
- —
Personal DTI + credit; lowest rate.
DSCR
20% down · 8.5% · 30yr
- Down + closing
- —
- Monthly P&I
- —
- Monthly cashflow
- —
- DSCR
- —
- Eligible?
- —
No personal income docs; deal must DSCR.
Hard money
10% down · 12.0% · 12mo
- Down + closing
- —
- Monthly P&I
- —
- Monthly cashflow
- —
- DSCR
- —
- Eligible?
- —
Short-term bridge; refi at stabilization.
Rent comps 27 comps
| Address | Beds | Baths | Sqft | Rent | $/sqft | DOM | Units | Dist |
|---|---|---|---|---|---|---|---|---|
| 1835 Louisa St New Orleans, LA | 3.0 | 2.5 | 1800 | $2,350 | $1.31 | 3d | 1 | 0.19mi |
| 1928 Franklin Ave New Orleans, LA | 2.0 | 2.5 | 2840 | $2,500 | $0.88 | 10d | 1 | 0.52mi |
| 1231 Feliciana St New Orleans, LA | 3.0 | 2.5 | 1869 | $2,750 | $1.47 | 43d | 1 | 0.65mi |
| 1325 Pauline St New Orleans, LA | 3.0 | 2.0 | 1792 | $2,250 | $1.26 | 3d | 1 | 0.69mi |
| 1325 Pauline St New Orleans, LA | 3.0 | 2.0 | 1792 | $2,250 | $1.26 | 2d | 1 | 0.69mi |
| 1323 Pauline St New Orleans, LA | 3.0 | 2.0 | 1792 | $2,250 | $1.26 | 3d | 1 | 0.69mi |
| 2228 Arts St New Orleans, LA | 3.0 | 2.0 | 2270 | $1,675 | $0.74 | 3d | 1 | 0.69mi |
| 3221 Saint Claude Ave New Orleans, LA | 3.0 | 1.0 | 1900 | $1,650 | $0.87 | 23d | 1 | 0.73mi |
| 1038 Montegut St New Orleans, LA | 3.0 | 2.5 | 2250 | $4,200 | $1.87 | 23d | 1 | 0.80mi |
| 1038 Montegut St New Orleans, LA | 3.0 | 2.5 | 2250 | $4,200 | $1.87 | 43d | 1 | 0.80mi |
| 1403 Lesseps St New Orleans, LA | 3.0 | 3.0 | 1700 | $1,800 | $1.06 | 11d | 1 | 0.86mi |
| 3134 Burgundy St New Orleans, LA | 3.0 | 2.0 | 1887 | $2,900 | $1.54 | 23d | 1 | 0.93mi |
| 3302 Metropolitan St New Orleans, LA | 4.0 | 2.5 | 1700 | $2,200 | $1.29 | 17d | 1 | 0.95mi |
| 2107 Elysian Fields Ave New Orleans, LA | 4.0 | 2.0 | 1794 | $1,650 | $0.92 | 3d | 1 | 1.04mi |
| 3400 Royal St New Orleans, LA | 4.0 | 3.5 | 3300 | $6,900 | $2.09 | 43d | 1 | 1.08mi |
| 639 Desire St New Orleans, LA | 3.0 | 2.5 | 2687 | $5,500 | $2.05 | 19d | 1 | 1.09mi |
| 740 Mazant St New Orleans, LA | 2.0 | 2.0 | 1750 | $2,200 | $1.26 | 23d | 1 | 1.12mi |
| 2317 N Rampart St Unit 1272378P New Orleans, LA | 3.0–6.0 | 2.0–4.0 | 1581 | $2,165 | $1.37 | 3d | 2 | 1.14mi |
| 2320 N Rampart St New Orleans, LA | 3.0 | 3.0 | 2317 | $3,700 | $1.60 | 43d | 1 | 1.15mi |
| 522 Montegut St New Orleans, LA | 1.0–2.0 | 1.0–2.0 | 1256 | $3,500 | $2.79 | 1d | 12 | 1.16mi |
| 1837 Touro St New Orleans, LA | 3.0 | 1.0 | 1994 | $2,000 | $1.00 | 23d | 1 | 1.19mi |
| 1136 Frenchmen St New Orleans, LA | 2.0 | 1.0 | 1800 | $1,650 | $0.92 | 23d | 1 | 1.26mi |
| 2920 Pauger St New Orleans, LA | 4.0 | 2.0 | 1882 | $1,995 | $1.06 | 23d | 1 | 1.30mi |
| 1938 N Johnson St Unit 38 New Orleans, LA | 3.0 | 2.0 | 1844 | $2,400 | $1.30 | 23d | 1 | 1.34mi |
| 1936 N Johnson St Unit 36 New Orleans, LA | 3.0 | 2.0 | 1844 | $2,400 | $1.30 | 23d | 1 | 1.34mi |
| 3718 Franklin Ave New Orleans, LA | 2.0 | 1.0 | 1601 | $1,800 | $1.12 | 11d | 1 | 1.46mi |
| 1860 Burgundy St New Orleans, LA | 4.0 | 4.0 | 3000 | $3,500 | $1.17 | 23d | 1 | 1.47mi |
Listing history 28 events
-
2026-06-18days on market $265,000 Active 44 DOM
-
2026-06-17days on market $265,000 Active 43 DOM
-
2026-06-16days on market $265,000 Active 42 DOM
-
2026-06-15days on market $265,000 Active 41 DOM
-
2026-06-13days on market $265,000 Active 39 DOM
-
2026-06-10days on market $265,000 Active 36 DOM
-
2026-06-09days on market $265,000 Active 35 DOM
-
2026-06-08days on market $265,000 Active 34 DOM
-
2026-06-07days on market $265,000 Active 33 DOM
-
2026-06-05days on market $265,000 Active 30 DOM
-
2026-06-03days on market $265,000 Active 29 DOM
-
2026-06-02days on market $265,000 Active 28 DOM
-
2026-06-01days on market $265,000 Active 27 DOM
-
2026-05-31days on market $265,000 Active 26 DOM
-
2026-05-05$265,000 Active 457-char remark
Show marketing remark (457 chars)
Money-Making Double in the Heart of New Orleans! This fantastic income-producing property features a spacious 3-bedroom, 2-bath owner's unit alongside a 1-bedroom, 1-bath unit--perfect for generating rental income. Live in the larger unit while the second unit helps cover your mortgage! Situated on a large oversized lot, this property also offers plenty of parking--an added bonus in the city. Don't miss this opportunity to own and earn at the same time!
-
2026-05-05$265,000 Active 479-char remark
Show marketing remark (457 chars)
Money-Making Double in the Heart of New Orleans! This fantastic income-producing property features a spacious 3-bedroom, 2-bath owner's unit alongside a 1-bedroom, 1-bath unit--perfect for generating rental income. Live in the larger unit while the second unit helps cover your mortgage! Situated on a large oversized lot, this property also offers plenty of parking--an added bonus in the city. Don't miss this opportunity to own and earn at the same time!
-
2025-12-14$269,000 Active
-
2025-04-29historical $2,250
-
2025-03-17$2,250
-
2020-09-09soldstatus $210,000
-
2020-09-08soldstatus $210,000 Closed
-
2020-08-25status Pending
-
2020-03-08$210,000 Active
-
2020-03-08$210,000
-
2019-08-28price $184,000
-
2019-02-19$184,000
-
2009-07-30soldstatus $75,000
-
1978-01-27soldstatus $41,000
ⓘ Source: listings_history table (triggers on properties + properties_extension) + one-shot
backfill from property_details.listing_events for pre-trigger history.
Tax reassessment forecast LA · Resets to sale price
- Current annual tax
- $2,289 · $191/mo
- Projected year-2 tax
- $2,289 · $191/mo
- Expected delta
- $0/yr ($0/mo · 0.0%)
ⓘ Screening estimate from a state-policy table — verify with the county assessor before closing.
Climate risk First Street
- Flood 8/10 Severe FEMA zone X (shaded) · 60% chance over 30 yrs
- Wildfire 1/10 Low
- Heat 10/10 Extreme 7 d/yr ≥108°F today · 21 d/yr by 30 yrs out
- Wind 10/10 Extreme 99% chance of damaging wind over 30 yrs
- Air quality 3/10 Moderate 3 unhealthy d/yr today · 3 by 30 yrs out
Nearby sold comps map
Loading sold comps map…
Walkable amenities ~0.75 mi
Loading nearby amenities…
Taxation est. · year 1
- Rental income
- $30,366
- − Mortgage interest
- −$14,844
- − Property taxes
- −$2,289
- − Insurance
- −$2,122
- − Repairs & maintenance
- −$2,429
- − Management
- −$2,429
- − Depreciation
- −$7,709
- Taxable loss
- −$1,457
- Est. tax savings @ 24.0%
- +$350
- After-tax cash flow
- $3,251/yr
For passive investors: Depreciation is non-cash, so a rental often shows a tax loss while cash-flowing — sheltering income. Rental losses are passive: they offset passive income freely, and up to $25,000/yr can offset ordinary (W-2) income if you actively participate and your MAGI is under $100k (phasing out to $0 by $150k); unused losses carry forward. On sale, claimed depreciation is recaptured at up to 25%, and gains may owe capital-gains tax (a 1031 exchange can defer both). Figures are a year-1 estimate at your 24.0% rate — not tax advice; consult a CPA.
Schools (NCES district)
- District
- Orleans Parish
- NCES district ID
- 2201170
- Math proficiency
- 11% ▼ -52.00%
- Reading proficiency
- 27% ▼ -46.00%
- Median HH income
- $37,011
- Composite
- 15.78/100
- National rank
- #9271
- State rank
- #69 of 98 in LA
Livability — New Orleans
- Score
- 81/100
- State rank
- #3
- US rank
- #1383
Category grades
Schools grade is shown separately in the Schools card above.
Census & demographics
- Census place
- New Orleans, LA
- County
- Orleans Parish · 338,817 people
- City population
- 338,817
- Metro
- New Orleans-Metairie, LA
- Population (ZIP)
- 25,652
- Household income
- $45,764
- Rent vs Own
- Severe rent burden
- 1988.0
Population outlook (Orleans County) Hauer SSP2
- Today (2025)
- 513,025 people
- By 2030
- 575,781 · +12.2%
- By 2040
- 700,174 · +36.5%
- By 2050
- 826,541 · +61.1%
- By 2075
- 1,123,374 · +119.0%
- By 2100
- 1,355,609 · +164.2%
Race, ethnicity, and origin ACS 2023
- Neighborhood character
- Majority Black (60%)
- Race & ethnicity
- Black 60% White 30% Two or more races 6% Hispanic / Latino 5%
- Common ancestry
- Lithuanian 5% Italian 1% Romanian 1%
- Foreign-born
- 5% · Canada, South Korea
- Languages at home
- 93% English-only · Spanish 3% Other Indo-European 1% French/Haitian/Cajun 1%
Political lean MEDSL · Orleans
- 2024 margin
- Solid D (+67.0) · D 82.2% · R 15.2% · Other 2.7%
- 2008→2024 swing
- +6.7pp toward D · 2008: 60.3pp · 2024: 67.0pp
- All cycles
- 2024: D+67.0 2020: D+68.2 2016: D+66.2 2012: D+62.5 2008: D+60.3
Not yet ingested
- Civics
- —
Market trends
- HPI YoY
- ▼ -177.22%
- Current HPI
- 184.6061
- Rent YoY
- ▲ 2.49%
- Metro
- New Orleans-Metairie, LA
- State GDP YoY
- ▲ 3.29%
- F500 in state
- 10
Industry mix (Fortune 500 HQ in LA)
| Industry | F500 HQs | Revenue |
|---|---|---|
| Telecommunications | 2 | $23B |
|
||
| Utilities | 1 | $12B |
|
||
| Wholesale / Distribution | 1 | $5B |
|
||
| Advertising | 1 | $2B |
|
||
Price history
+546.3% since first listed14 events — show timeline
- 2026-05-05 Listed $265,000 GSREIN
- 2026-05-05 Listed $265,000 AcadianaMLS
- 2025-12-14 Listed $269,000 AcadianaMLS
- 2025-04-29 Rental Removed $2,250 GSREIN
- 2025-03-17 Listed for Rent $2,250 GSREIN
- 2020-09-09 Sold (Public Records) $210,000 Public Records
- 2020-09-08 Sold (MLS) $210,000 GSREIN
- 2020-08-25 Pending — GSREIN
- 2020-03-08 Listed $210,000 AcadianaMLS
- 2020-03-08 Listed $210,000 GSREIN
- 2019-08-28 Price Changed $184,000 GSREIN
- 2019-02-19 Listed $184,000 AcadianaMLS
- 2009-07-30 Sold (Public Records) $75,000 Public Records
- 1978-01-27 Sold (Public Records) $41,000 Public Records
Property tax history
+40.6%/yrLatest (2026): $2,289 · +26.3% YoY. Source: county tax records.
Cash-flow waterfall
monthlySold comps — $/sqft
last 12 mo · ≤1 miLoading sold comps…