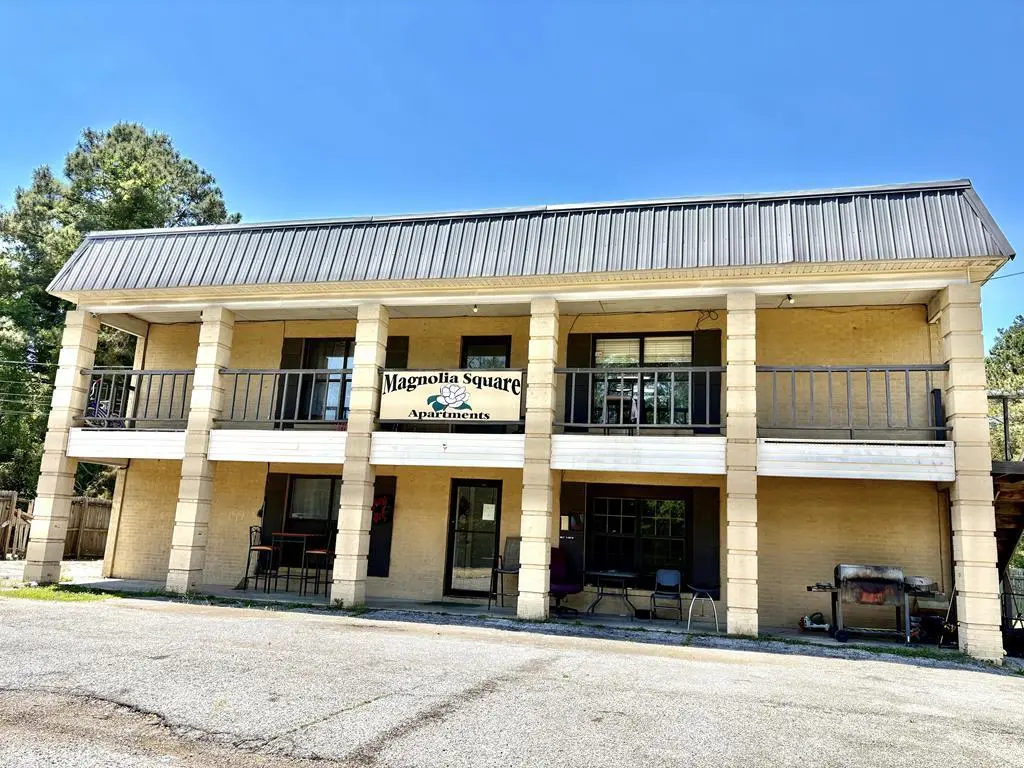
 Fourplex
823 N Main St · Calhoun City, MS
Flood risk 1/10 · Minimal
- FEMA flood zone
- X (unshaded)
- Chance of flooding over 30 yrs
- 0.0%
- Est. flood insurance / yr
- $507 – $1,088
Fire risk 3/10 · Minor
- Est. fire insurance / yr
- $1,241 – $2,305
Heat risk 7/10 · Major
- Hot days now (above 109°F)
- 7 days/yr
- Hot days in 30 yrs
- 21 days/yr
Wind risk 6/10 · Moderate
- Chance of severe wind over 30 yrs
- 27.0%
Air-quality risk 2/10 · Minimal
- Unhealthy air days now
- 0 days/yr
- Unhealthy air days in 30 yrs
- 1 days/yr
Risk factors via First Street. Map © Google.
Why this score? — see what drove the B- grade
The composite is a weighted blend of 9 inputs, each scored 0–100. Each bar is that input's sub-score; the figure is the points it added to the 100-point composite (weight × sub-score).
- Cash flow +30.0/30.0
- 1% rule +10.0/10.0
- DSCR +10.0/10.0
- ARV discount +7.5/15.0
- Livability +3.1/5.0
- Rent growth +2.5/5.0
- Condition / age +2.5/5.0
- Schools +2.3/10.0
- Appreciation +0.4/10.0
$175,000
🖨 Deal sheet 📄 Offer letter ✓ Due diligence
Multi-family units
County records classify this as Multi-Family (5+ Unit). Listing-text estimate: 4 units. estimate disagrees with records
5+ unit building — per-unit beds/baths from public records are typically unavailable; the breakdown below (if shown) is an estimate from the listing text.
Listing remarks
Investment opportunity! This 4-unit apartment complex offers immediate income potential with strong rental demand. Each unit provides comfortable living space and functional layouts, making this property attractive to long-term tenants. Whether you're looking to expand your investment portfolio or purchase your first multifamily property, this complex offers an excellent opportunity for cash flow and future appreciation. Multifamily properties of this size are increasingly difficult to find, making this a great addition to any investment strategy. Don't miss the chance to own a proven income-producing property with upside potential through rental increases and continued market growth. Conta
Key facts
- 0.3 acre lot
- Built 1992
- Listed 4 days
Property features AI
Finance
- Other: Zoning: Other; Lot size approximately 0.3 acre
Exterior
- Utilities: Public water; Public sewer
- Home design: Residential income property; Multi-family
- Construction: Brick construction; Slab foundation
- Exterior features: Metal roof
Interior
- Heating & cooling: Central heating (natural gas); Central air conditioning
- Interior features: Gas water heater; Central heating (natural gas); Central air conditioning
Neighborhood map
What this means for you Summary
Snapshot
- This is a 4 × 2-bed/1-bath units multifamily listed at $175k.
Deal economics
- At list price, monthly cash flow is $1k ($15k/yr) — positive. Per door: $317/mo.
- The deal already cash-flows at list — no discount required.
- Meets the 1% rule at list price ($3k rent vs $175k).
Location & tenants
- Location reads 62/100 on livability (#170 in MS) — a middle-class / working-renter tenant base. Strengths: crime A+, cost of living A+, housing A-; Watch: health & safety D+, schools F, amenities F.
- Calhoun County School District (rural): math 28% / reading 29% proficiency, ranked #75 of 130 in MS (top 58%) — low school quality limits family demand, transient renter base, plan for 1-2y turnover; 69% free/reduced lunch — lower-income household profile, screen leases tightly.
- Market conditions: 25 active listings in the ZIP; 10 units permitted in Calhoun County in 2024 (0 in 5+ unit buildings).
Forward outlook
- Local home prices are declining (-3.0%/yr); year-one equity from $1k of loan paydown is wiped out by about $5k of value loss. Plan a longer hold.
- Calhoun County population projected at -19% by 2050 — secular population decline; favor cash flow + early exit over multi-decade hold.
- At projected returns (-3.0% appreciation + 3.0% rent growth), your $49k cash investment doubles in ~4 years — after that, you're playing with house money.
Negotiation context
- Only 4 days on market — expect competitive offers; lowballing is unlikely to land.
Risks & watch-outs
- Climate carrying-cost: major wind risk, 27% chance of damaging wind over 30y; extreme-heat days projected 7→21/yr by 2055 (HVAC capex compounding) — expect insurance premiums to compound above CPI over the hold.
Questions for the listing agent
- Can we see the unit-by-unit rent roll, current vacancy, and any below-market leases? What's the average tenancy length?
- What capital expenditures (roof, boiler, parking lot, exteriors) have been made in the last 5 years, and what's planned in the next 2?
- Is there a deadline driving the sale (1031 exchange, divorce, estate, relocation)? That informs how much negotiation room exists.
- Schools are F-rated, which usually means shorter tenancies and higher turnover. Who's the typical renter profile here, and what's been the actual vacancy rate?
- What's the average days-on-market for RENTAL listings here right now (not sales)? A rising rental-DOM trend means longer vacancies and softer asking-rent achievability than the comps imply.
- What's the recent tenant-quality profile in this submarket — average credit score on applications, eviction rate, late-payment / NSF rate, and stable-employment percentage? A property-management company in the area should have these aggregated.
- How much new apartment / multifamily construction is in the pipeline within 1–3 miles? Heavy new supply (>2% of stock underway) typically softens rents 12–24 months out; light construction supports rent growth.
Investment metrics
- 1% rule
- 1.80% ✓
- Cap rate
- 14.99%
- Cash-on-cash
- 31.05%
- DSCR
- 2.38
- GRM
- 4.6
CMA / ARV
No comps found within radius.
Projected returns pro-forma
-3.0% appreciation · 3.0% rent growth · sell at horizon
- IRR
- 25.9%
- Equity multiple
- 2.07×
- Total profit
- $52,459
- Equity at exit
- $26,093
- IRR
- 33.6%
- Equity multiple
- 4.06×
- Total profit
- $149,901
- Equity at exit
- $15,131
Cash invested: $49,000 (down + closing). Projections, not guarantees.
Landlord ↔ Tenant lean methodology
- Overall (STATE)
- 90 Strongly Landlord-Friendly
- State Mississippi
- 90 Strongly Landlord-Friendly · R+11
- County
- — inherits STATE
- City
- — inherits STATE
ZIP-level market 38916
- Home prices YoY
- -5.3%
- Active inventory
- 25
- Price-to-rent
- 18.5×
Monthly cashflow live
- Estimated rent
- $3,154 medium interval (Pro) →
- Mortgage (P&I)
- −$918
- Tax from tax record
- −$233 /mo · $2,796/yr
- Insurance
- −$73
- HOA
- −$0
- Vacancy / Maint / Mgmt
- −$662
- Net cashflow
- $1,268
Break-even live
4-unit breakdown (identical units grouped — click to expand)
| Units | Beds | Baths | Est. rent |
|---|---|---|---|
| 4× units | 2 | 1 | $3,156 |
| #1 | 2 | 1 | $789 |
| #2 | 2 | 1 | $789 |
| #3 | 2 | 1 | $789 |
| #4 | 2 | 1 | $789 |
| Total (4 units) | $3,154 | ||
UW: 25.0% down · 7.5% · 30yr · 1.5% tax · 5.0% vac · 8.0% maint · 8.0% mgmt
Financing live
Cash to close
- Down payment
- $43,750
- Closing costs
- $5,250
- Reserves months
- —
- Total cash needed
- —
Loan-product check · same deal, 3 products live
Conventional
25% down · 7.5% · 30yr
- Down + closing
- —
- Monthly P&I
- —
- Monthly cashflow
- —
- DSCR
- —
- Eligible?
- —
Personal DTI + credit; lowest rate.
DSCR
20% down · 8.5% · 30yr
- Down + closing
- —
- Monthly P&I
- —
- Monthly cashflow
- —
- DSCR
- —
- Eligible?
- —
No personal income docs; deal must DSCR.
Hard money
10% down · 12.0% · 12mo
- Down + closing
- —
- Monthly P&I
- —
- Monthly cashflow
- —
- DSCR
- —
- Eligible?
- —
Short-term bridge; refi at stabilization.
Listing history 4 events
-
2026-06-07statusdays on market $175,000 Pending 4 DOM
-
2026-06-05days on market $175,000 Active 3 DOM
-
2026-06-02remarks 699-char remark
-
2026-06-02$175,000 Active 1 DOM
ⓘ Source: listings_history table (triggers on properties + properties_extension) + one-shot
backfill from property_details.listing_events for pre-trigger history.
Tax reassessment forecast MS · Resets to sale price
- Current annual tax
- $2,796 · $233/mo
- Projected year-2 tax
- $2,796 · $233/mo
- Expected delta
- $0/yr ($0/mo · 0.0%)
ⓘ Screening estimate from a state-policy table — verify with the county assessor before closing.
Climate risk First Street
- Flood 1/10 Low FEMA zone X (unshaded) · 0% chance over 30 yrs
- Wildfire 3/10 Moderate
- Heat 7/10 Severe 7 d/yr ≥109°F today · 21 d/yr by 30 yrs out
- Wind 6/10 Major 27% chance of damaging wind over 30 yrs
- Air quality 2/10 Low 0 unhealthy d/yr today · 1 by 30 yrs out
Nearby sold comps map
Loading sold comps map…
Walkable amenities ~0.75 mi
Loading nearby amenities…
Taxation est. · year 1
- Rental income
- $37,848
- − Mortgage interest
- −$9,803
- − Property taxes
- −$2,796
- − Insurance
- −$875
- − Repairs & maintenance
- −$3,028
- − Management
- −$3,028
- − Depreciation
- −$5,091
- Taxable income
- $13,228
- Est. tax owed @ 24.0%
- −$3,175
- After-tax cash flow
- $12,042/yr
For passive investors: Depreciation is non-cash, so a rental often shows a tax loss while cash-flowing — sheltering income. Rental losses are passive: they offset passive income freely, and up to $25,000/yr can offset ordinary (W-2) income if you actively participate and your MAGI is under $100k (phasing out to $0 by $150k); unused losses carry forward. On sale, claimed depreciation is recaptured at up to 25%, and gains may owe capital-gains tax (a 1031 exchange can defer both). Figures are a year-1 estimate at your 24.0% rate — not tax advice; consult a CPA.
Schools (NCES district)
- District
- Calhoun County School District
- NCES district ID
- 2800870
- Math proficiency
- 28% ▼ -12.00%
- Reading proficiency
- 29% ▼ -9.00%
- Median HH income
- $30,951
- Composite
- 23.14/100
- National rank
- #7952
- State rank
- #75 of 130 in MS
Livability — Calhoun City
- Score
- 62/100
- State rank
- #170
- US rank
- #16258
Category grades
Schools grade is shown separately in the Schools card above.
Census & demographics
- Census place
- Calhoun City, MS
- Population (ZIP)
- 4,488
Population outlook (Calhoun County) Hauer SSP2
- Today (2025)
- 14,108 people
- By 2030
- 13,650 · -3.2%
- By 2040
- 12,586 · -10.8%
- By 2050
- 11,417 · -19.1%
- By 2075
- 8,381 · -40.6%
- By 2100
- 5,478 · -61.2%
Race, ethnicity, and origin ACS 2023
- Neighborhood character
- Majority White (58%)
- Race & ethnicity
- White 58% Black 38% Hispanic / Latino 3% Two or more races 1%
- Foreign-born
- 1% · Canada
- Languages at home
- 98% English-only · Spanish 2%
Political lean MEDSL · Calhoun
- 2024 margin
- Solid R (+48.0) · D 25.6% · R 73.6%
- 2008→2024 swing
- -20.3pp toward R · 2008: -27.7pp · 2024: -48.0pp
- All cycles
- 2024: R+48.0 2020: R+41.3 2016: R+39.1 2012: R+27.3 2008: R+27.7
Not yet ingested
- Civics
- —
Market trends
- HPI YoY
- ▼ -9.21%
- Current HPI
- 163.47
- Rent YoY
- —
- Metro
- —
- State GDP YoY
- —
- F500 in state
- 0
Price history
2 events — show timeline
- 2026-06-01 Listed $175,000 NCMBR
- 2008-05-16 Sold (Public Records) — Public Records
Property tax history
+4.1%/yrLatest (2025): $2,796 · +2.4% YoY. Source: county tax records.
Cash-flow waterfall
monthlySold comps — $/sqft
last 12 mo · ≤1 miLoading sold comps…