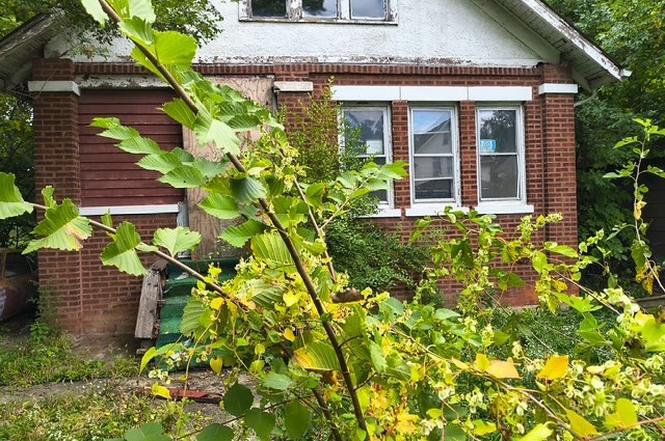
15727 Turlington Ave · Harvey, IL
Flood risk 4/10 · Minor
- FEMA flood zone
- X (unshaded)
- Chance of flooding over 30 yrs
- 0.22%
- Est. flood insurance / yr
- $473 – $860
Fire risk 1/10 · Minimal
- Est. fire insurance / yr
- $804 – $1,492
Heat risk 3/10 · Minor
- Hot days now (above 102°F)
- 7 days/yr
- Hot days in 30 yrs
- 15 days/yr
Wind risk 2/10 · Minimal
- Chance of severe wind over 30 yrs
- —
Air-quality risk 4/10 · Minor
- Unhealthy air days now
- 4 days/yr
- Unhealthy air days in 30 yrs
- 5 days/yr
Risk factors via First Street. Map © Google.
Why this score? — see what drove the C- grade
The composite is a weighted blend of 9 inputs, each scored 0–100. Each bar is that input's sub-score; the figure is the points it added to the 100-point composite (weight × sub-score).
- Cash flow +15.0/30.0
- Appreciation +10.0/10.0
- ARV discount +7.5/15.0
- 1% rule +5.0/10.0
- DSCR +5.0/10.0
- Livability +3.4/5.0
- Rent growth +2.5/5.0
- Condition / age +2.5/5.0
- Schools +0.7/10.0
$35,000
🖨 Deal sheet (PDF) 📄 Offer letter ✓ Due diligence
Listing remarks
Bring your vision to this 4-bedroom, 2-bath home in Harvey, ready for a full transformation. The interior has already been gutted, offering a blank slate for your next project. Features include an unfinished basement and a detached garage that will need repairs. Convenient layout with generous bedroom count and solid potential throughout. Sold AsIs. Buyer responsible for village requirements.
Key facts
- Unfinished basement
- Detached garage
- 2 garage spots
Tags
Property features AI
Finance
- Other: Possession at closing or immediate; Earnest money is held; Directions provided: Turn on Park Ave and take a left on 156th St
- HOA & community: No master association fee required
Exterior
- Parking: Detached owned garage (2 garage spaces, 2 total parking spaces)
- Utilities: Public water; Septic-mechanical sewer
- Home design: Detached single-family home; 1.5-story layout; Fee simple ownership; Home built over 100 years ago; Brick construction; Built before 1978
- Construction: Brick exterior; Shallow historical home (100+ years)
- Exterior features: Lot under 0.25 acre; Lot dimensions: 5500
Interior
- Kitchen: Main-level kitchen (approx. 11 x 11)
- Bedrooms: Master bedroom on the main level with full bath; Two additional main-level bedrooms (each approx. 11 x 11)
- Bathrooms: One full bath (including master); Basement has bathroom access
- Heating & cooling: Natural gas heating; Central air conditioning
- Interior features: Seven total rooms; Unfinished full basement
- Laundry & utility: Main-level laundry room (approx. 11 x 11)
Neighborhood map
What this means for you Summary
Snapshot
- This is a 3-bed/1.0-bath single-family listed at $35k.
Deal economics
- At list price, monthly cash flow is $1k ($16k/yr) — positive.
- The deal already cash-flows at list — no discount required.
- Meets the 1% rule at list price ($2k rent vs $35k).
- Recommended offer: $34k (3.0% below list) — sets the bar for market timing.
- Cap rate 53.1% vs local median 9.3% in Harvey — top-decile yield for the area; either an underpriced asset or a hidden risk that comps aren't pricing in. Stress-test before assuming the spread holds.
Location & tenants
- Location reads 67/100 on livability (#539 in IL) — a middle-class / working-renter tenant base. Strengths: commute A+, cost of living A+, housing A-; Watch: health & safety D+, crime F, amenities F.
- Thornton Twp Hsd 205 (suburban): math 7% / reading 8% proficiency, ranked #594 of 620 in IL (top 96%) — low school quality limits family demand, transient renter base, plan for 1-2y turnover.
- Zoned schools: Brooks Middle School (math 3% / reading 14%, grade F, #605 of 665 statewide, top 91%, 487 students, 0% FRL); Thornton Township High School (math 7% / reading 7%, grade F, #605 of 693 statewide, top 87%, 1,628 students, 0% FRL).
- Market conditions: 132 active listings in the ZIP; 2 comparable units currently listed for rent nearby; 6,272 units permitted in Cook County in 2024 (4,658 in 5+ unit buildings).
Forward outlook
- In year one you build about $4k of equity ($242 loan paydown + $4k appreciation (10.0% local appreciation)).
- At projected returns (10.0% appreciation + 3.0% rent growth), your $10k cash investment doubles in ~1 year — after that, you're playing with house money.
- By year 8, paydown + projected appreciation supports a ~$33k cash-out refi (75% LTV) — recoverable capital for the next deal without selling this one.
Negotiation context
- It's been on market 56 days — a 3% lower offer ($34k) is reasonable based on typical stale-listing flexibility.
- 3 sale attempts; this cycle's ask has dropped $5k (12%) from the opening price — seller is motivated, your offer sets the floor, not the list.
- Current owner paid $29k; 21% above their basis — modest negotiation headroom, anchor on the comps not their cost.
Risks & watch-outs
- Watch-outs: built in 1919 — expect roof / HVAC / electrical / plumbing capex.
Questions for the listing agent
- It's been on market 56 days. Have you received any prior offers? Is the seller open to a 3% concession, seller financing, or rate buy-down credit?
- Built in 1919 — when were the roof, HVAC, electrical panel, plumbing, and water heater last replaced?
- Is there a deadline driving the sale (1031 exchange, divorce, estate, relocation)? That informs how much negotiation room exists.
- Schools are F-rated, which usually means shorter tenancies and higher turnover. Who's the typical renter profile here, and what's been the actual vacancy rate?
- Crime grade is F in this area — have there been break-ins, vandalism, or insurance claims at this property in the last 3 years? What carrier currently insures it and at what premium?
- What's the average days-on-market for RENTAL listings here right now (not sales)? A rising rental-DOM trend means longer vacancies and softer asking-rent achievability than the comps imply.
- What's the recent tenant-quality profile in this submarket — average credit score on applications, eviction rate, late-payment / NSF rate, and stable-employment percentage? A property-management company in the area should have these aggregated.
- How much new for-sale + rental construction is in the pipeline within 1–3 miles? Heavy new supply typically softens prices + rents 12–24 months out; constrained supply supports both.
Investment metrics
- 1% rule
- 5.81% ✓
- Cap rate
- 53.07%
- Cash-on-cash
- 167.06%
- DSCR
- 8.43
- GRM
- 1.4
CMA / ARV
- ARV (on-the-fly)
- $123,606
- Comps found
- 12
Show comp detail 12 sales within ~0.75 mi
| Address | Dist | Beds/Ba | Sqft | Sold | Price | $/sf | Match |
|---|---|---|---|---|---|---|---|
| 15709 Lexington Ave | 0.09mi | 2/1.5 (-1) | 1,040 (-8%) | 11mo | $115,000 | $111 | 66 |
| 15726 Vine Ave | 0.36mi | 3/2.0 | 1,174 (+4%) | 10mo | $189,999 | $162 | 65 |
| 15537 Ashland Ave | 0.47mi | 2/1.0 (-1) | 1,091 (-4%) | 3mo | $70,000 | $64 | 64 |
| 16030 Gauger Ave | 0.50mi | 3/1.5 | 1,152 (+2%) | 10mo | $125,000 | $109 | 63 |
| 16019 Myrtle Ave | 0.43mi | 3/1.0 | 1,008 (-11%) | 3mo | $70,000 | $69 | 59 |
| 15943 Ashland Ave | 0.51mi | 3/1.5 | 1,174 (+4%) | 11mo | $110,000 | $94 | 59 |
| 16207 Justine St | 0.67mi | 4/2.0 (+1) | 1,100 (-3%) | 3mo | $215,000 | $195 | 52 |
| 15515 Marshfield Ave | 0.56mi | 3/1.0 | 1,247 (+10%) | 9mo | $135,000 | $108 | 50 |
| 105 W 158th Pl | 0.75mi | 3/1.0 | 1,075 (-5%) | 8mo | $155,000 | $144 | 49 |
| 15934 Marshfield Ave | 0.58mi | 3/2.0 | 1,221 (+8%) | 8mo | $105,000 | $86 | 49 |
| 16118 Paulina St | 0.74mi | 3/1.0 | 1,034 (-9%) | 7mo | $183,000 | $177 | 45 |
| 15641 Paulina St | 0.56mi | 3/2.0 | 1,260 (+11%) | 11mo | $46,500 | $37 | 42 |
Match score weights: distance 35% · size 25% · config 20% · recency 20%. Top-matched comps best support the ARV.
Projected returns pro-forma
10.0% appreciation · 3.0% rent growth · sell at horizon
- IRR
- —
- Equity multiple
- 11.82×
- Total profit
- $105,989
- Equity at exit
- $31,531
- IRR
- —
- Equity multiple
- 25.88×
- Total profit
- $243,846
- Equity at exit
- $67,997
Cash invested: $9,800 (down + closing). Projections, not guarantees.
Landlord ↔ Tenant lean methodology
- Overall (STATE)
- 43 Moderately Tenant-Leaning
- State Illinois
- 43 Moderately Tenant-Leaning · D+7
- County
- — inherits STATE
- City
- — inherits STATE
ZIP-level market 60426
- Home prices YoY
- 6.9%
- Active inventory
- 132
- Price-to-rent
- 1.4×
Monthly cashflow live
- Estimated rent
- $2,033 medium interval (Pro) →
- Mortgage (P&I)
- −$184
- Tax est. 1.5%
- −$44 /mo · $525/yr
- Insurance
- −$15
- HOA
- −$0
- Lot rent
- −$0
- Vacancy / Maint / Mgmt
- −$427
- Net cashflow
- $1,364
Break-even live
Sensitivity live
| Price | -10% $1,389 | -5% $1,376 | +0% $1,364 | +5% $1,352 | +10% $1,340 |
|---|---|---|---|---|---|
| Rent | -10% $1,204 | -5% $1,284 | +0% $1,364 | +5% $1,445 | +10% $1,525 |
| Rate | -1.0pp $1,382 | -0.5pp $1,373 | base $1,364 | +0.5pp $1,355 | +1.0pp $1,346 |
UW: 25.0% down · 7.5% · 30yr · 1.5% tax · 5.0% vac · 8.0% maint · 8.0% mgmt
Financing live
Cash to close
- Down payment
- $8,750
- Closing costs
- $1,050
- Reserves months
- —
- Total cash needed
- —
Loan-product check · same deal, 3 products live
Conventional
25% down · 7.5% · 30yr
- Down + closing
- —
- Monthly P&I
- —
- Monthly cashflow
- —
- DSCR
- —
- Eligible?
- —
Personal DTI + credit; lowest rate.
DSCR
20% down · 8.5% · 30yr
- Down + closing
- —
- Monthly P&I
- —
- Monthly cashflow
- —
- DSCR
- —
- Eligible?
- —
No personal income docs; deal must DSCR.
Hard money
10% down · 12.0% · 12mo
- Down + closing
- —
- Monthly P&I
- —
- Monthly cashflow
- —
- DSCR
- —
- Eligible?
- —
Short-term bridge; refi at stabilization.
Rent comps 2 comps
| Address | Beds | Baths | Sqft | Rent | $/sqft | DOM | Units | Dist |
|---|---|---|---|---|---|---|---|---|
| 16125 Marshfield Ave Markham, IL | 3.0 | 1.0 | 1043 | $2,400 | $2.30 | 0d | 1 | 0.64mi |
| 16048 Halsted St Unit 2 Harvey, IL | 3.0 | 1.0 | 1091 | $1,650 | $1.51 | 27d | 1 | 0.70mi |
Listing history 9 events
-
2026-05-16status Pending
-
2026-05-08status Active
-
2026-04-06status Pending
-
2026-03-30price $35,000
-
2026-02-16$40,000 Active
-
2025-11-17historical
-
2025-10-22price
-
2025-09-29Active
-
1993-06-10soldstatus $29,000
ⓘ Source: listings_history table (triggers on properties + properties_extension) + one-shot
backfill from property_details.listing_events for pre-trigger history.
Climate risk First Street
- Flood 4/10 Moderate FEMA zone X (unshaded) · 22% chance over 30 yrs
- Wildfire 1/10 Low
- Heat 3/10 Moderate 7 d/yr ≥102°F today · 15 d/yr by 30 yrs out
- Wind 2/10 Low
- Air quality 4/10 Moderate 4 unhealthy d/yr today · 5 by 30 yrs out
Nearby sold comps map
Loading sold comps map…
Walkable amenities ~0.75 mi
Loading nearby amenities…
Taxation est. · year 1
- Rental income
- $24,398
- − Mortgage interest
- −$1,961
- − Property taxes
- −$525
- − Insurance
- −$175
- − Repairs & maintenance
- −$1,952
- − Management
- −$1,952
- − Depreciation
- −$1,018
- Taxable income
- $16,816
- Est. tax owed @ 24.0%
- −$4,036
- After-tax cash flow
- $12,336/yr
For passive investors: Depreciation is non-cash, so a rental often shows a tax loss while cash-flowing — sheltering income. Rental losses are passive: they offset passive income freely, and up to $25,000/yr can offset ordinary (W-2) income if you actively participate and your MAGI is under $100k (phasing out to $0 by $150k); unused losses carry forward. On sale, claimed depreciation is recaptured at up to 25%, and gains may owe capital-gains tax (a 1031 exchange can defer both). Figures are a year-1 estimate at your 24.0% rate — not tax advice; consult a CPA.
Schools (NCES district)
- District
- Thornton Twp Hsd 205
- NCES district ID
- 1738970
- Math proficiency
- 7% ▬ 0.00%
- Reading proficiency
- 8% ▼ -2.00%
- Median HH income
- $43,392
- Composite
- 6.92/100
- National rank
- #9976
- State rank
- #594 of 620 in IL
Livability — Harvey
- Score
- 67/100
- State rank
- #539
- US rank
- #11162
Category grades
Schools grade is shown separately in the Schools card above.
Census & demographics
- Census place
- Harvey, IL
- City population
- 23,066
- Population (ZIP)
- 23,066
Population outlook (Cook County) Hauer SSP2
- Today (2025)
- 5,347,519 people
- By 2030
- 5,357,703 · +0.2%
- By 2040
- 5,324,924 · -0.4%
- By 2050
- 5,230,762 · -2.2%
- By 2075
- 4,785,735 · -10.5%
- By 2100
- 4,188,836 · -21.7%
Race, ethnicity, and origin ACS 2023
- Neighborhood character
- Majority Black (59%)
- Race & ethnicity
- Black 59% Hispanic / Latino 33% Two or more races 12% White 3% Asian 2%
- Hispanic origin (detail)
- Mexican 31%
- Foreign-born
- 17% · Canada
- Languages at home
- 67% English-only · Spanish 30% Other Indo-European 2% French/Haitian/Cajun 1%
Political lean MEDSL · Cook
- 2024 margin
- Solid D (+42.0) · D 70.4% · R 28.4% · Other 1.2%
- 2008→2024 swing
- -11.4pp toward R · 2008: 53.4pp · 2024: 42.0pp
- All cycles
- 2024: D+42.0 2020: D+50.3 2016: D+53.0 2012: D+49.4 2008: D+53.4
Not yet ingested
- Civics
- —
Market trends
- HPI YoY
- ▲ 20.36%
- Current HPI
- 313.7895
- Rent YoY
- —
- Metro
- —
- State GDP YoY
- ▲ 1.59%
- F500 in state
- 60
Industry mix (Fortune 500 HQ in IL)
| Industry | F500 HQs | Revenue |
|---|---|---|
| Insurance | 4 | $201B |
|
||
| Consumer Goods | 4 | $87B |
|
||
| Industrial Machinery | 3 | $64B |
|
||
| Healthcare | 2 | $55B |
|
||
| Retail / Pharmacy | 1 | $148B |
|
||
| Agriculture / Food | 1 | $86B |
|
||
Price history
+20.7% since first listed9 events — show timeline
- 2026-05-16 Pending — MRED as Distributed by MLS Grid
- 2026-05-08 Relisted — MRED as Distributed by MLS Grid
- 2026-04-06 Pending — MRED as Distributed by MLS Grid
- 2026-03-30 Price Changed $35,000 MRED as Distributed by MLS Grid
- 2026-02-16 Listed $40,000 MRED as Distributed by MLS Grid
- 2025-11-17 Listing Removed — MRED as Distributed by MLS Grid
- 2025-10-22 Price Changed — MRED as Distributed by MLS Grid
- 2025-09-29 Listed — MRED as Distributed by MLS Grid
- 1993-06-10 Sold (Public Records) $29,000 Public Records
Property tax history
+6.0%/yrLatest (2023): $3,595 · +564.1% YoY. Source: county tax records.
Cash-flow waterfall
monthlySold comps — $/sqft
last 12 mo · ≤1 miLoading sold comps…