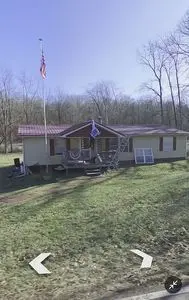
42460 Mount Hope Rd · Lafferty, OH
Flood risk 6/10 · Moderate
- FEMA flood zone
- X (unshaded)
- Chance of flooding over 30 yrs
- 0.7%
- Est. flood insurance / yr
- $507 – $1,088
Fire risk 1/10 · Minimal
- Est. fire insurance / yr
- $713 – $1,323
Heat risk 3/10 · Minor
- Hot days now (above 96°F)
- 7 days/yr
- Hot days in 30 yrs
- 17 days/yr
Wind risk 1/10 · Minimal
- Chance of severe wind over 30 yrs
- 1.0%
Air-quality risk 1/10 · Minimal
- Unhealthy air days now
- 0 days/yr
- Unhealthy air days in 30 yrs
- 0 days/yr
Risk factors via First Street. Map © Google.
Why this score? — see what drove the D grade
The composite is a weighted blend of 9 inputs, each scored 0–100. Each bar is that input's sub-score; the figure is the points it added to the 100-point composite (weight × sub-score).
- Appreciation +10.0/10.0
- Cash flow +8.4/30.0
- ARV discount +7.5/15.0
- Schools +4.2/10.0
- Rent growth +2.5/5.0
- Condition / age +2.5/5.0
- DSCR +2.3/10.0
- Livability +2.2/5.0
- 1% rule +1.9/10.0
$180,000
🖨 Deal sheet (PDF) 📄 Offer letter ✓ Due diligence
Listing remarks
Property was appraised at $150K in 2017. 4 wooded acres with a creek flowing through it. All major appliances and furniture are staying including power tools. 2 car garage. 20 x 40 dog pen. Deer fenced garden with greenhouse. New steel roof. New propane furnace with AC. 3 big out buildings for storage. All new light fixtures/ceiling fans throughout. I& apos; ve seen owls, fox, bobcat, turkeys and of course, deer. I& apos; ve seen zero rabbits. (Owls?) A couple rooms need paint. Most rooms need carpet or flooring. Includes furniture, stacked washer/dryer, stove, refrigerator, upright freezer.
Key facts
- Deer fenced garden
- Wooded acres
- Steel roof
Tags
Neighborhood map
What this means for you Summary
Snapshot
- This is a 3-bed/1.0-bath manufactured listed at $180k.
Deal economics
- At list price, monthly cash flow is $-161 ($-2k/yr) — negative.
- To cash-flow at today's rent, offer at most $152k (15.8% below list).
- To meet the 1% rule (rent ≥ 1% of price), the offer needs to be $125k (30.6% below list).
- Recommended offer: $125k (30.6% below list) — sets the bar for 1% rule.
Location & tenants
- Location reads 45/100 on livability (#1,186 in OH) — a working-class tenant base; expect higher turnover. Strengths: cost of living A+, crime A; Watch: amenities F, commute F, employment F.
- Union Local (rural): math 39% / reading 60% proficiency, ranked #450 of 656 in OH (top 69%) — families likely to look elsewhere, expect single-tenant / working-renter base with shorter leases.
- Zoned schools: Union Local Elementary School (math 49% / reading 58%, grade C, #834 of 1,584 statewide, top 53%, 635 students, 43% FRL); Union Local Middle School (math 39% / reading 61%, grade C, #416 of 654 statewide, top 64%, 342 students, 32% FRL); Union Local High School (math 17% / reading 62%, grade F, #528 of 781 statewide, top 71%, 434 students, 26% FRL) — zoned schools at 34% FRL track the district average.
- Market conditions: 9 active listings in the ZIP; 4 units permitted in Belmont County in 2024 (0 in 5+ unit buildings).
Forward outlook
- In year one you build about $19k of equity ($1k loan paydown + $18k appreciation (10.0% local appreciation)).
- Belmont County population projected at -15% by 2050 — secular population decline; favor cash flow + early exit over multi-decade hold.
- By year 2, paydown + projected appreciation supports a ~$31k cash-out refi (75% LTV) — recoverable capital for the next deal without selling this one.
Negotiation context
- It's been on market 28 days — a 2% lower offer ($177k) is reasonable based on typical stale-listing flexibility.
Risks & watch-outs
- Climate carrying-cost: major flood risk — expect insurance premiums to compound above CPI over the hold.
Questions for the listing agent
- What do current leases actually rent for vs. the listed asking? Can we see a recent rent roll and the last 12 months of T-12 income?
- Is there a deadline driving the sale (1031 exchange, divorce, estate, relocation)? That informs how much negotiation room exists.
- Schools are D-rated, which usually means shorter tenancies and higher turnover. Who's the typical renter profile here, and what's been the actual vacancy rate?
- The area grade is low — what's the realistic commute time and amenity access for the typical tenant pool here? Any planned neighborhood developments (good or bad) we should know about?
- What's the average days-on-market for RENTAL listings here right now (not sales)? A rising rental-DOM trend means longer vacancies and softer asking-rent achievability than the comps imply.
- What's the recent tenant-quality profile in this submarket — average credit score on applications, eviction rate, late-payment / NSF rate, and stable-employment percentage? A property-management company in the area should have these aggregated.
- How much new for-sale + rental construction is in the pipeline within 1–3 miles? Heavy new supply typically softens prices + rents 12–24 months out; constrained supply supports both.
Investment metrics
- 1% rule
- 0.69% ✗
- Cap rate
- 5.22%
- Cash-on-cash
- -3.82%
- DSCR
- 0.83
- GRM
- 12.0
CMA / ARV
No comps found within radius.
Projected returns pro-forma
10.0% appreciation · 3.0% rent growth · sell at horizon
- IRR
- 21.6%
- Equity multiple
- 2.74×
- Total profit
- $87,761
- Equity at exit
- $162,158
- IRR
- 19.4%
- Equity multiple
- 6.29×
- Total profit
- $266,408
- Equity at exit
- $349,700
Cash invested: $50,400 (down + closing). Projections, not guarantees.
Landlord ↔ Tenant lean methodology
- Overall (STATE)
- 73 Landlord-Friendly
- State Ohio
- 73 Landlord-Friendly · R+6
- County
- — inherits STATE
- City
- — inherits STATE
ZIP-level market 43977
- Active inventory
- 9
- Price-to-rent
- 12.0×
Monthly cashflow live
- Estimated rent
- $1,249 medium interval (Pro) →
- Mortgage (P&I)
- −$944
- Tax from tax record
- −$129 /mo · $1,542/yr
- Insurance
- −$75
- HOA
- −$0
- Vacancy / Maint / Mgmt
- −$262
- Net cashflow
- $-161
Break-even live
Sensitivity live
| Price | -10% $-59 | -5% $-110 | +0% $-161 | +5% $-212 | +10% $-263 |
|---|---|---|---|---|---|
| Rent | -10% $-259 | -5% $-210 | +0% $-161 | +5% $-111 | +10% $-62 |
| Rate | -1.0pp $-70 | -0.5pp $-115 | base $-161 | +0.5pp $-207 | +1.0pp $-255 |
UW: 25.0% down · 7.5% · 30yr · 1.5% tax · 5.0% vac · 8.0% maint · 8.0% mgmt
Financing live
Cash to close
- Down payment
- $45,000
- Closing costs
- $5,400
- Reserves months
- —
- Total cash needed
- —
Loan-product check · same deal, 3 products live
Conventional
25% down · 7.5% · 30yr
- Down + closing
- —
- Monthly P&I
- —
- Monthly cashflow
- —
- DSCR
- —
- Eligible?
- —
Personal DTI + credit; lowest rate.
DSCR
20% down · 8.5% · 30yr
- Down + closing
- —
- Monthly P&I
- —
- Monthly cashflow
- —
- DSCR
- —
- Eligible?
- —
No personal income docs; deal must DSCR.
Hard money
10% down · 12.0% · 12mo
- Down + closing
- —
- Monthly P&I
- —
- Monthly cashflow
- —
- DSCR
- —
- Eligible?
- —
Short-term bridge; refi at stabilization.
Listing history 13 events
-
2026-06-16days on market $180,000 Active 28 DOM
-
2026-06-15days on market $180,000 Active 27 DOM
-
2026-06-13days on market $180,000 Active 25 DOM
-
2026-06-12days on market $180,000 Active 24 DOM
-
2026-06-09days on market $180,000 Active 21 DOM
-
2026-06-08days on market $180,000 Active 11 DOM
-
2026-06-08days on market $180,000 Active 10 DOM
-
2026-06-07days on market $180,000 Active 9 DOM
-
2026-06-04days on market $180,000 Active 6 DOM
-
2026-06-02days on market $180,000 Active 5 DOM
-
2026-06-01days on market $180,000 Active 4 DOM
-
2026-05-31days on market $180,000 Active 3 DOM
-
2026-05-20$180,000 Active
ⓘ Source: listings_history table (triggers on properties + properties_extension) + one-shot
backfill from property_details.listing_events for pre-trigger history.
Tax reassessment forecast OH · Partial reset (capped growth)
- Current annual tax
- $1,542 · $129/mo
- Projected year-2 tax
- $2,175 · $181/mo
- Expected delta
- +$633/yr (+$53/mo · 41.0%)
ⓘ Screening estimate from a state-policy table — verify with the county assessor before closing.
Climate risk First Street
- Flood 6/10 Major FEMA zone X (unshaded) · 70% chance over 30 yrs
- Wildfire 1/10 Low
- Heat 3/10 Moderate 7 d/yr ≥96°F today · 17 d/yr by 30 yrs out
- Wind 1/10 Low 100% chance of damaging wind over 30 yrs
- Air quality 1/10 Low 0 unhealthy d/yr today · 0 by 30 yrs out
Nearby sold comps map
Loading sold comps map…
Walkable amenities ~0.75 mi
Loading nearby amenities…
Taxation est. · year 1
- Rental income
- $14,989
- − Mortgage interest
- −$10,083
- − Property taxes
- −$1,542
- − Insurance
- −$900
- − Repairs & maintenance
- −$1,199
- − Management
- −$1,199
- − Depreciation
- −$5,236
- Taxable loss
- −$5,170
- Est. tax savings @ 24.0%
- +$1,241
- After-tax cash flow
- $-687/yr
For passive investors: Depreciation is non-cash, so a rental often shows a tax loss while cash-flowing — sheltering income. Rental losses are passive: they offset passive income freely, and up to $25,000/yr can offset ordinary (W-2) income if you actively participate and your MAGI is under $100k (phasing out to $0 by $150k); unused losses carry forward. On sale, claimed depreciation is recaptured at up to 25%, and gains may owe capital-gains tax (a 1031 exchange can defer both). Figures are a year-1 estimate at your 24.0% rate — not tax advice; consult a CPA.
Schools (NCES district)
- District
- Union Local
- NCES district ID
- 3904601
- Math proficiency
- 39% ▼ -13.00%
- Reading proficiency
- 60% ▼ -5.00%
- Median HH income
- $44,288
- Composite
- 41.74/100
- National rank
- #3402
- State rank
- #450 of 656 in OH
Livability — Lafferty
- Score
- 45/100
- State rank
- #1186
- US rank
- #26685
Category grades
Schools grade is shown separately in the Schools card above.
Census & demographics
- County
- Belmont · 63,139 people
- City population
- 37
- Metro
- Wheeling, WV-OH
- Population (ZIP)
- 2,576
- Household income
- $59,483
- Rent vs Own
- Severe rent burden
- 2.6
Population outlook (Belmont County) Hauer SSP2
- Today (2025)
- 66,568 people
- By 2030
- 64,818 · -2.6%
- By 2040
- 60,702 · -8.8%
- By 2050
- 56,427 · -15.2%
- By 2075
- 46,222 · -30.6%
- By 2100
- 34,611 · -48.0%
Race, ethnicity, and origin ACS 2023
- Neighborhood character
- Predominantly White (94%)
- Race & ethnicity
- White 94% Two or more races 4% Hispanic / Latino 1%
- Common ancestry
- Iranian 5% Romanian 2% Lithuanian 2%
- Foreign-born
- 1% · Canada
- Languages at home
- 99% English-only · Spanish 1%
Political lean MEDSL · Belmont
- 2024 margin
- Solid R (+47.3) · D 26.0% · R 73.3%
- 2008→2024 swing
- -50.0pp toward R · 2008: 2.7pp · 2024: -47.3pp
- All cycles
- 2024: R+47.3 2020: R+43.6 2016: R+39.5 2012: R+8.4 2008: D+2.7
Not yet ingested
- Civics
- —
Market trends
- HPI YoY
- ▲ 76.92%
- Current HPI
- 244.89
- Rent YoY
- —
- Metro
- —
- State GDP YoY
- ▲ 1.98%
- F500 in state
- 48
Industry mix (Fortune 500 HQ in OH)
| Industry | F500 HQs | Revenue |
|---|---|---|
| Insurance | 3 | $145B |
|
||
| Industrial Machinery | 3 | $49B |
|
||
| Financial Services | 3 | $24B |
|
||
| Consumer Goods | 2 | $93B |
|
||
| Aerospace / Defense | 2 | $47B |
|
||
| Utilities | 2 | $33B |
|
||
Price history
1 event — show timeline
- 2026-05-20 Listed $180,000 FSBO.com
Property tax history
+9.6%/yrLatest (2025): $1,542 · +1.7% YoY. Source: county tax records.
Cash-flow waterfall
monthlySold comps — $/sqft
last 12 mo · ≤1 miLoading sold comps…