5402 Chateau Ln · Bayshore Gardens, FL
Flood risk 1/10 · Minimal
- FEMA flood zone
- X (unshaded)
- Chance of flooding over 30 yrs
- 0.0%
- Est. flood insurance / yr
- $507 – $1,088
Fire risk 1/10 · Minimal
- Est. fire insurance / yr
- $947 – $1,759
Heat risk 10/10 · Severe
- Hot days now (above 107°F)
- 7 days/yr
- Hot days in 30 yrs
- 28 days/yr
Wind risk 10/10 · Severe
- Chance of severe wind over 30 yrs
- 99.0%
Air-quality risk 2/10 · Minimal
- Unhealthy air days now
- 1 days/yr
- Unhealthy air days in 30 yrs
- 2 days/yr
Risk factors via First Street. Map © Google.
Why this score? — see what drove the D grade
The composite is a weighted blend of 9 inputs, each scored 0–100. Each bar is that input's sub-score; the figure is the points it added to the 100-point composite (weight × sub-score).
- Cash flow +12.1/30.0
- ARV discount +7.5/15.0
- 1% rule +5.3/10.0
- Schools +4.4/10.0
- Livability +4.1/5.0
- DSCR +3.6/10.0
- Condition / age +2.5/5.0
- Rent growth +1.1/5.0
- Appreciation +0.0/10.0
$129,900
🖨 Deal sheet 📄 Offer letter ✓ Due diligence
Listing remarks
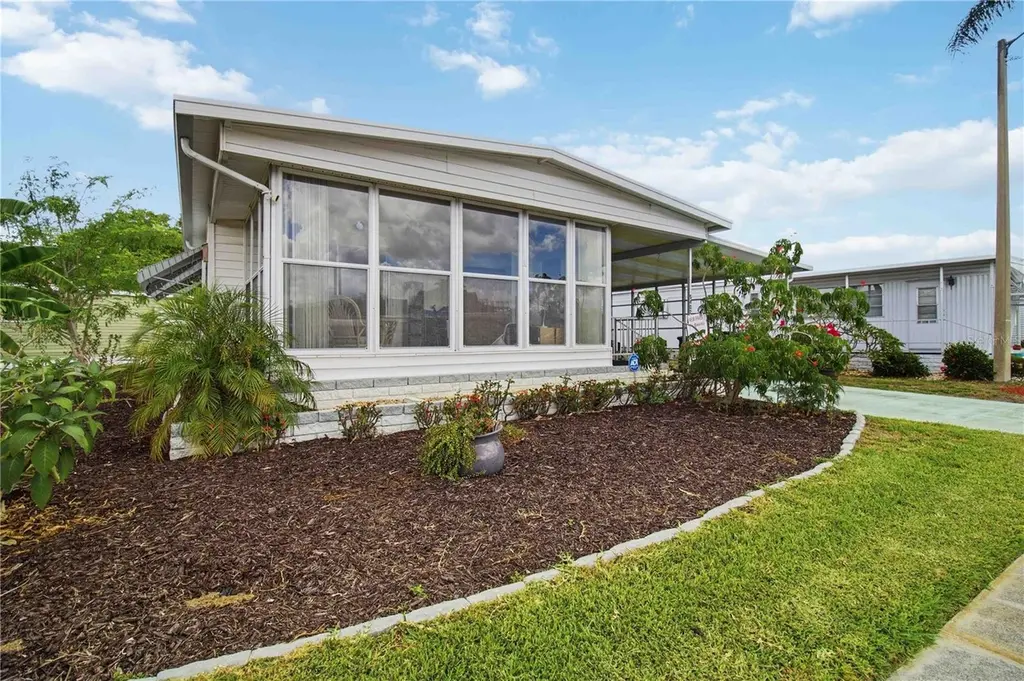
Welcome to 5402 Chateau Lane, a beautifully updated turnkey home located in the highly sought-after 55+ community of Chateau Village in Bradenton. Situated on a rare oversized corner lot and outside of a flood zone, this fully renovated 2-bedroom, 1-bath residence offers the perfect combination of comfort, convenience, and low-maintenance Florida living. With HOA fees of just $250 per month, you'll enjoy an affordable lifestyle with more time to relax and enjoy all that the Gulf Coast has to offer. Inside, the home has been thoughtfully reimagined with high-end finishes and modern upgrades throughout. Luxury vinyl flooring flows seamlessly from room to room, while the spa-inspired bathroom
Key facts
- Oversized corner lot
- Japanese soaking tub
- Gourmet kitchen
Tags
Property features AI
Finance
- Other: Total building area reported as 1,430 square feet; Living area reported as 720 square feet; Total acreage listed as 0 to less than 1/4 acre
- Financial info: Lease restrictions apply
- HOA & community: HOA required (Patrick); Monthly HOA fee $250 — includes cable TV, pool, internet, grounds maintenance, management, sewer, trash, water; Community clubhouse and pool; Shuffleboard court; Senior community; Association approval required; pets not allowed
Exterior
- Parking: Carport with 1 space
- Utilities: Public water; Public sewer; Cable connected; Electricity connected; Water connected; Sewer connected
- Home design: Residential mobile home (double wide); One level; East-facing
- Construction: Vinyl siding; Metal roof; Crawlspace foundation; Built on a 0.15-acre lot
- Exterior features: Storage; Asphalt road access
Interior
- Kitchen: Dishwasher; Microwave; Range; Refrigerator
- Bedrooms: 2 bedrooms
- Bathrooms: 1 full bathroom
- Heating & cooling: Central heating; Central air conditioning
- Interior features: Ceiling fans; 5 total rooms
- Laundry & utility: Laundry area located outside
Neighborhood map
What this means for you Summary
Snapshot
- This is a 2-bed/1.0-bath manufactured listed at $130k.
Deal economics
- At list price, monthly cash flow is $-29 ($-354/yr) — negative.
- To cash-flow at today's rent, offer at most $125k (4.0% below list).
- Meets the 1% rule at list price ($1k rent vs $130k).
- Recommended offer: $125k (4.0% below list) — sets the bar for cash-flow.
- Cap rate 6.0% vs local median 4.7% in Bayshore Gardens — meaningfully above typical; check what's discounted (condition, days-on-market, listing class) to confirm the premium yield is real.
Location & tenants
- Location reads 82/100 on livability (#72 in FL, #1,180 nationally) — a professional / high-income tenant draw. Strengths: cost of living A+, housing A+, health & safety A+; Watch: crime C-, commute C-, schools F.
- Manatee (suburban): math 54% / reading 50% proficiency, ranked #26 of 73 in FL (top 36%) — acceptable for families but not a draw, mixed tenant base, ~2y average lease.
- Market conditions: Rents falling (-5.5%/yr); 361 active listings in the ZIP; 31 comparable units currently listed for rent nearby; rentals at typical pace (median 24d on market — plan ~3-4 weeks tenant-placement turnaround); 7,472 units permitted in Manatee County in 2024 (1,782 in 5+ unit buildings).
- This rent runs 36% of the median local income ($45k/yr) — at the standard rent-burdened threshold; future hikes will face affordability resistance.
Forward outlook
- Local home prices are declining (-3.0%/yr); year-one equity from $898 of loan paydown is wiped out by about $4k of value loss. Plan a longer hold.
- Manatee County population projected at +43% by 2050 — long-run rental-demand tailwind backs the buy-and-hold thesis.
Negotiation context
- It's been on market 15 days — a 2% lower offer ($128k) is reasonable based on typical stale-listing flexibility.
- Current owner paid $65k; list at $130k implies a 100% gain — meaningful room to come down on a strong offer.
Risks & watch-outs
- Climate carrying-cost: severe wind risk, 99% chance of damaging wind over 30y; extreme-heat days projected 7→28/yr by 2055 (HVAC capex compounding) — expect insurance premiums to compound above CPI over the hold.
Questions for the listing agent
- What do current leases actually rent for vs. the listed asking? Can we see a recent rent roll and the last 12 months of T-12 income?
- Built in 1972 — when were the roof, HVAC, electrical panel, plumbing, and water heater last replaced?
- What does the HOA fee cover, when was the last increase, and are there any pending special assessments or reserve-fund shortfalls?
- Is there a deadline driving the sale (1031 exchange, divorce, estate, relocation)? That informs how much negotiation room exists.
- Schools are F-rated, which usually means shorter tenancies and higher turnover. Who's the typical renter profile here, and what's been the actual vacancy rate?
- The area grade is low — what's the realistic commute time and amenity access for the typical tenant pool here? Any planned neighborhood developments (good or bad) we should know about?
- What's the average days-on-market for RENTAL listings here right now (not sales)? A rising rental-DOM trend means longer vacancies and softer asking-rent achievability than the comps imply.
- What's the recent tenant-quality profile in this submarket — average credit score on applications, eviction rate, late-payment / NSF rate, and stable-employment percentage? A property-management company in the area should have these aggregated.
- How much new for-sale + rental construction is in the pipeline within 1–3 miles? Heavy new supply typically softens prices + rents 12–24 months out; constrained supply supports both.
Investment metrics
- 1% rule
- 1.03% ✓
- Cap rate
- 6.02%
- Cash-on-cash
- -0.97%
- DSCR
- 0.96
- GRM
- 8.1
CMA / ARV
- ARV (on-the-fly)
- $59,760
- Comps found
- 12
Show comp detail 12 sales within ~0.75 mi
| Address | Dist | Beds/Ba | Sqft | Sold | Price | $/sf | Match |
|---|---|---|---|---|---|---|---|
| 214 52nd Avenue Dr W | 0.30mi | 3/1.5 (+1) | 728 (+1%) | 3mo | $87,900 | $121 | 75 |
| 301 Brazil Ct #95 | 0.18mi | 2/1.5 | 792 (+10%) | 2mo | $66,000 | $83 | 71 |
| 302 52nd Avenue Ter E | 0.50mi | 2/2.0 | 728 (+1%) | 1mo | $170,000 | $234 | 70 |
| 415 Dublin Ave | 0.13mi | 2/1.0 | 624 (-13%) | 3mo | $50,000 | $80 | 69 |
| 403 51st Avenue Dr W | 0.37mi | 1/1.0 (-1) | 740 (+3%) | 8mo | $37,000 | $50 | 67 |
| 1112 51st Avenue Dr W | 0.46mi | 2/2.0 | 740 (+3%) | 7mo | $69,900 | $94 | 64 |
| 719 50th Avenue Ter W | 0.43mi | 2/1.5 | 770 (+7%) | 3mo | $95,000 | $123 | 63 |
| 718 50th Avenue Dr W | 0.47mi | 1/2.0 (-1) | 724 (+1%) | 10mo | $49,000 | $68 | 60 |
| 411 51st Avenue Ter W | 0.30mi | 2/2.0 | 800 (+11%) | 8mo | $65,000 | $81 | 57 |
| 1002 51st Avenue Plz W | 0.38mi | 2/2.0 | 784 (+9%) | 9mo | $85,000 | $108 | 56 |
| 1112 49th Avenue Ter W | 0.61mi | 2/1.5 | 770 (+7%) | 4mo | $36,000 | $47 | 55 |
| 108 50th Avenue Dr W | 0.54mi | 1/1.0 (-1) | 612 (-15%) | 10mo | $30,000 | $49 | 37 |
Match score weights: distance 35% · size 25% · config 20% · recency 20%. Top-matched comps best support the ARV.
Projected returns pro-forma
-3.0% appreciation · 0.0% rent growth · sell at horizon
- IRR
- -22.0%
- Equity multiple
- 0.27×
- Total profit
- $-26,714
- Equity at exit
- $19,369
- IRR
- -28.7%
- Equity multiple
- -0.11×
- Total profit
- $-40,287
- Equity at exit
- $11,231
Cash invested: $36,372 (down + closing). Projections, not guarantees.
Landlord ↔ Tenant lean methodology
- Overall (STATE)
- 87 Strongly Landlord-Friendly
- State Florida
- 87 Strongly Landlord-Friendly · R+3
- County
- — inherits STATE
- City
- — inherits STATE
ZIP-level market 34207
- Rents YoY
- -5.5%
- Active inventory
- 361
- Price-to-rent
- 8.1×
Monthly cashflow live
- Estimated rent
- $1,339 high interval (Pro) →
- Mortgage (P&I)
- −$681
- Tax from tax record
- −$102 /mo · $1,221/yr
- Insurance
- −$54
- HOA
- −$250
- Vacancy / Maint / Mgmt
- −$281
- Net cashflow
- $-29
Break-even live
UW: 25.0% down · 7.5% · 30yr · 1.5% tax · 5.0% vac · 8.0% maint · 8.0% mgmt
Financing live
Cash to close
- Down payment
- $32,475
- Closing costs
- $3,897
- Reserves months
- —
- Total cash needed
- —
Loan-product check · same deal, 3 products live
Conventional
25% down · 7.5% · 30yr
- Down + closing
- —
- Monthly P&I
- —
- Monthly cashflow
- —
- DSCR
- —
- Eligible?
- —
Personal DTI + credit; lowest rate.
DSCR
20% down · 8.5% · 30yr
- Down + closing
- —
- Monthly P&I
- —
- Monthly cashflow
- —
- DSCR
- —
- Eligible?
- —
No personal income docs; deal must DSCR.
Hard money
10% down · 12.0% · 12mo
- Down + closing
- —
- Monthly P&I
- —
- Monthly cashflow
- —
- DSCR
- —
- Eligible?
- —
Short-term bridge; refi at stabilization.
Rent comps 31 comps
| Address | Beds | Baths | Sqft | Rent | $/sqft | DOM | Units | Dist |
|---|---|---|---|---|---|---|---|---|
| 205 52nd Avenue Dr W Bradenton, FL | 1.0 | 1.0 | 528 | $1,200 | $2.27 | 23d | 1 | 0.36mi |
| 110 52nd Avenue Ter E Bradenton, FL | 2.0 | 1.5 | 684 | $1,450 | $2.12 | 23d | 1 | 0.46mi |
| 915 50th Avenue Plz W Bradenton, FL | 2.0 | 1.0 | 700 | $1,200 | $1.71 | 23d | 1 | 0.50mi |
| 707 50th Ave W Bradenton, FL | 2.0 | 1.0 | 730 | $1,150 | $1.58 | 23d | 1 | 0.53mi |
| 5531 16th St W Unit 5537 Bradenton, FL | 2.0 | 1.0 | 750 | $1,650 | $2.20 | 3d | 1 | 0.60mi |
| 4903 2nd B St E Bradenton, FL | 2.0 | 2.0 | 624 | $2,400 | $3.85 | 23d | 1 | 0.75mi |
| 304 47th Avenue Dr W #112 Bradenton, FL | 1.0 | 1.0 | 725 | $1,200 | $1.66 | 23d | 1 | 0.78mi |
| 5908 17th St W Unit C36 Bradenton, FL | 1.0 | 1.0 | 576 | $950 | $1.65 | 16d | 1 | 0.89mi |
| 1566 Pleasant Rd Unit J24 Bradenton, FL | 2.0 | 1.0 | 733 | $1,150 | $1.57 | 23d | 1 | 0.92mi |
| 1807 Restful Dr Unit N4 Bradenton, FL | 2.0 | 1.0 | 733 | $1,150 | $1.57 | 3d | 1 | 0.93mi |
| 5888 17th St W Unit C23 Bradenton, FL | 1.0 | 1.0 | 576 | $1,100 | $1.91 | 23d | 1 | 0.94mi |
| 4507 3rd Street Cir W #280 Bradenton, FL | 1.0 | 1.0 | 660 | $1,300 | $1.97 | 16d | 1 | 0.95mi |
| 1859 Restful Dr Unit L26 Bradenton, FL | 1.0 | 1.0 | 576 | $1,150 | $2.00 | 23d | 1 | 0.96mi |
| 1875 Sunny Dr Unit G32 Bradenton, FL | 1.0 | 1.0 | 576 | $1,100 | $1.91 | 23d | 1 | 0.97mi |
| 1825 Flamingo Blvd Unit O26 Bradenton, FL | 1.0 | 1.0 | 576 | $1,000 | $1.74 | 23d | 1 | 0.99mi |
| 1839 Sunny Dr Unit E36 Bradenton, FL | 1.0 | 1.0 | 576 | $1,350 | $2.34 | 23d | 1 | 0.99mi |
| 1874 Sunny Dr Unit F32 Bradenton, FL | 2.0 | 1.0 | 744 | $950 | $1.28 | 23d | 1 | 1.00mi |
| 5858 Welcome Rd Unit J23 Bradenton, FL | 2.0 | 1.0 | 744 | $1,150 | $1.55 | 3d | 1 | 1.01mi |
| 5001 22nd St W Unit B Bradenton, FL | 2.0 | 1.0 | 729 | $1,700 | $2.33 | 16d | 1 | 1.04mi |
| 5955 Palm Ln Unit A33 Bradenton, FL | 2.0 | 1.0 | 744 | $1,150 | $1.55 | 14d | 1 | 1.06mi |
| 2028 Canal Dr Unit M26 Bradenton, FL | 1.0 | 1.0 | 576 | $1,050 | $1.82 | 10d | 1 | 1.08mi |
| 5310 26th St W Bradenton, FL | 1.0–2.0 | 1.0 | 789 | $1,450 | $1.84 | 11d | 5 | 1.16mi |
| 5310 26th St W Bradenton, FL | 1.0–2.0 | 1.0 | 789 | $1,450 | $1.84 | 3d | 4 | 1.16mi |
| 5310 26th St W Bradenton, FL | 1.0–2.0 | 1.0 | 789 | $1,550 | $1.96 | 19d | 5 | 1.16mi |
| 2547 60th Ave W Unit L-36 Bradenton, FL | 1.0 | 1.0 | 576 | $1,100 | $1.91 | 16d | 1 | 1.22mi |
| 5400 26th St W Bradenton, FL | 1.0–2.0 | 1.0–2.0 | 902 | $1,651 | $1.83 | 23d | 1 | 1.27mi |
| 2803 52nd Avenue Dr W Unit 2803 Bradenton, FL | 2.0 | 1.0 | 750 | $1,599 | $2.13 | 23d | 1 | 1.30mi |
| 2835 50th Ave W Bradenton, FL | 1.0–2.0 | 1.0–2.0 | 850 | $1,610 | $1.89 | 3d | 16 | 1.39mi |
| 4515 26th St W Bradenton, FL | 1.0–2.0 | 1.0–2.0 | 806 | $1,510 | $1.87 | 1d | 14 | 1.40mi |
| 4705 27th St W Unit A Bradenton, FL | 2.0 | 1.0 | 750 | $1,325 | $1.77 | 2d | 1 | 1.42mi |
| 1345 301 Blvd E Bradenton, FL | 1.0–3.0 | 1.0–2.0 | 872 | $1,320 | $1.51 | 23d | 9 | 1.48mi |
HOA detail
- Monthly dues
- $250 · $3,000/yr
Listing history 17 events
-
2026-06-18days on market $129,900 Active 15 DOM
-
2026-06-17days on market $129,900 Active 14 DOM
-
2026-06-16days on market $129,900 Active 13 DOM
-
2026-06-15days on market $129,900 Active 12 DOM
-
2026-06-13days on market $129,900 Active 10 DOM
-
2026-06-13days on market $129,900 Active 9 DOM
-
2026-06-10days on market $129,900 Active 7 DOM
-
2026-06-09days on market $129,900 Active 6 DOM
-
2026-06-08days on market $129,900 Active 5 DOM
-
2026-06-07remarks 699-char remark
-
2026-06-07pricedays on market $129,900 Active 4 DOM
-
2026-05-31days on market $136,111 Active 334 DOM
-
2026-05-08price $136,111
-
2026-03-13price $148,888
-
2025-12-31price $175,000
-
2025-07-01$188,000 Active
-
2018-01-26soldstatus $65,000
ⓘ Source: listings_history table (triggers on properties + properties_extension) + one-shot
backfill from property_details.listing_events for pre-trigger history.
Tax reassessment forecast FL · Resets to sale price
- Current annual tax
- $1,221 · $102/mo
- Projected year-2 tax
- $1,221 · $102/mo
- Expected delta
- $0/yr ($0/mo · 0.0%)
ⓘ Screening estimate from a state-policy table — verify with the county assessor before closing.
Climate risk First Street
- Flood 1/10 Low FEMA zone X (unshaded) · 0% chance over 30 yrs
- Wildfire 1/10 Low
- Heat 10/10 Extreme 7 d/yr ≥107°F today · 28 d/yr by 30 yrs out
- Wind 10/10 Extreme 99% chance of damaging wind over 30 yrs
- Air quality 2/10 Low 1 unhealthy d/yr today · 2 by 30 yrs out
Nearby sold comps map
Loading sold comps map…
Walkable amenities ~0.75 mi
Loading nearby amenities…
Taxation est. · year 1
- Rental income
- $16,065
- − Mortgage interest
- −$7,276
- − Property taxes
- −$1,221
- − Insurance
- −$650
- − Repairs & maintenance
- −$1,285
- − Management
- −$1,285
- − HOA
- −$3,000
- − Depreciation
- −$3,779
- Taxable loss
- −$2,431
- Est. tax savings @ 24.0%
- +$584
- After-tax cash flow
- $230/yr
For passive investors: Depreciation is non-cash, so a rental often shows a tax loss while cash-flowing — sheltering income. Rental losses are passive: they offset passive income freely, and up to $25,000/yr can offset ordinary (W-2) income if you actively participate and your MAGI is under $100k (phasing out to $0 by $150k); unused losses carry forward. On sale, claimed depreciation is recaptured at up to 25%, and gains may owe capital-gains tax (a 1031 exchange can defer both). Figures are a year-1 estimate at your 24.0% rate — not tax advice; consult a CPA.
Schools (NCES district)
- District
- Manatee
- NCES district ID
- 1201230
- Math proficiency
- 54% ▼ -6.00%
- Reading proficiency
- 50% ▼ -2.00%
- Median HH income
- $49,607
- Composite
- 44.43/100
- National rank
- #2806
- State rank
- #26 of 73 in FL
Livability — Bayshore Gardens
- Score
- 82/100
- State rank
- #72
- US rank
- #1180
Category grades
Schools grade is shown separately in the Schools card above.
Census & demographics
- Census place
- Bayshore Gardens, FL
- County
- Manatee County · 416,364 people
- City population
- 33,840
- Metro
- North Port-Sarasota-Bradenton, FL
- Population (ZIP)
- 34,081
- Household income
- $45,010
- Rent vs Own
- Severe rent burden
- 1474.0
Population outlook (Manatee County) Hauer SSP2
- Today (2025)
- 447,342 people
- By 2030
- 488,911 · +9.3%
- By 2040
- 567,934 · +27.0%
- By 2050
- 637,995 · +42.6%
- By 2075
- 781,970 · +74.8%
- By 2100
- 848,272 · +89.6%
Race, ethnicity, and origin ACS 2023
- Neighborhood character
- Diverse neighborhood (Simpson 0.57)
- Race & ethnicity
- White 58% Hispanic / Latino 29% Two or more races 13% Black 7%
- Hispanic origin (detail)
- Mexican 12% Puerto Rican 4% Cuban 3% Dominican 1%
- Common ancestry
- Lithuanian 3% Romanian 2% Slovak 2%
- Foreign-born
- 16% · Canada, Jamaica
- Languages at home
- 74% English-only · Spanish 22% Other Indo-European 1% French/Haitian/Cajun 1%
Political lean MEDSL · Manatee
- 2024 margin
- Strong R (+23.5) · D 37.9% · R 61.4%
- 2008→2024 swing
- -16.5pp toward R · 2008: -7.0pp · 2024: -23.5pp
- All cycles
- 2024: R+23.5 2020: R+16.1 2016: R+17.1 2012: R+12.5 2008: R+7.0
Not yet ingested
- Civics
- —
Market trends
- HPI YoY
- ▼ -305.32%
- Current HPI
- 369.9899
- Rent YoY
- ▼ -5.50%
- Metro
- North Port-Sarasota-Bradenton, FL
- State GDP YoY
- ▲ 3.28%
- F500 in state
- 36
Industry mix (Fortune 500 HQ in FL)
| Industry | F500 HQs | Revenue |
|---|---|---|
| Industrial Technology | 2 | $29B |
|
||
| Insurance | 2 | $17B |
|
||
| Retail | 1 | $60B |
|
||
| Technology Distribution | 1 | $58B |
|
||
| Homebuilding | 1 | $35B |
|
||
| Technology Manufacturing | 1 | $35B |
|
||
Price history
+109.4% since first listed5 events — show timeline
- 2026-05-08 Price Changed $136,111 Stellar MLS as Distributed by MLS Grid
- 2026-03-13 Price Changed $148,888 Stellar MLS as Distributed by MLS Grid
- 2025-12-31 Price Changed $175,000 Stellar MLS as Distributed by MLS Grid
- 2025-07-01 Listed $188,000 Stellar MLS as Distributed by MLS Grid
- 2018-01-26 Sold (Public Records) $65,000 Public Records
Property tax history
+4.5%/yrLatest (2024): $1,221 · -1.6% YoY. Source: county tax records.
Cash-flow waterfall
monthlySold comps — $/sqft
last 12 mo · ≤1 miLoading sold comps…