 🏷️ Likely Rental
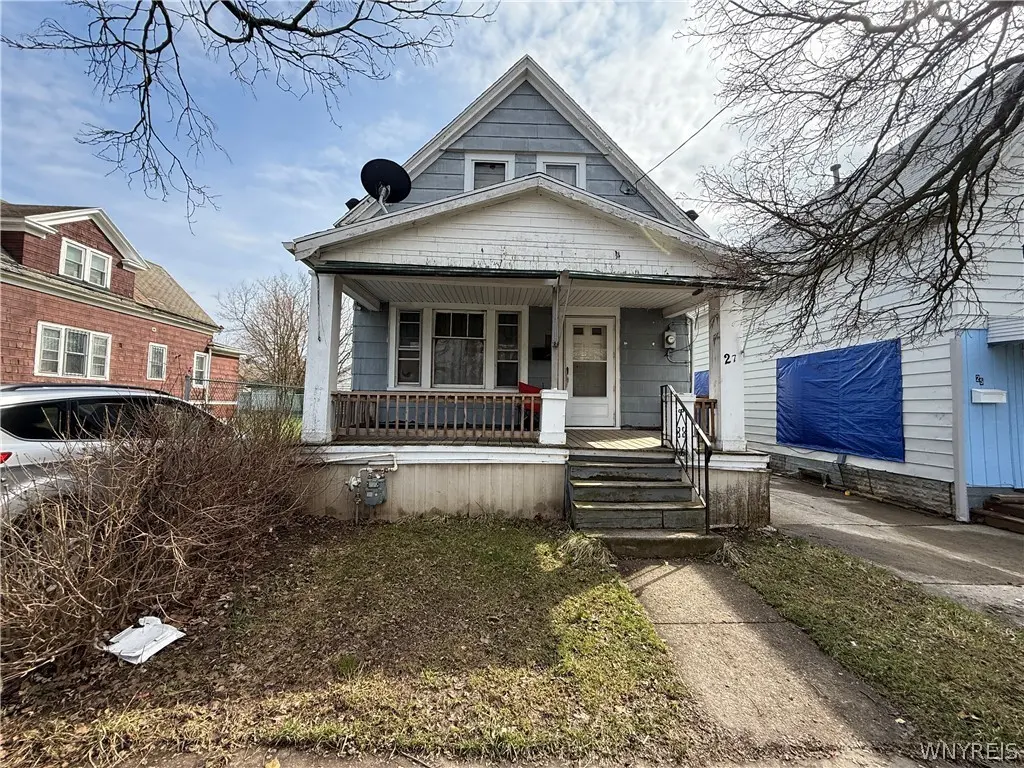
27 Lang Ave · Buffalo, NY
Flood risk 8/10 · Major
- FEMA flood zone
- X (unshaded)
- Chance of flooding over 30 yrs
- 0.99%
- Est. flood insurance / yr
- $507 – $1,088
Fire risk 1/10 · Minimal
- Est. fire insurance / yr
- $691 – $1,283
Heat risk 3/10 · Minor
- Hot days now (above 93°F)
- 7 days/yr
- Hot days in 30 yrs
- 15 days/yr
Wind risk 1/10 · Minimal
- Chance of severe wind over 30 yrs
- —
Air-quality risk 3/10 · Minor
- Unhealthy air days now
- 2 days/yr
- Unhealthy air days in 30 yrs
- 3 days/yr
Risk factors via First Street. Map © Google.
Why this score? — see what drove the C+ grade
The composite is a weighted blend of 9 inputs, each scored 0–100. Each bar is that input's sub-score; the figure is the points it added to the 100-point composite (weight × sub-score).
- Cash flow +23.7/30.0
- ARV discount +15.0/15.0
- DSCR +7.6/10.0
- 1% rule +6.2/10.0
- Livability +3.9/5.0
- Schools +3.3/10.0
- Rent growth +2.7/5.0
- Condition / age +2.5/5.0
- Appreciation +0.0/10.0
$109,900
🖨 Deal sheet (PDF) 📄 Offer letter ✓ Due diligence
Listing remarks MLS
Welcome to 27 Lang Ave in Buffalo—a solid opportunity for both homeowners and investors. This single-family home features 3 bedrooms, 1 full bath, comfortable carpeted floors, and a full basement offering additional storage or potential for future use. Currently tenant-occupied at $870/month, it provides steady income from day one or the option to transition to owner occupancy. The home offers solid mechanicals, helping minimize immediate maintenance concerns and making it a reliable choice for any buyer. Conveniently located near public transportation, shopping, dining, and other local amenities, this property combines affordability, functionality, and accessibility. Whether you're looking to expand your investment portfolio or find a place to call home
Key facts
- Tenant occupied
- Full basement
- Local amenities
Tags
Neighborhood map
What this means for you Summary
Snapshot
- This is a 2-bed/1.0-bath single-family listed at $110k.
Deal economics
- At list price, monthly cash flow is $143 ($2k/yr) — positive.
- The deal already cash-flows at list — no discount required.
- Meets the 1% rule at list price ($1k rent vs $110k).
- Recommended offer: $103k (6.0% below list) — sets the bar for market timing.
Location & tenants
- Location reads 77/100 on livability (#195 in NY, #3,011 nationally) — a middle-class / working-renter tenant base. Strengths: commute A+, housing A+, health & safety A+; Watch: crime F, employment D-.
- Buffalo City School District (urban): math 41% / reading 40% proficiency, ranked #535 of 590 in NY (top 91%) — families likely to look elsewhere, expect single-tenant / working-renter base with shorter leases; 75% free/reduced lunch — lower-income household profile, screen leases tightly.
- Market conditions: Rents flat; 239 active listings in the ZIP; 20 comparable units currently listed for rent nearby; rentals lingering (median 45d on market — plan ~5-8 weeks vacancy on turnover, expect pricing pressure); 55% of comp listings sitting > 30 days — soft ceiling on asking rent; lower-income renter base — watch delinquency; 1,244 units permitted in Erie County in 2024 (563 in 5+ unit buildings).
- This rent runs 33% of the median local income ($45k/yr) — at the standard rent-burdened threshold; future hikes will face affordability resistance.
Forward outlook
- Local home prices are declining (-3.0%/yr); year-one equity from $760 of loan paydown is wiped out by about $3k of value loss. Plan a longer hold.
Negotiation context
- It's been on market 83 days — a 6% lower offer ($103k) is reasonable based on typical stale-listing flexibility.
Risks & watch-outs
- Watch-outs: flood insurance adds $66/mo; built in 1908 — expect roof / HVAC / electrical / plumbing capex.
- Climate carrying-cost: severe flood risk — expect insurance premiums to compound above CPI over the hold.
Questions for the listing agent
- It's been on market 83 days. Have you received any prior offers? Is the seller open to a 6% concession, seller financing, or rate buy-down credit?
- Built in 1908 — when were the roof, HVAC, electrical panel, plumbing, and water heater last replaced?
- What's the actual annual flood-insurance premium (NFIP or private), and is the property in a SFHA with mandatory coverage?
- Why hasn't it sold? Are there any deal-killer items the seller is aware of (foundation, flood, title, zoning, code violations)?
- Is there a deadline driving the sale (1031 exchange, divorce, estate, relocation)? That informs how much negotiation room exists.
- Crime grade is F in this area — have there been break-ins, vandalism, or insurance claims at this property in the last 3 years? What carrier currently insures it and at what premium?
- What's the average days-on-market for RENTAL listings here right now (not sales)? A rising rental-DOM trend means longer vacancies and softer asking-rent achievability than the comps imply.
- What's the recent tenant-quality profile in this submarket — average credit score on applications, eviction rate, late-payment / NSF rate, and stable-employment percentage? A property-management company in the area should have these aggregated.
- How much new for-sale + rental construction is in the pipeline within 1–3 miles? Heavy new supply typically softens prices + rents 12–24 months out; constrained supply supports both.
Investment metrics
- 1% rule
- 1.12% ✓
- Cap rate
- 8.58%
- Cash-on-cash
- 8.18%
- DSCR
- 1.36
- GRM
- 7.5
CMA / ARV
- ARV (median comp)
- $164,560
- List price
- $109,900
- Delta
- -33.22%
- Verdict
- UNDERPRICED
- Comps
- 20 within 1.0 mi
Show comp detail 12 sales within ~0.75 mi
| Address | Dist | Beds/Ba | Sqft | Sold | Price | $/sf | Match |
|---|---|---|---|---|---|---|---|
| 160 Zenner St | 0.23mi | 3/1.0 (+1) | 1,072 (-1%) | 4mo | $90,000 | $84 | 78 |
| 87 Hagen St | 0.26mi | 3/1.0 (+1) | 1,121 (+3%) | 4mo | $120,000 | $107 | 75 |
| 281 Roslyn Ave Ave | 0.30mi | 3/1.0 (+1) | 1,039 (-4%) | 8mo | $170,000 | $164 | 66 |
| 59 Fisher St | 0.59mi | 3/1.0 (+1) | 1,100 (+1%) | 1mo | $195,000 | $177 | 65 |
| 141 Hagen St | 0.25mi | 3/1.0 (+1) | 961 (-12%) | 8mo | $90,000 | $94 | 57 |
| 133 Freund St | 0.56mi | 3/2.0 (+1) | 1,143 (+5%) | 8mo | $130,000 | $114 | 49 |
| 74 Domedion Ave | 0.57mi | 3/1.0 (+1) | 1,196 (+10%) | 4mo | $120,000 | $100 | 48 |
| 67 Montana Ave | 0.59mi | 3/1.0 (+1) | 1,182 (+9%) | 9mo | $68,000 | $58 | 45 |
| 76 Humason Ave | 0.67mi | 3/1.0 (+1) | 1,212 (+12%) | 4mo | $125,000 | $103 | 42 |
| 28 Alma Ave | 0.65mi | 3/1.0 (+1) | 1,210 (+11%) | 6mo | $77,000 | $64 | 41 |
| 49 Erb St | 0.64mi | 3/1.0 (+1) | 1,216 (+12%) | 6mo | $155,000 | $127 | 40 |
| 98 E End Ave | 0.69mi | 3/2.0 (+1) | 1,217 (+12%) | 2mo | $160,000 | $131 | 37 |
Match score weights: distance 35% · size 25% · config 20% · recency 20%. Top-matched comps best support the ARV.
Projected returns pro-forma
-3.0% appreciation · 0.67% rent growth · sell at horizon
- IRR
- -10.5%
- Equity multiple
- 0.63×
- Total profit
- $-11,433
- Equity at exit
- $16,386
- IRR
- -5.0%
- Equity multiple
- 0.71×
- Total profit
- $-8,971
- Equity at exit
- $9,502
Cash invested: $30,772 (down + closing). Projections, not guarantees.
Landlord ↔ Tenant lean methodology
- Overall (STATE)
- 15 Strongly Tenant-Friendly
- State New York
- 15 Strongly Tenant-Friendly · D+10
- County
- — inherits STATE
- City
- — inherits STATE
ZIP-level market 14215
- Home prices YoY
- -30.0%
- Rents YoY
- 0.7%
- Active inventory
- 239
- Price-to-rent
- 7.5×
Monthly cashflow live
- Estimated rent
- $1,227 high interval (Pro) →
- Mortgage (P&I)
- −$576
- Tax est. 1.5%
- −$137 /mo · $1,648/yr
- Insurance
- −$46
- Flood insurance flood zone
- −$66 /mo · $798/yr
- HOA
- −$0
- Vacancy / Maint / Mgmt
- −$258
- Net cashflow
- $143
Break-even live
Sensitivity live
| Price | -10% $219 | -5% $181 | +0% $143 | +5% $105 | +10% $67 |
|---|---|---|---|---|---|
| Rent | -10% $46 | -5% $95 | +0% $143 | +5% $192 | +10% $240 |
| Rate | -1.0pp $199 | -0.5pp $171 | base $143 | +0.5pp $115 | +1.0pp $86 |
UW: 25.0% down · 7.5% · 30yr · 1.5% tax · 5.0% vac · 8.0% maint · 8.0% mgmt
Financing live
Cash to close
- Down payment
- $27,475
- Closing costs
- $3,297
- Reserves months
- —
- Total cash needed
- —
Loan-product check · same deal, 3 products live
Conventional
25% down · 7.5% · 30yr
- Down + closing
- —
- Monthly P&I
- —
- Monthly cashflow
- —
- DSCR
- —
- Eligible?
- —
Personal DTI + credit; lowest rate.
DSCR
20% down · 8.5% · 30yr
- Down + closing
- —
- Monthly P&I
- —
- Monthly cashflow
- —
- DSCR
- —
- Eligible?
- —
No personal income docs; deal must DSCR.
Hard money
10% down · 12.0% · 12mo
- Down + closing
- —
- Monthly P&I
- —
- Monthly cashflow
- —
- DSCR
- —
- Eligible?
- —
Short-term bridge; refi at stabilization.
Rent comps 20 comps
| Address | Beds | Baths | Sqft | Rent | $/sqft | DOM | Units | Dist |
|---|---|---|---|---|---|---|---|---|
| 56 Hagen St #2 Buffalo, NY | 2.0 | 1.0 | 850 | $950 | $1.12 | 45d | 1 | 0.27mi |
| 249 Newburgh Ave Unit 2 Buffalo, NY | 2.0 | 1.0 | 930 | $1,300 | $1.40 | 45d | 1 | 0.33mi |
| 61 Courtland Ave Unit Lower Buffalo, NY | 2.0 | 1.0 | 1000 | $1,300 | $1.30 | 45d | 1 | 0.40mi |
| 67 Moeller St Unit UPPER Buffalo, NY | 3.0 | 1.0 | 960 | $1,000 | $1.04 | 4d | 1 | 0.54mi |
| 67 Moeller St Unit LOWER Buffalo, NY | 3.0 | 1.0 | 960 | $1,200 | $1.25 | 25d | 1 | 0.54mi |
| 160 Courtland Ave Buffalo, NY | 2.0 | 1.0 | 810 | $1,025 | $1.27 | 15d | 1 | 0.54mi |
| 17 Proctor Ave Unit 1 Buffalo, NY | 2.0 | 1.0 | 900 | $1,100 | $1.22 | 45d | 1 | 0.59mi |
| 74 Dorris Ave Buffalo, NY | 3.0 | 1.0 | 1200 | $1,450 | $1.21 | 45d | 1 | 0.60mi |
| 50 Pine Ridge Ter Unit 3 Cheektowaga, NY | 2.0 | 1.0 | 900 | $1,400 | $1.56 | 18d | 1 | 0.91mi |
| 90 Sussex St Unit 2 Buffalo, NY | 2.0 | 1.0 | 1000 | $1,000 | $1.00 | 45d | 1 | 0.92mi |
| 103 Preston Rd Unit Lower Cheektowaga, NY | 2.0 | 1.0 | 882 | $1,300 | $1.47 | 4d | 1 | 1.04mi |
| 24 Euclid Ave Buffalo, NY | 3.0 | 2.0 | 1150 | $1,700 | $1.48 | 45d | 1 | 1.04mi |
| 408 Winslow Ave Unit 2 Buffalo, NY | 3.0 | 1.0 | 1000 | $1,050 | $1.05 | 15d | 1 | 1.29mi |
| 1202 Walden Ave Unit 3 Buffalo, NY | 3.0 | 1.0 | 1500 | $1,400 | $0.93 | 18d | 1 | 1.31mi |
| 1202 Walden Ave Unit 2 Buffalo, NY | 3.0 | 1.0 | 800 | $1,350 | $1.69 | 45d | 1 | 1.31mi |
| 11 Kaufman Dr Buffalo, NY | 2.0 | 1.0 | 900 | $1,500 | $1.67 | 45d | 1 | 1.31mi |
| 97 Davidson Ave Buffalo, NY | 3.0 | 1.0 | 925 | $1,495 | $1.62 | 3d | 1 | 1.33mi |
| 143 Reo Ave Buffalo, NY | 3.0 | 2.0 | 1143 | $1,600 | $1.40 | 13d | 1 | 1.34mi |
| 1777 Broadway Unit 2 Buffalo, NY | 3.0 | 1.0 | 1300 | $1,200 | $0.92 | 45d | 1 | 1.44mi |
| 140 Parkridge Ave Buffalo, NY | 3.0 | 1.0 | 990 | $1,500 | $1.52 | 45d | 1 | 1.50mi |
Listing history 18 events
-
2026-06-21days on market $109,900 Active 83 DOM
-
2026-06-18days on market $109,900 Active 80 DOM
-
2026-06-17days on market $109,900 Active 79 DOM
-
2026-06-16days on market $109,900 Active 78 DOM
-
2026-06-15days on market $109,900 Active 77 DOM
-
2026-06-13days on market $109,900 Active 75 DOM
-
2026-06-13days on market $109,900 Active 74 DOM
-
2026-06-10days on market $109,900 Active 72 DOM
-
2026-06-09days on market $109,900 Active 71 DOM
-
2026-06-08days on market $109,900 Active 70 DOM
-
2026-06-07pricedays on market $109,900 Active 69 DOM
-
2026-06-03days on market $128,500 Active 65 DOM
-
2026-06-02days on market $128,500 Active 64 DOM
-
2026-06-01days on market $128,500 Active 63 DOM
-
2026-05-31days on market $128,500 Active 62 DOM
-
2026-04-17price $128,500 770-char remark
Show marketing remark (770 chars)
Welcome to 27 Lang Ave in Buffalo—a solid opportunity for both homeowners and investors. This single-family home features 3 bedrooms, 1 full bath, comfortable carpeted floors, and a full basement offering additional storage or potential for future use. Currently tenant-occupied at $870/month, it provides steady income from day one or the option to transition to owner occupancy. The home offers solid mechanicals, helping minimize immediate maintenance concerns and making it a reliable choice for any buyer. Conveniently located near public transportation, shopping, dining, and other local amenities, this property combines affordability, functionality, and accessibility. Whether you're looking to expand your investment portfolio or find a place to call home
-
2026-03-30$129,000 Active 770-char remark
Show marketing remark (770 chars)
Welcome to 27 Lang Ave in Buffalo—a solid opportunity for both homeowners and investors. This single-family home features 3 bedrooms, 1 full bath, comfortable carpeted floors, and a full basement offering additional storage or potential for future use. Currently tenant-occupied at $870/month, it provides steady income from day one or the option to transition to owner occupancy. The home offers solid mechanicals, helping minimize immediate maintenance concerns and making it a reliable choice for any buyer. Conveniently located near public transportation, shopping, dining, and other local amenities, this property combines affordability, functionality, and accessibility. Whether you're looking to expand your investment portfolio or find a place to call home
-
2021-03-01soldstatus $830,000
ⓘ Source: listings_history table (triggers on properties + properties_extension) + one-shot
backfill from property_details.listing_events for pre-trigger history.
Climate risk First Street
- Flood 8/10 Severe FEMA zone X (unshaded) · 99% chance over 30 yrs
- Wildfire 1/10 Low
- Heat 3/10 Moderate 7 d/yr ≥93°F today · 15 d/yr by 30 yrs out
- Wind 1/10 Low
- Air quality 3/10 Moderate 2 unhealthy d/yr today · 3 by 30 yrs out
Nearby sold comps map
Loading sold comps map…
Walkable amenities ~0.75 mi
Loading nearby amenities…
Taxation est. · year 1
- Rental income
- $14,723
- − Mortgage interest
- −$6,156
- − Property taxes
- −$1,648
- − Insurance
- −$1,347
- − Repairs & maintenance
- −$1,178
- − Management
- −$1,178
- − Depreciation
- −$3,197
- Taxable income
- $18
- Est. tax owed @ 24.0%
- −$4
- After-tax cash flow
- $1,715/yr
For passive investors: Depreciation is non-cash, so a rental often shows a tax loss while cash-flowing — sheltering income. Rental losses are passive: they offset passive income freely, and up to $25,000/yr can offset ordinary (W-2) income if you actively participate and your MAGI is under $100k (phasing out to $0 by $150k); unused losses carry forward. On sale, claimed depreciation is recaptured at up to 25%, and gains may owe capital-gains tax (a 1031 exchange can defer both). Figures are a year-1 estimate at your 24.0% rate — not tax advice; consult a CPA.
Schools (NCES district)
- District
- Buffalo City School District
- NCES district ID
- 3605850
- Math proficiency
- 41% ▲ 11.00%
- Reading proficiency
- 40% ▲ 7.00%
- Median HH income
- $31,665
- Composite
- 33.17/100
- National rank
- #5544
- State rank
- #535 of 590 in NY
Livability — Buffalo
- Score
- 77/100
- State rank
- #195
- US rank
- #3011
Category grades
Schools grade is shown separately in the Schools card above.
Census & demographics
- Census place
- Buffalo, NY
- County
- Erie County · 714,559 people
- City population
- 440,021
- Metro
- Buffalo-Cheektowaga, NY
- Population (ZIP)
- 42,524
- Household income
- $44,955
- Rent vs Own
- Severe rent burden
- 2873.0
Population outlook (Erie County) Hauer SSP2
- Today (2025)
- 933,037 people
- By 2030
- 935,181 · +0.2%
- By 2040
- 928,531 · -0.5%
- By 2050
- 905,725 · -2.9%
- By 2075
- 834,037 · -10.6%
- By 2100
- 708,033 · -24.1%
Race, ethnicity, and origin ACS 2023
- Neighborhood character
- Predominantly Black (67%)
- Race & ethnicity
- Black 67% White 15% Asian 7% Hispanic / Latino 6% Two or more races 6%
- Hispanic origin (detail)
- Puerto Rican 4%
- Common ancestry
- Romanian 4% Lithuanian 1% Italian 1%
- Foreign-born
- 9% · Canada, China
- Languages at home
- 88% English-only · Other Indo-European 4% Spanish 4% Chinese 1%
Political lean MEDSL · Erie
- 2024 margin
- Lean D (+9.7) · D 54.8% · R 45.2%
- 2008→2024 swing
- -7.9pp toward R · 2008: 17.5pp · 2024: 9.7pp
- All cycles
- 2024: D+9.7 2020: D+14.7 2016: D+4.8 2012: D+15.6 2008: D+17.5
Not yet ingested
- Civics
- —
Market trends
- HPI YoY
- ▼ -126.29%
- Current HPI
- 295.2966
- Rent YoY
- ▲ 0.67%
- Metro
- Buffalo-Cheektowaga, NY
- State GDP YoY
- ▲ 2.60%
- F500 in state
- 92
Industry mix (Fortune 500 HQ in NY)
| Industry | F500 HQs | Revenue |
|---|---|---|
| Financial Services | 10 | $950B |
|
||
| Consumer Goods | 9 | $162B |
|
||
| Insurance | 4 | $225B |
|
||
| Telecommunications | 2 | $144B |
|
||
| Pharmaceuticals | 2 | $112B |
|
||
| Media / Entertainment | 2 | $69B |
|
||
Price history
-84.5% since first listed3 events — show timeline
- 2026-04-17 Price Changed $128,500 WNYREIS
- 2026-03-30 Listed $129,000 WNYREIS
- 2021-03-01 Sold (Public Records) $830,000 Public Records
Property tax history
+6.5%/yrLatest (2025): $219 · +0.0% YoY. Source: county tax records.
Cash-flow waterfall
monthlySold comps — $/sqft
last 12 mo · ≤1 miLoading sold comps…