 Multi-family
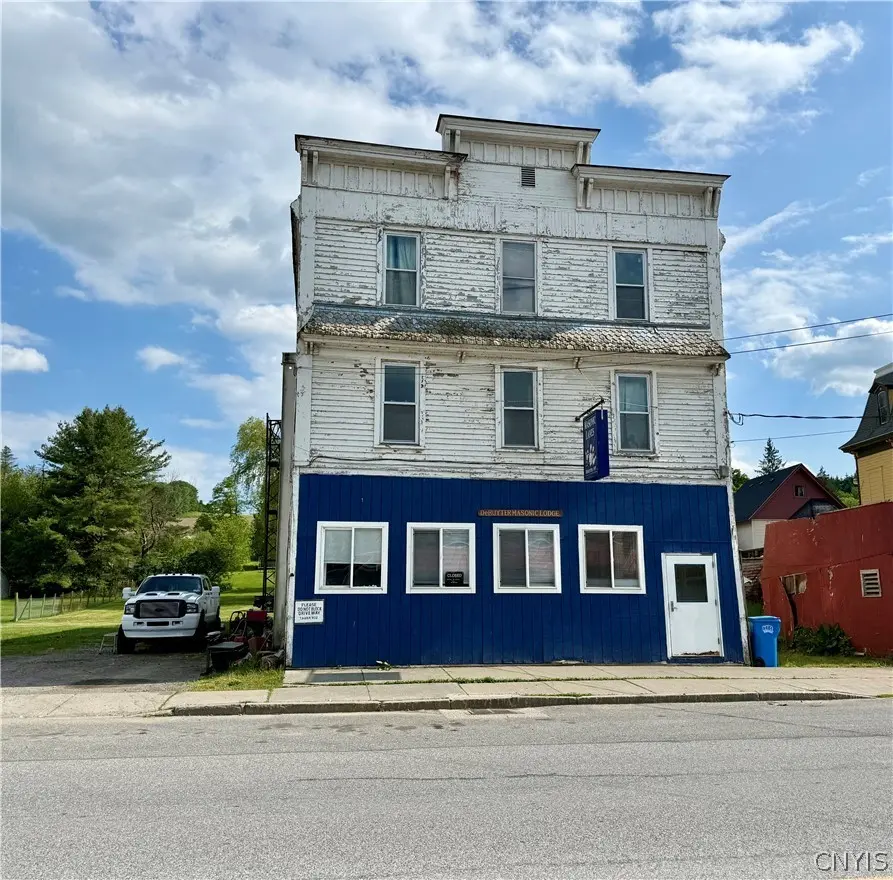
1696 Albany St · DeRuyter, NY
Flood risk No data
- FEMA flood zone
- —
- Chance of flooding over 30 yrs
- —
- Est. flood insurance / yr
- —
Fire risk No data
- Est. fire insurance / yr
- —
Heat risk No data
- Hot days now (above threshold)
- —
- Hot days in 30 yrs
- —
Wind risk No data
- Chance of severe wind over 30 yrs
- —
Air-quality risk No data
- Unhealthy air days now
- —
- Unhealthy air days in 30 yrs
- —
Risk factors via First Street. Map © Google.
Why this score? — see what drove the C- grade
The composite is a weighted blend of 9 inputs, each scored 0–100. Each bar is that input's sub-score; the figure is the points it added to the 100-point composite (weight × sub-score).
- Cash flow +15.0/30.0
- ARV discount +7.5/15.0
- Appreciation +7.5/10.0
- 1% rule +5.0/10.0
- DSCR +5.0/10.0
- Schools +3.9/10.0
- Livability +3.1/5.0
- Rent growth +2.5/5.0
- Condition / age +1.0/5.0
$95,000
🖨 Deal sheet 📄 Offer letter ✓ Due diligence
Multi-family units
County records classify this as Multi-Family (2-4 Unit). Listing-text estimate: 1 unit. estimate disagrees with records
Listing remarks
An opportunity like this doesn't come around often. Fully turnkey business, plus 2 fully rented apartments for under 100K! This 4 lane bowling alley comes with all the equipment needed, bowling shoes, bowling balls, and more. Leagues have already signed up for the next season that starts in September. The current owner has done a lot, not only to the bowling alley but the apartments upstairs as well. The lanes have been recently updated, neon lights have been installed for night bowling too, and there is a digital juke box with top-of-the-line speakers perfect for rock n bowl. There is also a bar area with refrigeration for beverages and a flat top grill perfect for hamburger and hot dogs.
Key facts
- 0.37 acre lot
- 2 parking spots
- Built 1908
Property features AI
Finance
- Other: Multi-unit property with 2 total units; Three separate electric meters and one shared gas meter
- Financial info: Tenant pays all utilities; Professional management included in operating expenses
Exterior
- Parking: Gravel parking; Two or more parking spaces
- Utilities: Public water connected; Sewer connected
- Home design: 3 stories; Resale property
- Construction: Wood siding construction; Existing structure
- Exterior features: Rectangular lot; Road frontage on a main thoroughfare
Interior
- Kitchen: Unit includes oven/range; Unit includes refrigerator; Eat-in kitchen
- Bedrooms: One unit with 3 bedrooms
- Flooring: Carpet; Hardwood; Vinyl; Varied flooring
- Bathrooms: Two full bathrooms total; Each unit includes 1 full bathroom
- Heating & cooling: Has heating; Electric heating; Gas heating; Baseboard heating; Wall furnace
- Interior features: Full basement
- Laundry & utility: Electric water heater
Neighborhood map
What this means for you Summary
Snapshot
- This is a 5-bed/2.0-bath multifamily listed at $95k. Condition is rated poor.
Deal economics
- At list price, monthly cash flow is $3k ($33k/yr) — positive.
- The deal already cash-flows at list — no discount required.
- Meets the 1% rule at list price ($4k rent vs $95k).
Location & tenants
- Location reads 61/100 on livability (#900 in NY) — a middle-class / working-renter tenant base. Strengths: cost of living A+, housing A+; Watch: employment D, crime F, amenities F.
- Deruyter Central School District (rural): math 45% / reading 40% proficiency, ranked #603 of 755 in NY (top 80%) — families likely to look elsewhere, expect single-tenant / working-renter base with shorter leases.
- Market conditions: 14 active listings in the ZIP; 137 units permitted in Madison County in 2024 (46 in 5+ unit buildings).
Forward outlook
- In year one you build about $5k of equity ($657 loan paydown + $5k appreciation (5.0% local appreciation)).
- Madison County population projected at -24% by 2050 — secular population decline; favor cash flow + early exit over multi-decade hold.
- At projected returns (5.0% appreciation + 3.0% rent growth), your $27k cash investment doubles in ~1 year — after that, you're playing with house money.
- By year 7, paydown + projected appreciation supports a ~$35k cash-out refi (75% LTV) — recoverable capital for the next deal without selling this one.
Negotiation context
- Only 5 days on market — expect competitive offers; lowballing is unlikely to land.
Risks & watch-outs
- Watch-outs: built in 1908 — expect roof / HVAC / electrical / plumbing capex.
Questions for the listing agent
- Have any recent inspections been done? Can we get a copy of the seller's disclosures and any deferred-maintenance estimates?
- Built in 1908 — when were the roof, HVAC, electrical panel, plumbing, and water heater last replaced?
- Is there a deadline driving the sale (1031 exchange, divorce, estate, relocation)? That informs how much negotiation room exists.
- Crime grade is F in this area — have there been break-ins, vandalism, or insurance claims at this property in the last 3 years? What carrier currently insures it and at what premium?
- What's the average days-on-market for RENTAL listings here right now (not sales)? A rising rental-DOM trend means longer vacancies and softer asking-rent achievability than the comps imply.
- What's the recent tenant-quality profile in this submarket — average credit score on applications, eviction rate, late-payment / NSF rate, and stable-employment percentage? A property-management company in the area should have these aggregated.
- How much new apartment / multifamily construction is in the pipeline within 1–3 miles? Heavy new supply (>2% of stock underway) typically softens rents 12–24 months out; light construction supports rent growth.
Investment metrics
- 1% rule
- 4.55% ✓
- Cap rate
- 41.09%
- Cash-on-cash
- 124.27%
- DSCR
- 6.53
- GRM
- 1.8
CMA / ARV
No comps found within radius.
Projected returns pro-forma
4.96% appreciation · 3.0% rent growth · sell at horizon
- IRR
- —
- Equity multiple
- 8.41×
- Total profit
- $197,196
- Equity at exit
- $53,609
- IRR
- —
- Equity multiple
- 17.72×
- Total profit
- $444,684
- Equity at exit
- $92,334
Cash invested: $26,600 (down + closing). Projections, not guarantees.
Landlord ↔ Tenant lean methodology
- Overall (STATE)
- 15 Strongly Tenant-Friendly
- State New York
- 15 Strongly Tenant-Friendly · D+10
- County
- — inherits STATE
- City
- — inherits STATE
ZIP-level market 13052
- Home prices YoY
- 1.9%
- Active inventory
- 14
- Price-to-rent
- 7.3×
Monthly cashflow live
- Estimated rent
- $4,318 medium interval (Pro) →
- Mortgage (P&I)
- −$498
- Tax est. 1.5%
- −$119 /mo · $1,425/yr
- Insurance
- −$40
- HOA
- −$0
- Vacancy / Maint / Mgmt
- −$907
- Net cashflow
- $2,755
Break-even live
4-unit breakdown (identical units grouped — click to expand)
| Units | Beds | Baths | Est. rent |
|---|---|---|---|
| 4× units | 2 | 1.5 | $4,320 |
| #1 | 2 | 1.5 | $1,080 |
| #2 | 2 | 1.5 | $1,080 |
| #3 | 2 | 1.5 | $1,080 |
| #4 | 2 | 1.5 | $1,080 |
| Total (4 units) | $4,318 | ||
UW: 25.0% down · 7.5% · 30yr · 1.5% tax · 5.0% vac · 8.0% maint · 8.0% mgmt
Financing live
Cash to close
- Down payment
- $23,750
- Closing costs
- $2,850
- Reserves months
- —
- Total cash needed
- —
Loan-product check · same deal, 3 products live
Conventional
25% down · 7.5% · 30yr
- Down + closing
- —
- Monthly P&I
- —
- Monthly cashflow
- —
- DSCR
- —
- Eligible?
- —
Personal DTI + credit; lowest rate.
DSCR
20% down · 8.5% · 30yr
- Down + closing
- —
- Monthly P&I
- —
- Monthly cashflow
- —
- DSCR
- —
- Eligible?
- —
No personal income docs; deal must DSCR.
Hard money
10% down · 12.0% · 12mo
- Down + closing
- —
- Monthly P&I
- —
- Monthly cashflow
- —
- DSCR
- —
- Eligible?
- —
Short-term bridge; refi at stabilization.
Listing history 6 events
-
2026-06-18days on market $95,000 Active 5 DOM
-
2026-06-17days on market $95,000 Active 4 DOM
-
2026-06-16days on market $95,000 Active 3 DOM
-
2026-06-15days on market $95,000 Active 2 DOM
-
2026-06-13remarks 699-char remark
-
2026-06-13$95,000 Active 1 DOM
ⓘ Source: listings_history table (triggers on properties + properties_extension) + one-shot
backfill from property_details.listing_events for pre-trigger history.
Nearby sold comps map
Loading sold comps map…
Walkable amenities ~0.75 mi
Loading nearby amenities…
Taxation est. · year 1
- Rental income
- $51,816
- − Mortgage interest
- −$5,321
- − Property taxes
- −$1,425
- − Insurance
- −$475
- − Repairs & maintenance
- −$4,145
- − Management
- −$4,145
- − Depreciation
- −$2,764
- Taxable income
- $33,540
- Est. tax owed @ 24.0%
- −$8,050
- After-tax cash flow
- $25,007/yr
For passive investors: Depreciation is non-cash, so a rental often shows a tax loss while cash-flowing — sheltering income. Rental losses are passive: they offset passive income freely, and up to $25,000/yr can offset ordinary (W-2) income if you actively participate and your MAGI is under $100k (phasing out to $0 by $150k); unused losses carry forward. On sale, claimed depreciation is recaptured at up to 25%, and gains may owe capital-gains tax (a 1031 exchange can defer both). Figures are a year-1 estimate at your 24.0% rate — not tax advice; consult a CPA.
Condition & rehab AI · 2 photos
This multi-family property requires extensive repairs and maintenance, including painting, siding repair, and roof inspection. Immediate action is needed to improve its condition and increase its resale or rental value.
Repairs flagged
- Major Painting — Peeling paint indicates significant wear and tear
- Major Siding repair — Exposed siding suggests potential water damage
- Major Roof inspection — No visible roof damage, but the siding suggests potential water damage
Value-add opportunities
- Both Painting and repainting — Fresh paint would improve curb appeal and interior aesthetics
- Both Siding repair — Repairing the siding would prevent further water damage and improve the home's appearance
- Both Roof inspection and repair — Ensuring the roof is in good condition would prevent costly future repairs and improve the home's value
Renovation cost estimate screening
| Repair item | Severity | Est. cost |
|---|---|---|
| Painting · Peeling paint indicates significant wear and tear | Major | $15,000–50,000 |
| Siding repair · Exposed siding suggests potential water damage | Major | $15,000–50,000 |
| Roof inspection · No visible roof damage, but the siding suggests potential water damage | Major | $15,000–50,000 |
| Total estimated repair cost · 3 items | $45,000–150,000 |
Value-add ROI direction
- Both Painting and repainting — Fresh paint would improve curb appeal and interior aesthetics ↑
- Both Siding repair — Repairing the siding would prevent further water damage and improve the home's appearance ↑
- Both Roof inspection and repair — Ensuring the roof is in good condition would prevent costly future repairs and improve the home's value ↑
ⓘ Cost ranges are severity-bucket heuristics (US national rule-of-thumb). Get contractor quotes + a written scope before underwriting a rehab budget.
Schools (NCES district)
- District
- Deruyter Central School District
- NCES district ID
- 3608850
- Math proficiency
- 45% ▬ 0.00%
- Reading proficiency
- 40% ▼ -15.00%
- Median HH income
- $48,656
- Composite
- 38.77/100
- National rank
- #8368
- State rank
- #603 of 755 in NY
Livability — DeRuyter
- Score
- 61/100
- State rank
- #900
- US rank
- #17540
Category grades
Schools grade is shown separately in the Schools card above.
Census & demographics
- Census place
- DeRuyter, NY
- Population (ZIP)
- 1,762
Population outlook (Madison County) Hauer SSP2
- Today (2025)
- 69,528 people
- By 2030
- 66,599 · -4.2%
- By 2040
- 59,814 · -14.0%
- By 2050
- 52,842 · -24.0%
- By 2075
- 39,167 · -43.7%
- By 2100
- 28,442 · -59.1%
Race, ethnicity, and origin ACS 2023
- Neighborhood character
- Predominantly White (98%)
- Race & ethnicity
- White 98% Two or more races 2%
- Common ancestry
- Iranian 3% Lithuanian 2% Slovak 2%
- Foreign-born
- 2%
- Languages at home
- 98% English-only · Spanish 1%
Political lean MEDSL · Madison
- 2024 margin
- R (+13.1) · D 43.5% · R 56.5%
- 2008→2024 swing
- -13.9pp toward R · 2008: 0.9pp · 2024: -13.1pp
- All cycles
- 2024: R+13.1 2020: R+10.6 2016: R+15.9 2012: D+0.3 2008: D+0.9
Not yet ingested
- Civics
- —
Market trends
- HPI YoY
- ▲ 4.96%
- Current HPI
- 259.8904
- Rent YoY
- —
- Metro
- —
- State GDP YoY
- ▲ 2.60%
- F500 in state
- 92
Industry mix (Fortune 500 HQ in NY)
| Industry | F500 HQs | Revenue |
|---|---|---|
| Financial Services | 10 | $950B |
|
||
| Consumer Goods | 9 | $162B |
|
||
| Insurance | 4 | $225B |
|
||
| Telecommunications | 2 | $144B |
|
||
| Pharmaceuticals | 2 | $112B |
|
||
| Media / Entertainment | 2 | $69B |
|
||
Price history
1 event — show timeline
- 2026-06-13 Listed $95,000 CNYIS
Cash-flow waterfall
monthlySold comps — $/sqft
last 12 mo · ≤1 miLoading sold comps…