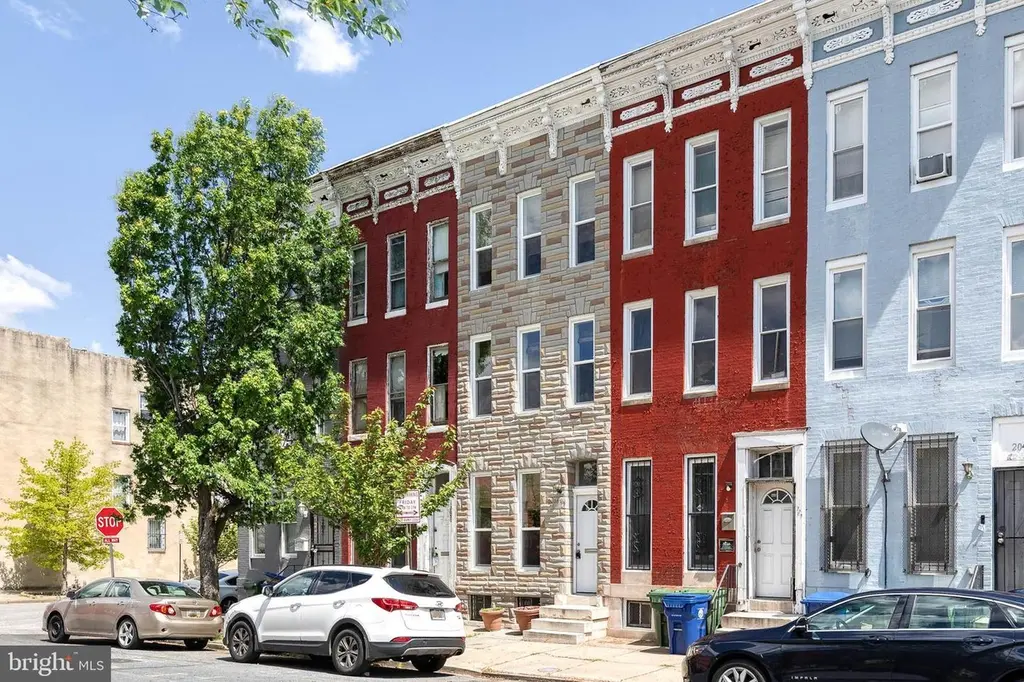
2049 Division St · Baltimore, MD
Flood risk 3/10 · Minor
- FEMA flood zone
- X (unshaded)
- Chance of flooding over 30 yrs
- 0.1%
- Est. flood insurance / yr
- $473 – $860
Fire risk 1/10 · Minimal
- Est. fire insurance / yr
- $755 – $1,403
Heat risk 7/10 · Major
- Hot days now (above 103°F)
- 7 days/yr
- Hot days in 30 yrs
- 15 days/yr
Wind risk 6/10 · Moderate
- Chance of severe wind over 30 yrs
- 27.0%
Air-quality risk 4/10 · Minor
- Unhealthy air days now
- 6 days/yr
- Unhealthy air days in 30 yrs
- 7 days/yr
Risk factors via First Street. Map © Google.
Why this score? — see what drove the D grade
The composite is a weighted blend of 9 inputs, each scored 0–100. Each bar is that input's sub-score; the figure is the points it added to the 100-point composite (weight × sub-score).
- Cash flow +16.7/30.0
- ARV discount +7.5/15.0
- DSCR +5.2/10.0
- Rent growth +4.2/5.0
- Livability +3.8/5.0
- 1% rule +3.7/10.0
- Condition / age +2.5/5.0
- Schools +1.0/10.0
- Appreciation +0.0/10.0
$235,000
🖨 Deal sheet (PDF) 📄 Offer letter ✓ Due diligence
Listing remarks MLS
This is it!! Totally renovated row home with all the upgrades you want! New wood floors, exposed brick walls. Fully remodeled kitchen in 2016 w/ SS appliances, granite countertops. Bathrooms are also renovated with granite vanity tops, glass shower doors. Energy efficient utilities, including tankless hot water tank, wireless alarm system! Too many upgrades to list! This is a must see!
Key facts
- Built 1920
- Listed 51 days
Property features AI
Exterior
- Parking: On-street parking
- Security: Insulated doors and insulated windows
- Utilities: Public water; Public sewer; Electric service
- Home design: Interior townhouse/rowhouse; Fee simple ownership; Effective year of major remodel 2016; Property in excellent to very good condition
- Construction: Brick construction; Permanent foundation; Rubber roof; Above-grade structure
- Exterior features: Patio(s); Fully fenced rear yard with wood and chain link fencing
Interior
- Kitchen: Stove; Built-in microwave; Dishwasher; Disposal; Refrigerator; Stainless steel appliances; Energy-efficient appliances; Eat-in kitchen / dining area
- Bedrooms: Two bedrooms on the first upper level; One bedroom on the second upper level; Master bedroom included
- Flooring: Engineered wood; Ceramic tile; Concrete
- Bathrooms: Two full bathrooms (both on upper levels); One half bathroom on the main level
- Heating & cooling: Central heating (Energy Star heating system); Natural gas heating fuel; Central air conditioning; Ceiling fans; Electric hot water
- Interior features: Open floor plan with combination dining/living areas; Traditional floor plan elements; Recessed lighting; Upgraded countertops; Ceiling fans; Walk-in closet(s); Master bath with soaking tub and stall shower; Tub/shower combination; Brick walls/ceiling accents
- Laundry & utility: Washer and dryer included; Laundry located in the basement
Neighborhood map
What this means for you Summary
Snapshot
- This is a 3-bed/2.5-bath townhouse listed at $235k.
Deal economics
- At list price, monthly cash flow is $148 ($2k/yr) — positive.
- The deal already cash-flows at list — no discount required.
- To meet the 1% rule (rent ≥ 1% of price), the offer needs to be $205k (12.8% below list).
- Recommended offer: $205k (12.8% below list) — sets the bar for 1% rule.
Location & tenants
- Location reads 76/100 on livability (#90 in MD, #3,396 nationally) — a middle-class / working-renter tenant base. Strengths: amenities A+, commute A+, housing A+; Watch: crime F.
- Baltimore City Public Schools (urban): math 7% / reading 16% proficiency, ranked #24 of 24 in MD (top 100%) — low school quality limits family demand, transient renter base, plan for 1-2y turnover; 79% free/reduced lunch — lower-income household profile, screen leases tightly.
- Zoned schools: Elmer A. Henderson: A Johns Hopkins Partnership (math 2% / reading 16%, grade F, #650 of 860 statewide, top 77%, 642 students, 80% FRL); Baltimore Polytechnic Institute (math 71% / reading 84%, grade A-, #22 of 222 statewide, top 10%, 1,555 students, 43% FRL) — zoned schools average 62% FRL vs 79% district-wide (17 pts lower); this property's tenant base skews higher-income than the district average.
- Zoned-school proficiency averages 43% at this address vs 12% district-wide (+32 pts) — the actual schools serving this property are materially stronger than the Baltimore City Public Schools average implies; a family-tenant draw the district grade alone would hide.
- Market conditions: Rents rising fast (+6.6%/yr); 333 active listings in the ZIP; 40 comparable units currently listed for rent nearby; rentals at typical pace (median 26d on market — plan ~3-4 weeks tenant-placement turnaround); lower-income renter base — watch delinquency; 1,273 units permitted in Baltimore city in 2024 (1,104 in 5+ unit buildings).
- At $2,050/mo this rent would consume 64% of the median local household income ($38k/yr) (locally 2921% of renters already pay >50% of income on rent) — very limited rent-growth headroom before tenants either downsize or default.
Forward outlook
- Local home prices are declining (-3.0%/yr); year-one equity from $2k of loan paydown is wiped out by about $7k of value loss. Plan a longer hold.
- Baltimore County population projected to shrink 4% by 2050 — rents likely to lag national; underwrite the cash flow, not the appreciation.
Negotiation context
- It's been on market 52 days — a 3% lower offer ($228k) is reasonable based on typical stale-listing flexibility.
- 6 sale attempts since 12y ago with the ask held roughly flat each time — persistent listings suggest the price (not the market) is what's stuck; bring a comps-based counter.
- Current owner paid $149k; list at $235k implies a 58% gain — meaningful room to come down on a strong offer.
Risks & watch-outs
- Watch-outs: built in 1920 — expect roof / HVAC / electrical / plumbing capex.
- Climate carrying-cost: major wind risk, 27% chance of damaging wind over 30y; extreme-heat days projected 7→15/yr by 2055 (HVAC capex compounding) — expect insurance premiums to compound above CPI over the hold.
Questions for the listing agent
- It's been on market 52 days. Have you received any prior offers? Is the seller open to a 13% concession, seller financing, or rate buy-down credit?
- Built in 1920 — when were the roof, HVAC, electrical panel, plumbing, and water heater last replaced?
- Is there a deadline driving the sale (1031 exchange, divorce, estate, relocation)? That informs how much negotiation room exists.
- Schools are D-rated, which usually means shorter tenancies and higher turnover. Who's the typical renter profile here, and what's been the actual vacancy rate?
- Crime grade is F in this area — have there been break-ins, vandalism, or insurance claims at this property in the last 3 years? What carrier currently insures it and at what premium?
- The area grade is low — what's the realistic commute time and amenity access for the typical tenant pool here? Any planned neighborhood developments (good or bad) we should know about?
- What's the average days-on-market for RENTAL listings here right now (not sales)? A rising rental-DOM trend means longer vacancies and softer asking-rent achievability than the comps imply.
- What's the recent tenant-quality profile in this submarket — average credit score on applications, eviction rate, late-payment / NSF rate, and stable-employment percentage? A property-management company in the area should have these aggregated.
- How much new for-sale + rental construction is in the pipeline within 1–3 miles? Heavy new supply typically softens prices + rents 12–24 months out; constrained supply supports both.
Investment metrics
- 1% rule
- 0.87% ✗
- Cap rate
- 7.05%
- Cash-on-cash
- 2.70%
- DSCR
- 1.12
- GRM
- 9.6
CMA / ARV
- ARV (median comp)
- $130,227
- List price
- $235,000
- Delta
- 80.45%
- Verdict
- OVERPRICED
- Comps
- 20 within 1.0 mi
Show comp detail 12 sales within ~0.75 mi
| Address | Dist | Beds/Ba | Sqft | Sold | Price | $/sf | Match |
|---|---|---|---|---|---|---|---|
| 835 Lennox St | 0.43mi | 3/3.5 | 2,075 (-1%) | 3mo | $363,740 | $175 | 72 |
| 1340 Division St | 0.53mi | 3/3.0 | 2,098 (-0%) | 2mo | $290,520 | $138 | 71 |
| 810 Watts St | 0.45mi | 3/4.0 | 2,075 (-1%) | 0mo | $433,990 | $209 | 71 |
| 1342 Division St | 0.53mi | 3/3.0 | 2,098 (-0%) | 3mo | $315,000 | $150 | 71 |
| 2028 Bolton St Unit CLARENDON 4ST SPEC | 0.46mi | 3/4.0 | 2,075 (-1%) | 3mo | $389,990 | $188 | 68 |
| 1746 Park Ave | 0.52mi | 4/— (+1) | 2,159 (+3%) | 2mo | $570,000 | $264 | 65 |
| 1336 Division St | 0.54mi | 3/3.0 | 2,002 (-5%) | 3mo | $342,800 | $171 | 63 |
| 833 Lennox St | 0.43mi | 4/4.5 (+1) | 2,075 (-1%) | 3mo | $419,990 | $202 | 62 |
| 801 Druid Park Lake Dr | 0.66mi | 4/3.5 (+1) | 2,013 (-4%) | 1mo | $451,500 | $224 | 52 |
| 1520 Appleton St | 0.65mi | 3/3.5 | 1,920 (-9%) | 4mo | $215,000 | $112 | 48 |
| 2500 Brookfield Ave | 0.57mi | 3/3.0 | 1,786 (-15%) | 1mo | $365,000 | $204 | 46 |
| 256 Waxter Way | 0.71mi | 4/3.5 (+1) | 1,836 (-13%) | 0mo | $450,000 | $245 | 37 |
Match score weights: distance 35% · size 25% · config 20% · recency 20%. Top-matched comps best support the ARV.
Projected returns pro-forma
-3.0% appreciation · 6.63% rent growth · sell at horizon
- IRR
- -8.4%
- Equity multiple
- 0.68×
- Total profit
- $-20,965
- Equity at exit
- $35,039
- IRR
- 5.0%
- Equity multiple
- 1.42×
- Total profit
- $27,930
- Equity at exit
- $20,319
Cash invested: $65,800 (down + closing). Projections, not guarantees.
Landlord ↔ Tenant lean methodology
- Overall (CITY)
- 12 Strongly Tenant-Friendly
- State Maryland
- 27 Tenant-Leaning · D+14
- County
- — inherits STATE
- City Baltimore
- 12 Strongly Tenant-Friendly · D+58
ZIP-level market 21217
- Rents YoY
- 6.6%
- Active inventory
- 333
- Price-to-rent
- 9.6×
Monthly cashflow live
- Estimated rent
- $2,050 high interval (Pro) →
- Mortgage (P&I)
- −$1,232
- Tax from tax record
- −$141 /mo · $1,695/yr
- Insurance
- −$98
- HOA
- −$0
- Vacancy / Maint / Mgmt
- −$430
- Net cashflow
- $148
Break-even live
Sensitivity live
| Price | -10% $281 | -5% $214 | +0% $148 | +5% $81 | +10% $15 |
|---|---|---|---|---|---|
| Rent | -10% $-14 | -5% $67 | +0% $148 | +5% $229 | +10% $310 |
| Rate | -1.0pp $266 | -0.5pp $208 | base $148 | +0.5pp $87 | +1.0pp $25 |
UW: 25.0% down · 7.5% · 30yr · 1.5% tax · 5.0% vac · 8.0% maint · 8.0% mgmt
Financing live
Cash to close
- Down payment
- $58,750
- Closing costs
- $7,050
- Reserves months
- —
- Total cash needed
- —
Loan-product check · same deal, 3 products live
Conventional
25% down · 7.5% · 30yr
- Down + closing
- —
- Monthly P&I
- —
- Monthly cashflow
- —
- DSCR
- —
- Eligible?
- —
Personal DTI + credit; lowest rate.
DSCR
20% down · 8.5% · 30yr
- Down + closing
- —
- Monthly P&I
- —
- Monthly cashflow
- —
- DSCR
- —
- Eligible?
- —
No personal income docs; deal must DSCR.
Hard money
10% down · 12.0% · 12mo
- Down + closing
- —
- Monthly P&I
- —
- Monthly cashflow
- —
- DSCR
- —
- Eligible?
- —
Short-term bridge; refi at stabilization.
Rent comps 40 comps
| Address | Beds | Baths | Sqft | Rent | $/sqft | DOM | Units | Dist |
|---|---|---|---|---|---|---|---|---|
| 2028 Druid Hill Ave Baltimore, MD | 3.0 | 2.5 | 1437 | $1,799 | $1.25 | 12d | 1 | 0.08mi |
| 2028 Druid Hill Ave Unit 1 Baltimore, MD | 3.0 | 2.5 | 1437 | $1,750 | $1.22 | 4d | 1 | 0.08mi |
| 2020 McCulloh St Unit 2 Baltimore, MD | 2.0 | 2.0 | 2440 | $1,950 | $0.80 | 45d | 1 | 0.13mi |
| 2020 McCulloh St Unit 1 Baltimore, MD | 2.0 | 2.0 | 2440 | $1,650 | $0.68 | 45d | 1 | 0.13mi |
| 1315 Presstman St Baltimore, MD | 4.0 | 2.0 | 1700 | $2,000 | $1.18 | 45d | 1 | 0.20mi |
| 1725 Druid Hill Ave Baltimore, MD | 4.0 | 3.0 | 2195 | $2,100 | $0.96 | 25d | 1 | 0.24mi |
| 1205 Clendenin St Baltimore, MD | 3.0 | 1.5 | 1560 | $800 | $0.51 | 25d | 1 | 0.27mi |
| 1628 McCulloh St Unit 2 Baltimore, MD | 4.0 | 2.5 | 2000 | $2,000 | $1.00 | 6d | 1 | 0.30mi |
| 1614 McCulloh St #1 Baltimore, MD | 3.0 | 3.0 | 2885 | $2,400 | $0.83 | 45d | 1 | 0.33mi |
| 1702 Eutaw Pl Baltimore, MD | 2.0 | 2.0 | 2000 | $1,550 | $0.78 | 19d | 1 | 0.35mi |
| 549 Mosher St Baltimore, MD | 3.0 | 1.0 | 2200 | $1,350 | $0.61 | 45d | 1 | 0.42mi |
| 1516 N Mount St Baltimore, MD | 3.0 | 1.5 | 1830 | $1,750 | $0.96 | 16d | 1 | 0.43mi |
| 815 Lennox St Baltimore, MD | 3.0 | 3.5 | 1600 | $2,790 | $1.74 | 25d | 1 | 0.47mi |
| 2534 McCulloh St Unit 1 Baltimore, MD | 4.0 | 2.0 | 2861 | $3,300 | $1.15 | 25d | 1 | 0.47mi |
| 2511 Madison Ave Unit 1 Baltimore, MD | 4.0 | 2.0 | 2700 | $2,700 | $1.00 | 45d | 1 | 0.49mi |
| 1616 N Fulton Ave Baltimore, MD | 3.0 | 2.0 | 1620 | $1,695 | $1.05 | 0d | 1 | 0.51mi |
| 736 Watts St Baltimore, MD | 3.0 | 3.5 | 2000 | $3,250 | $1.62 | 45d | 1 | 0.51mi |
| 734 Watts St Baltimore, MD | 3.0 | 3.5 | 1720 | $2,900 | $1.69 | 45d | 1 | 0.52mi |
| 1613 Riggs Ave Baltimore, MD | 3.0 | 2.5 | 1800 | $1,800 | $1.00 | 25d | 1 | 0.55mi |
| 914 Whitelock St Baltimore, MD | 4.0 | 3.5 | 2880 | $2,250 | $0.78 | 6d | 1 | 0.57mi |
| 1427 Bolton St Unit 2 Baltimore, MD | 2.0 | 2.0 | 1802 | $3,600 | $2.00 | 6d | 1 | 0.61mi |
| 1012 W Lanvale St Baltimore, MD | 2.0 | 2.0 | 2008 | $1,925 | $0.96 | 25d | 1 | 0.62mi |
| 805 Brooks Ln #2 Baltimore, MD | 2.0 | 1.0 | 2120 | $1,500 | $0.71 | 4d | 1 | 0.63mi |
| 2535 Brookfield Ave Baltimore, MD | 3.0 | 1.0 | 2736 | $1,500 | $0.55 | 45d | 1 | 0.67mi |
| 1501 N Payson St Baltimore, MD | 3.0 | 1.0 | 1400 | $1,550 | $1.11 | 45d | 1 | 0.68mi |
| 2302 Mount Royal Ter Baltimore, MD | 4.0 | 3.5 | 2351 | $3,000 | $1.28 | 25d | 1 | 0.72mi |
| 147 W Lafayette Ave Baltimore, MD | 4.0 | 2.5 | 2400 | $3,250 | $1.35 | 45d | 1 | 0.73mi |
| 1509 Edmondson Ave #1 Baltimore, MD | 3.0 | 2.0 | 1600 | $2,275 | $1.42 | 25d | 1 | 0.85mi |
| 2201 Whittier Ave Baltimore, MD | 4.0 | 2.0 | 1750 | $1,700 | $0.97 | 19d | 1 | 0.86mi |
| 2201 Whittier Ave Baltimore, MD | 4.0 | 2.0 | 1750 | $1,700 | $0.97 | 45d | 1 | 0.86mi |
| 1032 W Franklin St Baltimore, MD | 4.0 | 4.5 | 1913 | $2,650 | $1.39 | 25d | 1 | 0.87mi |
| 2128 N Pulaski St Baltimore, MD | 4.0 | 3.0 | 2166 | $2,200 | $1.02 | 45d | 1 | 0.88mi |
| 1625 Edmondson Ave Unit 2 Baltimore, MD | 4.0 | 3.0 | 1500 | $1,895 | $1.26 | 14d | 1 | 0.89mi |
| 1625 Edmondson Ave Unit 1 Baltimore, MD | 4.0 | 3.0 | 1500 | $2,175 | $1.45 | 6d | 1 | 0.89mi |
| 2204 Clifton Ave Baltimore, MD | 3.0 | 1.0 | 1400 | $1,450 | $1.04 | 6d | 1 | 0.95mi |
| 1020 Park Ave Baltimore, MD | 2.0 | 2.0–2.5 | 2004 | $3,712 | $1.85 | 4d | 11 | 0.99mi |
| 1617-A Moreland Ave Unit 2nd Flr Baltimore, MD | 2.0 | 1.0 | 1500 | $1,400 | $0.93 | 45d | 1 | 1.01mi |
| 2405 W North Ave Baltimore, MD | 4.0 | 3.0 | 1826 | $1,900 | $1.04 | 6d | 1 | 1.04mi |
| 918 N Bentalou St Baltimore, MD | 3.0 | 1.5 | 1485 | $1,750 | $1.18 | 45d | 1 | 1.05mi |
| 1214 N Charles St Baltimore, MD | 2.0 | 1.0–2.0 | 1103 | $2,333 | $2.11 | 3d | 14 | 1.13mi |
Listing history 33 events
-
2026-06-21days on market $235,000 Active 52 DOM
-
2026-06-18days on market $235,000 Active 49 DOM
-
2026-06-17days on market $235,000 Active 48 DOM
-
2026-06-16days on market $235,000 Active 47 DOM
-
2026-06-15days on market $235,000 Active 46 DOM
-
2026-06-13days on market $235,000 Active 44 DOM
-
2026-06-09days on market $235,000 Active 40 DOM
-
2026-06-08days on market $235,000 Active 39 DOM
-
2026-06-07days on market $235,000 Active 38 DOM
-
2026-06-04days on market $235,000 Active 35 DOM
-
2026-06-03days on market $235,000 Active 34 DOM
-
2026-06-02days on market $235,000 Active 33 DOM
-
2026-06-01days on market $235,000 Active 32 DOM
-
2026-05-31days on market $235,000 Active 31 DOM
-
2026-05-01$235,000 Active 1033-char remark
-
2026-04-28historical $235,000 1033-char remark
-
2016-06-08historical 388-char remark
Show marketing remark (388 chars)
This is it!! Totally renovated row home with all the upgrades you want! New wood floors, exposed brick walls. Fully remodeled kitchen in 2016 w/ SS appliances, granite countertops. Bathrooms are also renovated with granite vanity tops, glass shower doors. Energy efficient utilities, including tankless hot water tank, wireless alarm system! Too many upgrades to list! This is a must see!
-
2016-06-07soldstatus $149,000
-
2016-05-27soldstatus $149,000 Sold 388-char remark
Show marketing remark (388 chars)
This is it!! Totally renovated row home with all the upgrades you want! New wood floors, exposed brick walls. Fully remodeled kitchen in 2016 w/ SS appliances, granite countertops. Bathrooms are also renovated with granite vanity tops, glass shower doors. Energy efficient utilities, including tankless hot water tank, wireless alarm system! Too many upgrades to list! This is a must see!
-
2016-05-27soldstatus $149,000
Show marketing remark (388 chars)
This is it!! Totally renovated row home with all the upgrades you want! New wood floors, exposed brick walls. Fully remodeled kitchen in 2016 w/ SS appliances, granite countertops. Bathrooms are also renovated with granite vanity tops, glass shower doors. Energy efficient utilities, including tankless hot water tank, wireless alarm system! Too many upgrades to list! This is a must see!
-
2016-03-23status Contract 388-char remark
Show marketing remark (388 chars)
This is it!! Totally renovated row home with all the upgrades you want! New wood floors, exposed brick walls. Fully remodeled kitchen in 2016 w/ SS appliances, granite countertops. Bathrooms are also renovated with granite vanity tops, glass shower doors. Energy efficient utilities, including tankless hot water tank, wireless alarm system! Too many upgrades to list! This is a must see!
-
2016-02-27$149,999 Active 388-char remark
Show marketing remark (388 chars)
This is it!! Totally renovated row home with all the upgrades you want! New wood floors, exposed brick walls. Fully remodeled kitchen in 2016 w/ SS appliances, granite countertops. Bathrooms are also renovated with granite vanity tops, glass shower doors. Energy efficient utilities, including tankless hot water tank, wireless alarm system! Too many upgrades to list! This is a must see!
-
2015-12-20historical Temporarily Off-Market
-
2015-12-20historical
-
2015-08-19Active
-
2015-08-18$159,900
-
2015-01-24price $19,425
-
2015-01-22soldstatus $19,425 Sold
-
2015-01-22soldstatus $19,425
-
2014-10-22status Contract
-
2014-10-22historical
-
2014-10-06$5,000 Active
-
2014-10-06$19,425
ⓘ Source: listings_history table (triggers on properties + properties_extension) + one-shot
backfill from property_details.listing_events for pre-trigger history.
Tax reassessment forecast MD · Partial reset (capped growth)
- Current annual tax
- $1,695 · $141/mo
- Projected year-2 tax
- $2,128 · $177/mo
- Expected delta
- +$433/yr (+$36/mo · 25.6%)
ⓘ Screening estimate from a state-policy table — verify with the county assessor before closing.
Climate risk First Street
- Flood 3/10 Moderate FEMA zone X (unshaded) · 10% chance over 30 yrs
- Wildfire 1/10 Low
- Heat 7/10 Severe 7 d/yr ≥103°F today · 15 d/yr by 30 yrs out
- Wind 6/10 Major 27% chance of damaging wind over 30 yrs
- Air quality 4/10 Moderate 6 unhealthy d/yr today · 7 by 30 yrs out
Nearby sold comps map
Loading sold comps map…
Walkable amenities ~0.75 mi
Loading nearby amenities…
Taxation est. · year 1
- Rental income
- $24,598
- − Mortgage interest
- −$13,164
- − Property taxes
- −$1,695
- − Insurance
- −$1,175
- − Repairs & maintenance
- −$1,968
- − Management
- −$1,968
- − Depreciation
- −$6,836
- Taxable loss
- −$2,207
- Est. tax savings @ 24.0%
- +$530
- After-tax cash flow
- $2,304/yr
For passive investors: Depreciation is non-cash, so a rental often shows a tax loss while cash-flowing — sheltering income. Rental losses are passive: they offset passive income freely, and up to $25,000/yr can offset ordinary (W-2) income if you actively participate and your MAGI is under $100k (phasing out to $0 by $150k); unused losses carry forward. On sale, claimed depreciation is recaptured at up to 25%, and gains may owe capital-gains tax (a 1031 exchange can defer both). Figures are a year-1 estimate at your 24.0% rate — not tax advice; consult a CPA.
Schools (NCES district)
- District
- Baltimore City Public Schools
- NCES district ID
- 2400090
- Math proficiency
- 7% ▼ -9.00%
- Reading proficiency
- 16% ▼ -5.00%
- Median HH income
- $42,108
- Composite
- 10.08/100
- National rank
- #9805
- State rank
- #24 of 24 in MD
Livability — Baltimore
- Score
- 76/100
- State rank
- #90
- US rank
- #3396
Category grades
Schools grade is shown separately in the Schools card above.
Census & demographics
- Census place
- Baltimore, MD
- County
- Baltimore City · 558,601 people
- City population
- 588,727
- Metro
- Baltimore-Columbia-Towson, MD
- Population (ZIP)
- 30,792
- Household income
- $38,409
- Rent vs Own
- Severe rent burden
- 2921.0
Population outlook (Baltimore County) Hauer SSP2
- Today (2025)
- 624,249 people
- By 2030
- 621,541 · -0.4%
- By 2040
- 609,756 · -2.3%
- By 2050
- 597,249 · -4.3%
- By 2075
- 552,236 · -11.5%
- By 2100
- 513,934 · -17.7%
Race, ethnicity, and origin ACS 2023
- Neighborhood character
- Predominantly Black (81%)
- Race & ethnicity
- Black 81% White 12% Two or more races 4% Hispanic / Latino 2% Asian 2%
- Common ancestry
- Romanian 1% Hispanic 1% Italian 1%
- Foreign-born
- 5% · Canada, China, South Korea
- Languages at home
- 94% English-only · Spanish 2% French/Haitian/Cajun 1% Chinese 1%
Political lean MEDSL · Baltimore
- 2024 margin
- Solid D (+73.0) · D 85.2% · R 12.2% · Other 2.6%
- 2008→2024 swing
- -2.5pp toward R · 2008: 75.5pp · 2024: 73.0pp
- All cycles
- 2024: D+73.0 2020: D+76.6 2016: D+74.6 2012: D+76.4 2008: D+75.5
Not yet ingested
- Civics
- —
Market trends
- HPI YoY
- ▼ -187.20%
- Current HPI
- 104.2102
- Rent YoY
- ▲ 6.63%
- Metro
- Baltimore-Columbia-Towson, MD
- State GDP YoY
- ▲ 2.97%
- F500 in state
- 12
Industry mix (Fortune 500 HQ in MD)
| Industry | F500 HQs | Revenue |
|---|---|---|
| Aerospace / Defense | 1 | $71B |
|
||
| Utilities | 1 | $25B |
|
||
| Hotels | 1 | $24B |
|
||
| Consumer Goods | 1 | $7B |
|
||
| Real Estate | 1 | $6B |
|
||
| Chemicals | 1 | $2B |
|
||
Price history
+1109.8% since first listed19 events — show timeline
- 2026-05-01 Listed $235,000 BRIGHT MLS
- 2026-04-28 Coming Soon $235,000 BRIGHT MLS
- 2016-06-08 Delisted — MRIS
- 2016-06-07 Sold (Public Records) $149,000 Public Records
- 2016-05-27 Sold (MLS) $149,000 BRIGHT MLS
- 2016-05-27 Sold (MLS) $149,000 MRIS
- 2016-03-23 Pending — MRIS
- 2016-02-27 Listed $149,999 MRIS
- 2015-12-20 Listing Removed — BRIGHT MLS
- 2015-12-20 Delisted — MRIS
- 2015-08-19 Listed — MRIS
- 2015-08-18 Listed $159,900 BRIGHT MLS
- 2015-01-24 Price Changed $19,425 MRIS
- 2015-01-22 Sold (MLS) $19,425 BRIGHT MLS
- 2015-01-22 Sold (MLS) $19,425 MRIS
- 2014-10-22 Pending — MRIS
- 2014-10-22 Listing Removed — BRIGHT MLS
- 2014-10-06 Listed $5,000 MRIS
- 2014-10-06 Listed $19,425 BRIGHT MLS
Property tax history
+8.0%/yrLatest (2025): $1,695 · +5.0% YoY. Source: county tax records.
Cash-flow waterfall
monthlySold comps — $/sqft
last 12 mo · ≤1 miLoading sold comps…