7510 Hornwood Dr #201 · Houston, TX
Flood risk 6/10 · Moderate
- FEMA flood zone
- X (unshaded)
- Chance of flooding over 30 yrs
- 0.69%
- Est. flood insurance / yr
- $507 – $1,088
Fire risk 1/10 · Minimal
- Est. fire insurance / yr
- $1,222 – $2,270
Heat risk 9/10 · Severe
- Hot days now (above 109°F)
- 7 days/yr
- Hot days in 30 yrs
- 23 days/yr
Wind risk 9/10 · Severe
- Chance of severe wind over 30 yrs
- 99.0%
Air-quality risk 2/10 · Minimal
- Unhealthy air days now
- 2 days/yr
- Unhealthy air days in 30 yrs
- 2 days/yr
Risk factors via First Street. Map © Google.
Why this score? — see what drove the F grade
The composite is a weighted blend of 9 inputs, each scored 0–100. Each bar is that input's sub-score; the figure is the points it added to the 100-point composite (weight × sub-score).
- ARV discount +7.5/15.0
- 1% rule +6.4/10.0
- Appreciation +4.6/10.0
- Cash flow +4.2/30.0
- Livability +3.7/5.0
- Schools +2.7/10.0
- Condition / age +2.5/5.0
- Rent growth +0.8/5.0
- DSCR +0.0/10.0
$88,000
🖨 Deal sheet (PDF) 📄 Offer letter ✓ Due diligence
Listing remarks
This second-floor, 2-bedroom, 2-bathroom apartment features a rare split-unit layout that maximizes privacy for tenants, roommates, or . Located within a secure, gated community featuring a guarded vehicle entrance, residents gain access to premium shared amenities including a swimming pool and tennis court. The fully electric property features durable engineered wood flooring throughout the living spaces. Recent capital improvements include an upgraded kitchen with granite countertops, a stone-like backsplash, and partially new cabinets, alongside five-year-old bathroom tiles and vanities. While a newer water heater reduces immediate utility risks, the property is strictly sold "as-is
Key facts
- Gated community
- Tennis court
- Swimming pool
Tags
Property features AI
Finance
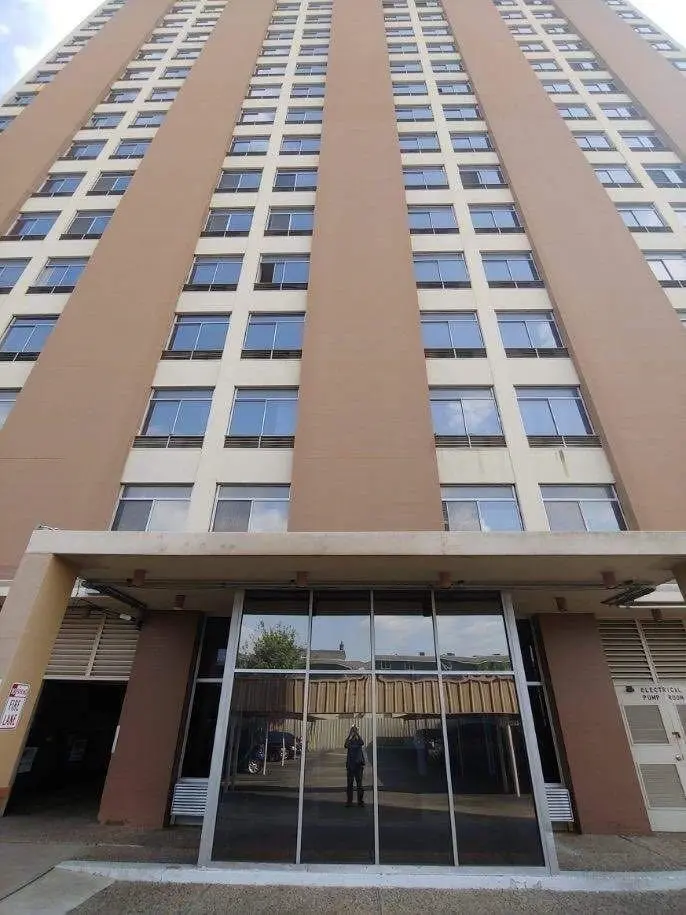
- Other: Building name: THE SUSSEX
- HOA & community: Sussex HOA; Community pool; Elevator
Exterior
- Parking: Assigned parking (1 space)
- Security: Doorman; Key card entry; Smoke detectors
- Utilities: Has heating; Has cooling
- Home design: Residential property; Entry on 2nd level
- Construction: Concrete construction; Built in 1966
- Exterior features: Play structure; Tennis courts; Asphalt road access
Interior
- Kitchen: Electric cooktop; Electric oven/range; Oven; Instant hot water; Refrigerator
- Bedrooms: 2nd floor entry level
- Flooring: Engineered hardwood
- Bathrooms: 2 full bathrooms
- Heating & cooling: Window heating unit; Window cooling unit
- Interior features: Entrance foyer; Granite counters; Separate shower; Tub with shower; Window treatments; Combined living and dining area
Neighborhood map
What this means for you Summary
Snapshot
- This is a 2-bed/2.0-bath condo listed at $88k.
Deal economics
- At list price, monthly cash flow is $-238 ($-3k/yr) — negative.
- The deal already cash-flows at list — no discount required.
- Meets the 1% rule at list price ($1k rent vs $88k).
- Recommended offer: $85k (3.0% below list) — sets the bar for market timing.
Location & tenants
- Location reads 74/100 on livability (#184 in TX, #4,771 nationally) — a middle-class / working-renter tenant base. Strengths: amenities A+, cost of living A+, housing A+; Watch: crime F.
- Houston ISD (urban): math 27% / reading 35% proficiency, ranked #593 of 826 in TX (top 72%) — families likely to look elsewhere, expect single-tenant / working-renter base with shorter leases; 71% free/reduced lunch — lower-income household profile, screen leases tightly.
- Zoned schools: Sharpstown H S (math 7% / reading 23%, grade F, #1,507 of 1,632 statewide, top 93%, 1,855 students, 89% FRL) — zoned schools average 89% FRL vs 71% district-wide (18 pts higher); higher-poverty schools than district average — tighter screening recommended.
- Zoned-school proficiency averages 15% at this address vs 31% district-wide (-16 pts) — the specific schools serving this property underperform the Houston ISD average; the district grade overstates school quality for this exact location.
- Market conditions: Rents falling (-6.6%/yr); 202 active listings in the ZIP; 40 comparable units currently listed for rent nearby; rentals at typical pace (median 19d on market — plan ~3-4 weeks tenant-placement turnaround); 29,883 units permitted in Harris County in 2024 (8,621 in 5+ unit buildings).
Forward outlook
- Local home prices are declining (-0.7%/yr); year-one equity from $608 of loan paydown is wiped out by about $643 of value loss. Plan a longer hold.
- Harris County population projected at +47% by 2050 — long-run rental-demand tailwind backs the buy-and-hold thesis.
Negotiation context
- It's been on market 33 days — a 3% lower offer ($85k) is reasonable based on typical stale-listing flexibility.
- 4 sale attempts since 7y ago with the ask held roughly flat each time — persistent listings suggest the price (not the market) is what's stuck; bring a comps-based counter.
Risks & watch-outs
- Watch-outs: HOA is 36% of rent.
- Climate carrying-cost: major flood risk; severe wind risk, 99% chance of damaging wind over 30y; extreme-heat days projected 7→23/yr by 2055 (HVAC capex compounding) — expect insurance premiums to compound above CPI over the hold.
Questions for the listing agent
- What do current leases actually rent for vs. the listed asking? Can we see a recent rent roll and the last 12 months of T-12 income?
- It's been on market 33 days. Have you received any prior offers? Is the seller open to a 3% concession, seller financing, or rate buy-down credit?
- Built in 1966 — when were the roof, HVAC, electrical panel, plumbing, and water heater last replaced?
- What does the HOA fee cover, when was the last increase, and are there any pending special assessments or reserve-fund shortfalls?
- Any open or pending special assessments — roof, HVAC, plumbing, elevator, façade? What's the per-unit balance and payoff schedule, and is the seller paying it off at close or rolling it to the buyer?
- Is there a deadline driving the sale (1031 exchange, divorce, estate, relocation)? That informs how much negotiation room exists.
- Schools are D-rated, which usually means shorter tenancies and higher turnover. Who's the typical renter profile here, and what's been the actual vacancy rate?
- Crime grade is F in this area — have there been break-ins, vandalism, or insurance claims at this property in the last 3 years? What carrier currently insures it and at what premium?
- The area grade is low — what's the realistic commute time and amenity access for the typical tenant pool here? Any planned neighborhood developments (good or bad) we should know about?
- What's the average days-on-market for RENTAL listings here right now (not sales)? A rising rental-DOM trend means longer vacancies and softer asking-rent achievability than the comps imply.
- What's the recent tenant-quality profile in this submarket — average credit score on applications, eviction rate, late-payment / NSF rate, and stable-employment percentage? A property-management company in the area should have these aggregated.
- How much new apartment / multifamily construction is in the pipeline within 1–3 miles? Heavy new supply (>2% of stock underway) typically softens rents 12–24 months out; light construction supports rent growth.
Investment metrics
- 1% rule
- 1.14% ✓
- Cap rate
- 3.05%
- Cash-on-cash
- -11.59%
- DSCR
- 0.48
- GRM
- 7.3
CMA / ARV
No comps found within radius.
Projected returns pro-forma
-0.73% appreciation · 0.0% rent growth · sell at horizon
- IRR
- -22.7%
- Equity multiple
- 0.05×
- Total profit
- $-23,382
- Equity at exit
- $22,383
- IRR
- -21.1%
- Equity multiple
- -0.70×
- Total profit
- $-41,859
- Equity at exit
- $24,491
Cash invested: $24,640 (down + closing). Projections, not guarantees.
Landlord ↔ Tenant lean methodology
- Overall (STATE)
- 87 Strongly Landlord-Friendly
- State Texas
- 87 Strongly Landlord-Friendly · R+5
- County
- — inherits STATE
- City
- — inherits STATE
ZIP-level market 77036
- Home prices YoY
- -0.3%
- Rents YoY
- -6.6%
- Active inventory
- 202
- Price-to-rent
- 7.3×
Monthly cashflow live
- Estimated rent
- $1,006 high interval (Pro) →
- Mortgage (P&I)
- −$461
- Tax from tax record
- −$169 /mo · $2,034/yr
- Insurance
- −$37
- HOA est. from 5 same-building comps
- −$365
- Vacancy / Maint / Mgmt
- −$211
- Net cashflow
- $-238
Break-even live
Sensitivity live
| Price | -10% $-188 | -5% $-213 | +0% $-238 | +5% $-263 | +10% $-288 |
|---|---|---|---|---|---|
| Rent | -10% $-317 | -5% $-278 | +0% $-238 | +5% $-198 | +10% $-159 |
| Rate | -1.0pp $-194 | -0.5pp $-216 | base $-238 | +0.5pp $-261 | +1.0pp $-284 |
UW: 25.0% down · 7.5% · 30yr · 1.5% tax · 5.0% vac · 8.0% maint · 8.0% mgmt
Financing live
Cash to close
- Down payment
- $22,000
- Closing costs
- $2,640
- Reserves months
- —
- Total cash needed
- —
Loan-product check · same deal, 3 products live
Conventional
25% down · 7.5% · 30yr
- Down + closing
- —
- Monthly P&I
- —
- Monthly cashflow
- —
- DSCR
- —
- Eligible?
- —
Personal DTI + credit; lowest rate.
DSCR
20% down · 8.5% · 30yr
- Down + closing
- —
- Monthly P&I
- —
- Monthly cashflow
- —
- DSCR
- —
- Eligible?
- —
No personal income docs; deal must DSCR.
Hard money
10% down · 12.0% · 12mo
- Down + closing
- —
- Monthly P&I
- —
- Monthly cashflow
- —
- DSCR
- —
- Eligible?
- —
Short-term bridge; refi at stabilization.
Rent comps 40 comps
| Address | Beds | Baths | Sqft | Rent | $/sqft | DOM | Units | Dist |
|---|---|---|---|---|---|---|---|---|
| 7500 Clarewood Dr Houston, TX | 2.0 | 2.0 | 1025 | $1,015 | $0.99 | 16d | 1 | 0.07mi |
| 6203 Marinette Dr Houston, TX | 1.0–2.0 | 1.0–2.0 | 935 | $1,144 | $1.22 | 0d | 9 | 0.10mi |
| 7506 Clarewood Dr Houston, TX | 1.0 | 1.0 | 715 | $830 | $1.16 | 45d | 1 | 0.11mi |
| 6106 Marinette Dr Houston, TX | 1.0 | 1.0 | 685 | $800 | $1.17 | 16d | 1 | 0.15mi |
| 6106 Marinette Dr Houston, TX | 1.0 | 1.0 | 685 | $800 | $1.17 | 45d | 1 | 0.15mi |
| 6106 Marinette Dr Houston, TX | 2.0 | 2.0 | 985 | $990 | $1.01 | 25d | 1 | 0.15mi |
| 6200 Marinette Dr Houston, TX | 1.0–3.0 | 1.0–2.5 | 912 | $1,002 | $1.10 | 0d | 21 | 0.19mi |
| 7506 Bellerive Dr Houston, TX | 2.0 | 2.0 | 970 | $1,100 | $1.13 | 45d | 1 | 0.24mi |
| 7500 Bellerive Dr Houston, TX | 2.0 | 1.0–2.0 | 692 | $1,055 | $1.52 | 14d | 1 | 0.25mi |
| 5959 Bonhomme Rd Houston, TX | 2.0 | 2.0 | 692 | $1,278 | $1.85 | 0d | 28 | 0.30mi |
| 5959 Bonhomme Rd Unit 6010 Houston, TX | 1.0 | 1.0 | 539 | $771 | $1.43 | 45d | 1 | 0.31mi |
| 5959 Bonhomme Rd Unit 423 Houston, TX | 2.0 | 2.0 | 853 | $986 | $1.16 | 45d | 1 | 0.31mi |
| 7211 Bellerive Dr Houston, TX | 1.0 | 1.0 | 807 | $1,153 | $1.43 | 45d | 1 | 0.33mi |
| 7391 Regency Square Ct Houston, TX | 1.0 | 1.0 | 661 | $849 | $1.28 | 45d | 1 | 0.39mi |
| 7581 Bellaire Blvd Houston, TX | 2.0 | 2.0 | 834 | $1,350 | $1.62 | 25d | 1 | 0.41mi |
| 7581 Bellaire Blvd Houston, TX | 1.0 | 1.0 | 691 | $1,010 | $1.46 | 21d | 1 | 0.41mi |
| 7581 Bellaire Blvd Houston, TX | 1.0 | 1.0 | 691 | $1,010 | $1.46 | 45d | 1 | 0.41mi |
| 5815 Gulfton St Houston, TX | 1.0 | 1.0 | 855 | $940 | $1.10 | 45d | 1 | 0.44mi |
| 7637 Harwin Dr Houston, TX | 1.0–2.0 | 1.0 | 908 | $1,119 | $1.23 | 3d | 12 | 0.46mi |
| 5810 Fondren Rd Houston, TX | 1.0–3.0 | 1.0–2.0 | 1000 | $1,158 | $1.16 | 16d | 1 | 0.51mi |
| 7900 Bellaire Blvd Houston, TX | 1.0–3.0 | 1.0–2.0 | 942 | $1,180 | $1.25 | 19d | 1 | 0.68mi |
| 6960 Bellaire Blvd Houston, TX | 1.0 | 1.0 | 713 | $945 | $1.33 | 22d | 1 | 0.70mi |
| 6960 Bellaire Blvd Houston, TX | 1.0 | 1.0 | 727 | $935 | $1.29 | 45d | 1 | 0.70mi |
| 6602 Harbor Town Dr Houston, TX | 1.0–2.0 | 1.0–2.0 | 770 | $1,200 | $1.56 | 0d | 2 | 0.72mi |
| 8100 Bellaire Blvd Houston, TX | 1.0–3.0 | 1.0–2.0 | 881 | $1,115 | $1.26 | 0d | 26 | 0.79mi |
| 22 Sands Point Dr Houston, TX | 1.0 | 1.0 | 610 | $955 | $1.57 | 45d | 1 | 0.81mi |
| 6718 De Moss Dr Houston, TX | 1.0–3.0 | 1.0–2.5 | 978 | $1,054 | $1.08 | 3d | 34 | 0.86mi |
| 8100 Sands Point Dr Houston, TX | 1.0–3.0 | 1.0–2.0 | 953 | $1,256 | $1.32 | 0d | 28 | 0.88mi |
| 8155 Richmond Ave Houston, TX | 1.0–2.0 | 1.0–2.0 | 746 | $1,024 | $1.37 | 0d | 15 | 1.17mi |
| 9221 Pagewood Ln Unit 2047 Houston, TX | 2.0 | 2.0 | 804 | $1,050 | $1.31 | 12d | 1 | 1.20mi |
| 9221 Pagewood Ln Unit 1047 Houston, TX | 1.0 | 1.0 | 668 | $790 | $1.18 | 0d | 1 | 1.20mi |
| 9221 Pagewood Ln Unit 2047 Houston, TX | 2.0 | 2.0 | 804 | $1,040 | $1.29 | 0d | 1 | 1.20mi |
| 9221 Pagewood Ln Unit 9272 Houston, TX | 1.0 | 1.0 | 668 | $749 | $1.12 | 14d | 1 | 1.22mi |
| 9221 Pagewood Ln Unit 9295 Houston, TX | 1.0 | 1.0 | 668 | $749 | $1.12 | 0d | 1 | 1.22mi |
| 9221 Pagewood Ln Unit 2162 Houston, TX | 2.0 | 2.0 | 804 | $1,015 | $1.26 | 9d | 1 | 1.22mi |
| 9221 Pagewood Ln Unit 1162 Houston, TX | 1.0 | 1.0 | 668 | $760 | $1.14 | 9d | 1 | 1.22mi |
| 8168 Richmond Ave Houston, TX | 2.0 | 2.0 | 917 | $1,165 | $1.27 | 25d | 1 | 1.28mi |
| 8168 Richmond Ave Houston, TX | 1.0 | 1.0 | 676 | $920 | $1.36 | 23d | 1 | 1.28mi |
| 8168 Richmond Ave Houston, TX | 1.0 | 1.0 | 676 | $920 | $1.36 | 45d | 1 | 1.28mi |
| 3401 Ocee St Houston, TX | 2.0 | 1.0 | 825 | $940 | $1.14 | 45d | 1 | 1.31mi |
HOA detail condo
- Monthly dues
- $0 · $0/yr
- Likely covers
- waterelectricpoolsecurity
- Assessments
- None detected in remarks — confirm with the listing agent.
Listing history 29 events
-
2026-06-21days on market $88,000 Active 33 DOM
-
2026-06-18days on market $88,000 Active 30 DOM
-
2026-06-17days on market $88,000 Active 29 DOM
-
2026-06-16days on market $88,000 Active 28 DOM
-
2026-06-15days on market $88,000 Active 27 DOM
-
2026-06-13days on market $88,000 Active 25 DOM
-
2026-06-10days on market $88,000 Active 21 DOM
-
2026-06-08days on market $88,000 Active 20 DOM
-
2026-06-07days on market $88,000 Active 19 DOM
-
2026-06-04days on market $88,000 Active 16 DOM
-
2026-06-01days on market $88,000 Active 13 DOM
-
2026-05-31days on market $88,000 Active 12 DOM
-
2026-05-19$88,000 Active
-
2026-01-29historical
-
2026-01-20price $90,800
-
2024-07-25$108,000 Active
-
2020-12-10historical
-
2020-12-04price $99,900
-
2020-09-14price $79,900
-
2020-08-31price $85,900
-
2020-08-15price $89,900
-
2020-08-15$89,000 Active
-
2019-12-26historical
-
2019-11-15price $69,900
-
2019-11-14$69,000 Active
-
2016-09-27soldstatus
-
2014-07-18soldstatus
-
2007-08-09soldstatus
-
2000-12-15soldstatus
ⓘ Source: listings_history table (triggers on properties + properties_extension) + one-shot
backfill from property_details.listing_events for pre-trigger history.
Tax reassessment forecast TX · Resets to sale price
- Current annual tax
- $2,034 · $169/mo
- Projected year-2 tax
- $2,034 · $169/mo
- Expected delta
- $0/yr ($0/mo · 0.0%)
ⓘ Screening estimate from a state-policy table — verify with the county assessor before closing.
Climate risk First Street
- Flood 6/10 Major FEMA zone X (unshaded) · 69% chance over 30 yrs
- Wildfire 1/10 Low
- Heat 9/10 Extreme 7 d/yr ≥109°F today · 23 d/yr by 30 yrs out
- Wind 9/10 Extreme 99% chance of damaging wind over 30 yrs
- Air quality 2/10 Low 2 unhealthy d/yr today · 2 by 30 yrs out
Nearby sold comps map
Loading sold comps map…
Walkable amenities ~0.75 mi
Loading nearby amenities…
Taxation est. · year 1
- Rental income
- $12,070
- − Mortgage interest
- −$4,929
- − Property taxes
- −$2,034
- − Insurance
- −$440
- − Repairs & maintenance
- −$966
- − Management
- −$966
- − HOA
- −$4,380
- − Depreciation
- −$2,560
- Taxable loss
- −$4,204
- Est. tax savings @ 24.0%
- +$1,009
- After-tax cash flow
- $-1,847/yr
For passive investors: Depreciation is non-cash, so a rental often shows a tax loss while cash-flowing — sheltering income. Rental losses are passive: they offset passive income freely, and up to $25,000/yr can offset ordinary (W-2) income if you actively participate and your MAGI is under $100k (phasing out to $0 by $150k); unused losses carry forward. On sale, claimed depreciation is recaptured at up to 25%, and gains may owe capital-gains tax (a 1031 exchange can defer both). Figures are a year-1 estimate at your 24.0% rate — not tax advice; consult a CPA.
Schools (NCES district)
- District
- Houston ISD
- NCES district ID
- 4823640
- Math proficiency
- 27% ▼ -18.00%
- Reading proficiency
- 35% ▼ -6.00%
- Median HH income
- $46,054
- Composite
- 26.63/100
- National rank
- #7173
- State rank
- #593 of 826 in TX
Livability — Houston
- Score
- 74/100
- State rank
- #184
- US rank
- #4771
Category grades
Schools grade is shown separately in the Schools card above.
Census & demographics
- Census place
- Houston, TX
- County
- Harris County · 4,702,590 people
- City population
- 3,226,434
- Metro
- Houston-The Woodlands-Sugar Land, TX
- Population (ZIP)
- 71,770
- Household income
- $45,716
- Rent vs Own
- Severe rent burden
- 4374.0
Population outlook (Harris County) Hauer SSP2
- Today (2025)
- 5,571,493 people
- By 2030
- 6,089,821 · +9.3%
- By 2040
- 7,142,806 · +28.2%
- By 2050
- 8,185,864 · +46.9%
- By 2075
- 10,574,329 · +89.8%
- By 2100
- 12,109,958 · +117.4%
Race, ethnicity, and origin ACS 2023
- Neighborhood character
- Predominantly Hispanic (71%)
- Race & ethnicity
- Hispanic / Latino 71% Two or more races 28% Black 11% Asian 9% White 7%
- Hispanic origin (detail)
- Mexican 33% Cuban 3%
- Foreign-born
- 55% · Canada, China, Vietnam
- Languages at home
- 20% English-only · Spanish 66% Chinese 5% Vietnamese 2%
Political lean MEDSL · Harris
- 2024 margin
- Lean D (+5.5) · D 52.0% · R 46.4% · Other 1.6%
- 2008→2024 swing
- +3.9pp toward D · 2008: 1.6pp · 2024: 5.5pp
- All cycles
- 2024: D+5.5 2020: D+13.3 2016: D+12.4 2012: D+0.1 2008: D+1.6
Not yet ingested
- Civics
- —
Market trends
- HPI YoY
- ▼ -0.73%
- Current HPI
- 221.1045
- Rent YoY
- ▼ -6.62%
- Metro
- Houston-The Woodlands-Sugar Land, TX
- State GDP YoY
- ▲ 3.95%
- F500 in state
- 110
Industry mix (Fortune 500 HQ in TX)
| Industry | F500 HQs | Revenue |
|---|---|---|
| Energy | 16 | $1,198B |
|
||
| Technology | 5 | $198B |
|
||
| Engineering / Construction | 4 | $72B |
|
||
| Energy Services | 3 | $60B |
|
||
| Utilities | 3 | $41B |
|
||
| Healthcare | 2 | $330B |
|
||
Price history
+27.5% since first listed17 events — show timeline
- 2026-05-19 Listed $88,000 HARMLS
- 2026-01-29 Listing Removed — HARMLS
- 2026-01-20 Price Changed $90,800 HARMLS
- 2024-07-25 Listed $108,000 HARMLS
- 2020-12-10 Listing Removed — HARMLS
- 2020-12-04 Price Changed $99,900 HARMLS
- 2020-09-14 Price Changed $79,900 HARMLS
- 2020-08-31 Price Changed $85,900 HARMLS
- 2020-08-15 Price Changed $89,900 HARMLS
- 2020-08-15 Listed $89,000 HARMLS
- 2019-12-26 Listing Removed — HARMLS
- 2019-11-15 Price Changed $69,900 HARMLS
- 2019-11-14 Listed $69,000 HARMLS
- 2016-09-27 Sold (Public Records) — Public Records
- 2014-07-18 Sold (Public Records) — Public Records
- 2007-08-09 Sold (Public Records) — Public Records
- 2000-12-15 Sold (Public Records) — Public Records
Property tax history
+3.9%/yrLatest (2025): $2,034 · +11.7% YoY. Source: county tax records.
Cash-flow waterfall
monthlySold comps — $/sqft
last 12 mo · ≤1 miLoading sold comps…