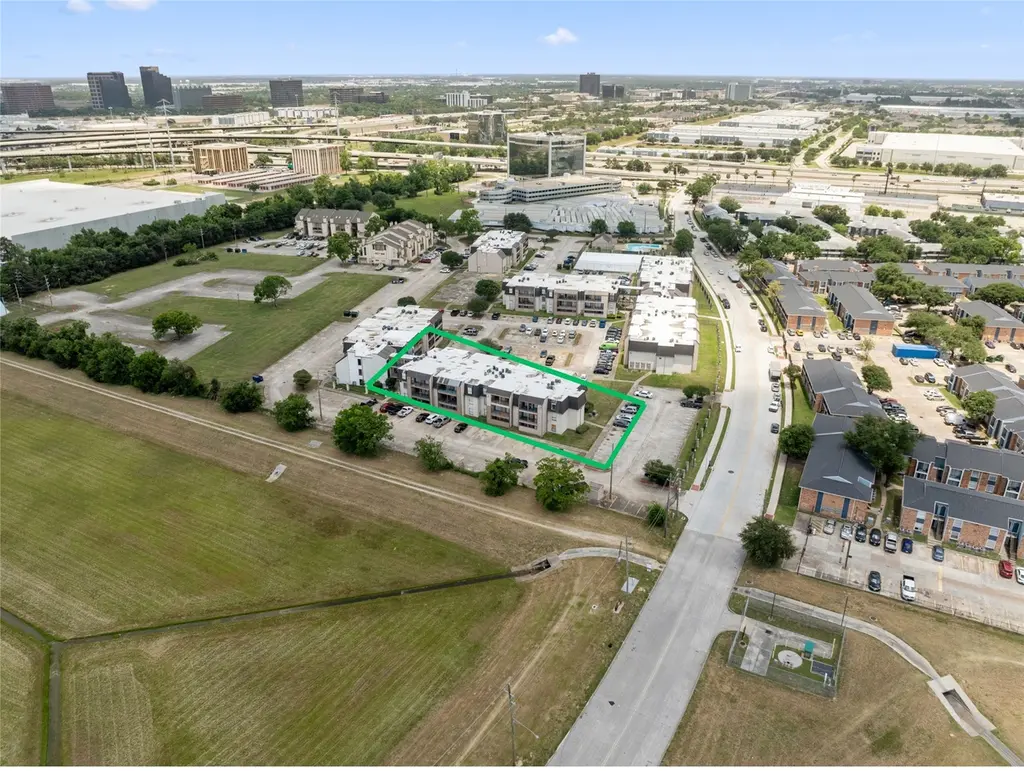
212 Plaza Verde Dr Unit F-22 · Houston, TX
Flood risk 7/10 · Major
- FEMA flood zone
- X (unshaded)
- Chance of flooding over 30 yrs
- 0.99%
- Est. flood insurance / yr
- $507 – $1,088
Fire risk 3/10 · Minor
- Est. fire insurance / yr
- $1,222 – $2,270
Heat risk 9/10 · Severe
- Hot days now (above 110°F)
- 7 days/yr
- Hot days in 30 yrs
- 25 days/yr
Wind risk 9/10 · Severe
- Chance of severe wind over 30 yrs
- 99.0%
Air-quality risk 3/10 · Minor
- Unhealthy air days now
- 3 days/yr
- Unhealthy air days in 30 yrs
- 4 days/yr
Risk factors via First Street. Map © Google.
Why this score? — see what drove the D+ grade
The composite is a weighted blend of 9 inputs, each scored 0–100. Each bar is that input's sub-score; the figure is the points it added to the 100-point composite (weight × sub-score).
- Cash flow +17.4/30.0
- 1% rule +10.0/10.0
- DSCR +5.4/10.0
- Livability +3.7/5.0
- ARV discount +3.5/15.0
- Rent growth +2.5/5.0
- Condition / age +2.5/5.0
- Schools +1.5/10.0
- Appreciation +0.0/10.0
$79,000
🖨 Deal sheet 📄 Offer letter ✓ Due diligence
Listing remarks MLS
Renovated and move-in ready, this 2-bed, 1 full + 2 half bath condo is ideal for first-time buyers, downsizers, or investors. Enjoy an open layout with luxury vinyl flooring, a stylish kitchen featuring butcher block counters, updated cabinets, ceramic cooktop, and refrigerator. Both bedrooms are well-sized, and the primary suite offers direct access to a spacious balcony. The like-new washer and dryer stay, along with interior and exterior storage. With spacious living spaces , controlled access, a community pool, and a great location near shopping, dining, and major roads—this condo is low-maintenance and high on value. A smart choice for living or leasing!
Key facts
- Ceramic cooktop
- Controlled access
- Community pool
Tags
Neighborhood map
What this means for you Summary
Snapshot
- This is a 2-bed/1.5-bath condo listed at $79k.
Deal economics
- At list price, monthly cash flow is $-8 ($-94/yr) — negative.
- To cash-flow at today's rent, offer at most $78k (1.7% below list).
- Meets the 1% rule at list price ($1k rent vs $79k).
- Recommended offer: $70k (12.0% below list) — sets the bar for market timing.
- Cap rate 7.2% vs local median 3.2% in Houston — top-decile yield for the area; either an underpriced asset or a hidden risk that comps aren't pricing in. Stress-test before assuming the spread holds.
Location & tenants
- Location reads 74/100 on livability (#184 in TX, #4,771 nationally) — a middle-class / working-renter tenant base. Strengths: amenities A+, cost of living A+, housing A+; Watch: schools D, crime F.
- Aldine ISD (suburban): math 16% / reading 21% proficiency, ranked #790 of 826 in TX (top 96%) — low school quality limits family demand, transient renter base, plan for 1-2y turnover; 79% free/reduced lunch — lower-income household profile, screen leases tightly.
- Market conditions: 52 active listings in the ZIP; 40 comparable units currently listed for rent nearby; rentals at typical pace (median 24d on market — plan ~3-4 weeks tenant-placement turnaround); 48% of comp listings sitting > 30 days — soft ceiling on asking rent; 29,883 units permitted in Harris County in 2024 (8,621 in 5+ unit buildings).
Forward outlook
- Local home prices are declining (-3.0%/yr); year-one equity from $546 of loan paydown is wiped out by about $2k of value loss. Plan a longer hold.
- Harris County population projected at +47% by 2050 — long-run rental-demand tailwind backs the buy-and-hold thesis.
Negotiation context
- It's been on market 381 days — a 12% lower offer ($70k) is reasonable based on typical stale-listing flexibility.
- 4 sale attempts since 6y ago; this cycle's ask has dropped $14k (15%) from the opening price — seller is motivated, your offer sets the floor, not the list.
Risks & watch-outs
- Watch-outs: flood insurance adds $66/mo; HOA is 24% of rent.
- Climate carrying-cost: major flood risk; severe wind risk, 99% chance of damaging wind over 30y; extreme-heat days projected 7→25/yr by 2055 (HVAC capex compounding) — expect insurance premiums to compound above CPI over the hold.
Questions for the listing agent
- What do current leases actually rent for vs. the listed asking? Can we see a recent rent roll and the last 12 months of T-12 income?
- It's been on market 381 days. Have you received any prior offers? Is the seller open to a 12% concession, seller financing, or rate buy-down credit?
- What's the actual annual flood-insurance premium (NFIP or private), and is the property in a SFHA with mandatory coverage?
- What does the HOA fee cover, when was the last increase, and are there any pending special assessments or reserve-fund shortfalls?
- Any open or pending special assessments — roof, HVAC, plumbing, elevator, façade? What's the per-unit balance and payoff schedule, and is the seller paying it off at close or rolling it to the buyer?
- Why hasn't it sold? Are there any deal-killer items the seller is aware of (foundation, flood, title, zoning, code violations)?
- Is there a deadline driving the sale (1031 exchange, divorce, estate, relocation)? That informs how much negotiation room exists.
- Schools are D-rated, which usually means shorter tenancies and higher turnover. Who's the typical renter profile here, and what's been the actual vacancy rate?
- Crime grade is F in this area — have there been break-ins, vandalism, or insurance claims at this property in the last 3 years? What carrier currently insures it and at what premium?
- The area grade is low — what's the realistic commute time and amenity access for the typical tenant pool here? Any planned neighborhood developments (good or bad) we should know about?
- What's the average days-on-market for RENTAL listings here right now (not sales)? A rising rental-DOM trend means longer vacancies and softer asking-rent achievability than the comps imply.
- What's the recent tenant-quality profile in this submarket — average credit score on applications, eviction rate, late-payment / NSF rate, and stable-employment percentage? A property-management company in the area should have these aggregated.
- How much new apartment / multifamily construction is in the pipeline within 1–3 miles? Heavy new supply (>2% of stock underway) typically softens rents 12–24 months out; light construction supports rent growth.
Investment metrics
- 1% rule
- 1.50% ✓
- Cap rate
- 7.18%
- Cash-on-cash
- 3.18%
- DSCR
- 1.14
- GRM
- 5.5
CMA / ARV
- ARV (median comp)
- $72,541
- List price
- $79,000
- Delta
- 8.90%
- Verdict
- FAIR
- Comps
- 10 within 1.0 mi
Projected returns pro-forma
-3.0% appreciation · 3.0% rent growth · sell at horizon
- IRR
- -16.6%
- Equity multiple
- 0.41×
- Total profit
- $-13,035
- Equity at exit
- $11,779
- IRR
- -7.7%
- Equity multiple
- 0.51×
- Total profit
- $-10,919
- Equity at exit
- $6,830
Cash invested: $22,120 (down + closing). Projections, not guarantees.
Landlord ↔ Tenant lean methodology
- Overall (STATE)
- 87 Strongly Landlord-Friendly
- State Texas
- 87 Strongly Landlord-Friendly · R+5
- County
- — inherits STATE
- City
- — inherits STATE
ZIP-level market 77038
- Home prices YoY
- -20.0%
- Active inventory
- 52
- Price-to-rent
- 5.5×
Monthly cashflow live
- Estimated rent
- $1,188 high interval (Pro) →
- Mortgage (P&I)
- −$414
- Tax from tax record
- −$153 /mo · $1,832/yr
- Insurance
- −$33
- Flood insurance flood zone
- −$66 /mo · $798/yr
- HOA
- −$280
- Vacancy / Maint / Mgmt
- −$249
- Net cashflow
- $-8
Break-even live
UW: 25.0% down · 7.5% · 30yr · 1.5% tax · 5.0% vac · 8.0% maint · 8.0% mgmt
Financing live
Cash to close
- Down payment
- $19,750
- Closing costs
- $2,370
- Reserves months
- —
- Total cash needed
- —
Loan-product check · same deal, 3 products live
Conventional
25% down · 7.5% · 30yr
- Down + closing
- —
- Monthly P&I
- —
- Monthly cashflow
- —
- DSCR
- —
- Eligible?
- —
Personal DTI + credit; lowest rate.
DSCR
20% down · 8.5% · 30yr
- Down + closing
- —
- Monthly P&I
- —
- Monthly cashflow
- —
- DSCR
- —
- Eligible?
- —
No personal income docs; deal must DSCR.
Hard money
10% down · 12.0% · 12mo
- Down + closing
- —
- Monthly P&I
- —
- Monthly cashflow
- —
- DSCR
- —
- Eligible?
- —
Short-term bridge; refi at stabilization.
Rent comps 40 comps
| Address | Beds | Baths | Sqft | Rent | $/sqft | DOM | Units | Dist |
|---|---|---|---|---|---|---|---|---|
| 202 Plaza Verde Dr Unit A23 Houston, TX | 1.0 | 1.0 | 728 | $900 | $1.24 | 43d | 1 | 0.03mi |
| 202 Plaza Verde Dr Unit A26 Houston, TX | 3.0 | 2.0 | 1050 | $1,375 | $1.31 | 43d | 1 | 0.03mi |
| 206 Plaza Verde Dr Houston, TX | 3.0 | 1.0–2.0 | 907 | $1,175 | $1.30 | 43d | 7 | 0.05mi |
| 218 Plaza Verde Dr Unit M2202 Houston, TX | 2.0 | 2.0 | 1000 | $1,125 | $1.12 | 43d | 1 | 0.06mi |
| 218 Plaza Verde Dr Unit N108 Houston, TX | 1.0 | 1.0 | 660 | $825 | $1.25 | 43d | 1 | 0.06mi |
| 218 Plaza Verde Dr Unit N103 Houston, TX | 1.0 | 1.0 | 728 | $900 | $1.24 | 43d | 1 | 0.06mi |
| 11500 Green Plaza Dr Houston, TX | 1.0–2.0 | 1.0–2.0 | 699 | $1,174 | $1.68 | 21d | 6 | 0.07mi |
| 207 Plaza Verde Dr Houston, TX | 2.0 | 1.0 | 784 | $975 | $1.24 | 43d | 1 | 0.13mi |
| 11411 Green Plaza Dr Houston, TX | 1.0–2.0 | 1.0–2.0 | 699 | $1,250 | $1.79 | 3d | 45 | 0.18mi |
| 11411 Green Plaza Dr Houston, TX | 1.0 | 1.0 | 644 | $1,014 | $1.57 | 43d | 1 | 0.18mi |
| 70 Northpoint Dr Houston, TX | 1.0 | 1.0 | 644 | $800 | $1.24 | 24d | 1 | 0.44mi |
| 70 Northpoint Dr Houston, TX | 2.0 | 2.0 | 880 | $1,105 | $1.26 | 16d | 1 | 0.44mi |
| 70 Northpoint Dr Houston, TX | 2.0 | 2.0 | 880 | $1,105 | $1.26 | 43d | 1 | 0.44mi |
| 131 Aldine Bender Rd Houston, TX | 1.0–2.0 | 1.0–2.0 | 868 | $1,095 | $1.26 | 10d | 9 | 0.66mi |
| 137 Aldine Bender Rd Houston, TX | 2.0 | 1.0 | 950 | $1,146 | $1.21 | 43d | 1 | 0.67mi |
| 12121 Greenspoint Dr Houston, TX | 1.0–4.0 | 1.0–2.0 | 932 | $1,151 | $1.23 | 1d | 13 | 0.78mi |
| 424 Northpoint Dr Houston, TX | 2.0 | 2.0 | 880 | $1,230 | $1.40 | 43d | 1 | 0.81mi |
| 16107 Imperial Valley Dr Houston, TX | 2.0 | 2.0 | 910 | $1,088 | $1.20 | 43d | 1 | 0.87mi |
| 8 Goodson Dr Houston, TX | 1.0 | 1.0 | 660 | $1,020 | $1.55 | 24d | 1 | 0.91mi |
| 2 Goodson Dr Unit 1162 Houston, TX | 1.0 | 1.0 | 620 | $784 | $1.26 | 7d | 1 | 0.94mi |
| 2 Goodson Dr Unit 3047 Houston, TX | 3.0 | 2.0 | 885 | $1,056 | $1.19 | 16d | 1 | 0.94mi |
| 2 Goodson Dr Unit 2047 Houston, TX | 2.0 | 2.0 | 782 | $957 | $1.22 | 1d | 1 | 0.94mi |
| 2 Goodson Dr Houston, TX | 1.0 | 1.0 | 620 | $773 | $1.25 | 5d | 1 | 0.94mi |
| 220 Northpoint Dr Houston, TX | 1.0–2.0 | 1.0–2.0 | 698 | $1,185 | $1.70 | 7d | 29 | 0.95mi |
| 125 W Dyna Dr Houston, TX | 1.0–2.0 | 1.0–2.0 | 843 | $1,290 | $1.53 | 1d | 16 | 0.99mi |
| 2 Goodson Dr Unit 2162 Houston, TX | 2.0 | 2.0 | 782 | $965 | $1.23 | 7d | 1 | 1.01mi |
| 131 W Dyna Dr Houston, TX | 2.0 | 2.0 | 1054 | $1,275 | $1.21 | 12d | 1 | 1.03mi |
| 131 W Dyna Dr Houston, TX | 1.0 | 1.0 | 632 | $940 | $1.49 | 4d | 1 | 1.03mi |
| 131 W Dyna Dr Houston, TX | 1.0 | 1.0 | 632 | $940 | $1.49 | 21d | 1 | 1.03mi |
| 131 W Dyna Dr Houston, TX | 2.0 | 2.0 | 1054 | $1,275 | $1.21 | 43d | 1 | 1.03mi |
| 16309 Imperial Valley Dr Houston, TX | 2.0 | 2.0 | 852 | $1,039 | $1.22 | 18d | 1 | 1.06mi |
| 16309 Imperial Valley Dr Houston, TX | 2.0 | 2.0 | 852 | $1,039 | $1.22 | 43d | 1 | 1.06mi |
| 16972 Northchase Dr Houston, TX | 1.0 | 1.0 | 668 | $794 | $1.19 | 43d | 1 | 1.06mi |
| 1309 Grand Plaza Dr Houston, TX | 2.0 | 2.0 | 988 | $964 | $0.98 | 43d | 1 | 1.13mi |
| 400 Greens Rd Houston, TX | 1.0–3.0 | 1.0–2.5 | 950 | $1,075 | $1.13 | 1d | 1 | 1.17mi |
| 12603 Northborough Dr Houston, TX | 1.0–2.0 | 1.0–2.0 | 828 | $1,014 | $1.22 | 1d | 8 | 1.19mi |
| 12603 Northborough Dr Houston, TX | 1.0–2.0 | 1.0–2.0 | 747 | $949 | $1.27 | 43d | 14 | 1.19mi |
| 16001 Cotillion Dr Houston, TX | 1.0–2.0 | 1.0–2.0 | 737 | $999 | $1.35 | 43d | 52 | 1.22mi |
| 407 Greens Rd Houston, TX | 1.0–2.0 | 1.0–2.0 | 756 | $1,042 | $1.38 | 1d | 7 | 1.26mi |
| 407 Greens Rd Houston, TX | 1.0–2.0 | 1.0–2.0 | 781 | $1,099 | $1.41 | 43d | 6 | 1.26mi |
HOA detail condo
- Monthly dues
- $280 · $3,360/yr
- Likely covers
- pool
- Assessments
- None detected in remarks — confirm with the listing agent.
Listing history 36 events
-
2026-06-18days on market $79,000 Active 381 DOM
-
2026-06-17days on market $79,000 Active 380 DOM
-
2026-06-16days on market $79,000 Active 379 DOM
-
2026-06-15days on market $79,000 Active 378 DOM
-
2026-06-13days on market $79,000 Active 376 DOM
-
2026-06-13days on market $79,000 Active 375 DOM
-
2026-06-09days on market $79,000 Active 372 DOM
-
2026-06-08days on market $79,000 Active 371 DOM
-
2026-06-07days on market $79,000 Active 370 DOM
-
2026-06-04days on market $79,000 Active 367 DOM
-
2026-06-03days on market $79,000 Active 366 DOM
-
2026-06-02days on market $79,000 Active 365 DOM
-
2026-06-01days on market $79,000 Active 364 DOM
-
2026-05-31days on market $79,000 Active 363 DOM
-
2026-05-18price $79,000 673-char remark
Show marketing remark (673 chars)
Renovated and move-in ready, this 2-bed, 1 full + 2 half bath condo is ideal for first-time buyers, downsizers, or investors. Enjoy an open layout with luxury vinyl flooring, a stylish kitchen featuring butcher block counters, updated cabinets, ceramic cooktop, and refrigerator. Both bedrooms are well-sized, and the primary suite offers direct access to a spacious balcony. The like-new washer and dryer stay, along with interior and exterior storage. With spacious living spaces , controlled access, a community pool, and a great location near shopping, dining, and major roads—this condo is low-maintenance and high on value. A smart choice for living or leasing!
-
2025-07-21price $87,000 673-char remark
Show marketing remark (673 chars)
Renovated and move-in ready, this 2-bed, 1 full + 2 half bath condo is ideal for first-time buyers, downsizers, or investors. Enjoy an open layout with luxury vinyl flooring, a stylish kitchen featuring butcher block counters, updated cabinets, ceramic cooktop, and refrigerator. Both bedrooms are well-sized, and the primary suite offers direct access to a spacious balcony. The like-new washer and dryer stay, along with interior and exterior storage. With spacious living spaces , controlled access, a community pool, and a great location near shopping, dining, and major roads—this condo is low-maintenance and high on value. A smart choice for living or leasing!
-
2025-06-02$93,000 Active 673-char remark
Show marketing remark (673 chars)
Renovated and move-in ready, this 2-bed, 1 full + 2 half bath condo is ideal for first-time buyers, downsizers, or investors. Enjoy an open layout with luxury vinyl flooring, a stylish kitchen featuring butcher block counters, updated cabinets, ceramic cooktop, and refrigerator. Both bedrooms are well-sized, and the primary suite offers direct access to a spacious balcony. The like-new washer and dryer stay, along with interior and exterior storage. With spacious living spaces , controlled access, a community pool, and a great location near shopping, dining, and major roads—this condo is low-maintenance and high on value. A smart choice for living or leasing!
-
2025-01-22historical
-
2025-01-08price $95,000
-
2024-10-11price $99,500
-
2024-09-23$110,000 Active
-
2024-06-03soldstatus
-
2024-05-31soldstatus Sold
-
2024-05-22status Pending
-
2024-04-26$95,000 Active
-
2022-12-21soldstatus
-
2021-02-05soldstatus
-
2021-02-03soldstatus Sold
-
2021-01-09status Pending
-
2021-01-06status Option Pending
-
2020-12-10price $55,000
-
2020-09-04$65,000 Active
-
2013-08-20soldstatus
-
2008-11-12soldstatus
-
2008-05-01soldstatus
-
2000-11-21soldstatus
ⓘ Source: listings_history table (triggers on properties + properties_extension) + one-shot
backfill from property_details.listing_events for pre-trigger history.
Tax reassessment forecast TX · Resets to sale price
- Current annual tax
- $1,832 · $153/mo
- Projected year-2 tax
- $1,832 · $153/mo
- Expected delta
- $0/yr ($0/mo · 0.0%)
ⓘ Screening estimate from a state-policy table — verify with the county assessor before closing.
Climate risk First Street
- Flood 7/10 Severe FEMA zone X (unshaded) · 99% chance over 30 yrs
- Wildfire 3/10 Moderate
- Heat 9/10 Extreme 7 d/yr ≥110°F today · 25 d/yr by 30 yrs out
- Wind 9/10 Extreme 99% chance of damaging wind over 30 yrs
- Air quality 3/10 Moderate 3 unhealthy d/yr today · 4 by 30 yrs out
Nearby sold comps map
Loading sold comps map…
Walkable amenities ~0.75 mi
Loading nearby amenities…
Taxation est. · year 1
- Rental income
- $14,256
- − Mortgage interest
- −$4,425
- − Property taxes
- −$1,832
- − Insurance
- −$1,192
- − Repairs & maintenance
- −$1,140
- − Management
- −$1,140
- − HOA
- −$3,360
- − Depreciation
- −$2,298
- Taxable loss
- −$1,133
- Est. tax savings @ 24.0%
- +$272
- After-tax cash flow
- $178/yr
For passive investors: Depreciation is non-cash, so a rental often shows a tax loss while cash-flowing — sheltering income. Rental losses are passive: they offset passive income freely, and up to $25,000/yr can offset ordinary (W-2) income if you actively participate and your MAGI is under $100k (phasing out to $0 by $150k); unused losses carry forward. On sale, claimed depreciation is recaptured at up to 25%, and gains may owe capital-gains tax (a 1031 exchange can defer both). Figures are a year-1 estimate at your 24.0% rate — not tax advice; consult a CPA.
Schools (NCES district)
- District
- Aldine ISD
- NCES district ID
- 4807710
- Math proficiency
- 16% ▼ -23.00%
- Reading proficiency
- 21% ▼ -11.00%
- Median HH income
- $37,081
- Composite
- 15.42/100
- National rank
- #9317
- State rank
- #790 of 826 in TX
Livability — Houston
- Score
- 74/100
- State rank
- #184
- US rank
- #4771
Category grades
Schools grade is shown separately in the Schools card above.
Census & demographics
- Census place
- Houston, TX
- County
- Harris County · 4,702,590 people
- City population
- 3,226,434
- Metro
- Houston-The Woodlands-Sugar Land, TX
- Population (ZIP)
- 32,637
- Household income
- $57,232
- Rent vs Own
- Severe rent burden
- 1038.0
Population outlook (Harris County) Hauer SSP2
- Today (2025)
- 5,571,493 people
- By 2030
- 6,089,821 · +9.3%
- By 2040
- 7,142,806 · +28.2%
- By 2050
- 8,185,864 · +46.9%
- By 2075
- 10,574,329 · +89.8%
- By 2100
- 12,109,958 · +117.4%
Race, ethnicity, and origin ACS 2023
- Neighborhood character
- Predominantly Hispanic (70%)
- Race & ethnicity
- Hispanic / Latino 70% Two or more races 23% Black 21% Asian 4% White 3%
- Hispanic origin (detail)
- Mexican 52% Puerto Rican 1% Cuban 1%
- Foreign-born
- 36% · Canada, Vietnam
- Languages at home
- 32% English-only · Spanish 64% Vietnamese 3% Other Asian/Pacific 1%
Political lean MEDSL · Harris
- 2024 margin
- Lean D (+5.5) · D 52.0% · R 46.4% · Other 1.6%
- 2008→2024 swing
- +3.9pp toward D · 2008: 1.6pp · 2024: 5.5pp
- All cycles
- 2024: D+5.5 2020: D+13.3 2016: D+12.4 2012: D+0.1 2008: D+1.6
Not yet ingested
- Civics
- —
Market trends
- HPI YoY
- ▼ -69.18%
- Current HPI
- 277.0068
- Rent YoY
- —
- Metro
- Houston-The Woodlands-Sugar Land, TX
- State GDP YoY
- ▲ 3.95%
- F500 in state
- 110
Industry mix (Fortune 500 HQ in TX)
| Industry | F500 HQs | Revenue |
|---|---|---|
| Energy | 16 | $1,198B |
|
||
| Technology | 5 | $198B |
|
||
| Engineering / Construction | 4 | $72B |
|
||
| Energy Services | 3 | $60B |
|
||
| Utilities | 3 | $41B |
|
||
| Healthcare | 2 | $330B |
|
||
Price history
+21.5% since first listed22 events — show timeline
- 2026-05-18 Price Changed $79,000 HARMLS
- 2025-07-21 Price Changed $87,000 HARMLS
- 2025-06-02 Listed $93,000 HARMLS
- 2025-01-22 Listing Removed — HARMLS
- 2025-01-08 Price Changed $95,000 HARMLS
- 2024-10-11 Price Changed $99,500 HARMLS
- 2024-09-23 Listed $110,000 HARMLS
- 2024-06-03 Sold (Public Records) — Public Records
- 2024-05-31 Sold (MLS) — HARMLS
- 2024-05-22 Pending — HARMLS
- 2024-04-26 Listed $95,000 HARMLS
- 2022-12-21 Sold (Public Records) — Public Records
- 2021-02-05 Sold (Public Records) — Public Records
- 2021-02-03 Sold (MLS) — HARMLS
- 2021-01-09 Pending — HARMLS
- 2021-01-06 Pending — HARMLS
- 2020-12-10 Price Changed $55,000 HARMLS
- 2020-09-04 Listed $65,000 HARMLS
- 2013-08-20 Sold (Public Records) — Public Records
- 2008-11-12 Sold (Public Records) — Public Records
- 2008-05-01 Sold (Public Records) — Public Records
- 2000-11-21 Sold (Public Records) — Public Records
Property tax history
+10.7%/yrLatest (2025): $1,832 · +20.7% YoY. Source: county tax records.
Cash-flow waterfall
monthlySold comps — $/sqft
last 12 mo · ≤1 miLoading sold comps…