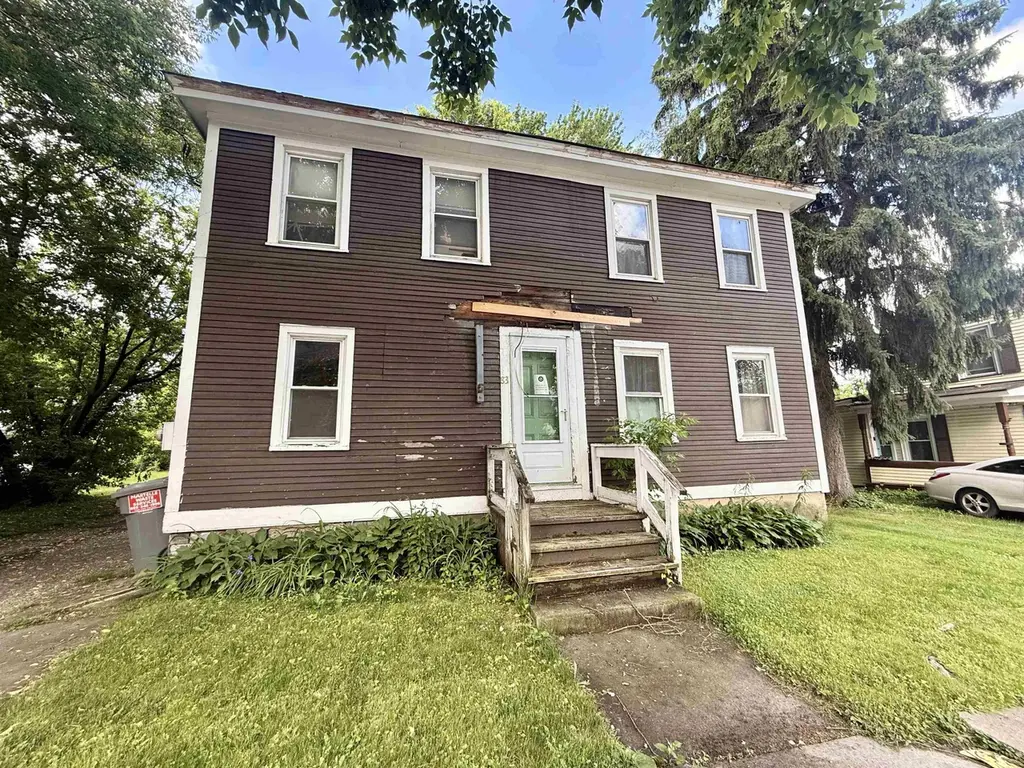
83 Granger St · Rutland, VT
Flood risk 4/10 · Minor
- FEMA flood zone
- X (unshaded)
- Chance of flooding over 30 yrs
- 0.22%
- Est. flood insurance / yr
- $473 – $860
Fire risk 1/10 · Minimal
- Est. fire insurance / yr
- $480 – $892
Heat risk 2/10 · Minimal
- Hot days now (above 92°F)
- 7 days/yr
- Hot days in 30 yrs
- 17 days/yr
Wind risk 2/10 · Minimal
- Chance of severe wind over 30 yrs
- 4.0%
Air-quality risk 1/10 · Minimal
- Unhealthy air days now
- 0 days/yr
- Unhealthy air days in 30 yrs
- 0 days/yr
Risk factors via First Street. Map © Google.
Why this score? — see what drove the D+ grade
The composite is a weighted blend of 9 inputs, each scored 0–100. Each bar is that input's sub-score; the figure is the points it added to the 100-point composite (weight × sub-score).
- Cash flow +13.7/30.0
- ARV discount +12.2/15.0
- Schools +5.0/10.0
- DSCR +4.1/10.0
- Livability +4.0/5.0
- 1% rule +3.2/10.0
- Rent growth +2.5/5.0
- Condition / age +2.5/5.0
- Appreciation +0.0/10.0
$225,000
🖨 Deal sheet 📄 Offer letter ✓ Due diligence
Listing remarks
Step inside this classic home at 83 Granger Street, conveniently located close to shopping, restaurants, schools, and all local amenities. Offering plenty of space and flexibility, this property features a first-floor bedroom, full bathroom, and washer/dryer hookups for added convenience and easy one-level living. While the home could benefit from some repairs and updates, it retains its timeless charm with beautiful hardwood floors and character throughout. The spacious layout includes several bonus rooms that can easily adapt to your lifestyle needs—whether you're looking for a home office, guest accommodations, playroom, hobby space, or additional living areas. The large unfinished
Key facts
- First-floor bedroom
- Generous yard
- Full bathroom
Tags
Property features AI
Exterior
- Parking: 3-car garage
- Utilities: Public water; Public sewer; 100 Amp electric; Internet: Unknown; Other utilities
- Home design: Colonial style; Existing construction; Facing direction: TBD
- Construction: Built in 1880; Vinyl siding; Shingle and slate roof
- Exterior features: City lot; Concrete, paved driveway; Public maintained road frontage
Interior
- Kitchen: Dishwasher
- Flooring: Laminate flooring; Wood flooring
- Bathrooms: 1 full bathroom; 1 three-quarter bathroom
- Heating & cooling: Forced air heating
- Interior features: 8 total rooms; Unfinished basement with interior access
Neighborhood map
What this means for you Summary
Snapshot
- This is a 3-bed/1.5-bath single-family listed at $225k.
Deal economics
- At list price, monthly cash flow is $17 ($199/yr) — positive.
- The deal already cash-flows at list — no discount required.
- To meet the 1% rule (rent ≥ 1% of price), the offer needs to be $183k (18.4% below list).
- Recommended offer: $183k (18.4% below list) — sets the bar for 1% rule.
- Cap rate 6.4% vs local median 4.3% in Rutland — top-decile yield for the area; either an underpriced asset or a hidden risk that comps aren't pricing in. Stress-test before assuming the spread holds.
Location & tenants
- Location reads 81/100 on livability (#6 in VT, #1,410 nationally) — a professional / high-income tenant draw. Strengths: schools A+, commute A+, cost of living A+; Watch: employment C-, crime F.
- Market conditions: 97 active listings in the ZIP; 90 units permitted in Rutland County in 2024 (0 in 5+ unit buildings).
Forward outlook
- Local home prices are declining (-3.0%/yr); year-one equity from $2k of loan paydown is wiped out by about $7k of value loss. Plan a longer hold.
- Rutland County population projected at -28% by 2050 — secular population decline; favor cash flow + early exit over multi-decade hold.
Negotiation context
- Only 6 days on market — expect competitive offers; lowballing is unlikely to land.
- Current owner paid $96k; list at $225k implies a 135% gain — meaningful room to come down on a strong offer.
Risks & watch-outs
- Watch-outs: built in 1880 — expect roof / HVAC / electrical / plumbing capex.
Questions for the listing agent
- Built in 1880 — when were the roof, HVAC, electrical panel, plumbing, and water heater last replaced?
- Is there a deadline driving the sale (1031 exchange, divorce, estate, relocation)? That informs how much negotiation room exists.
- Schools are A-rated — typically a magnet for longer-tenancy family renters. What's the average tenant stay here, and is there a school-zone premium baked into asking?
- Crime grade is F in this area — have there been break-ins, vandalism, or insurance claims at this property in the last 3 years? What carrier currently insures it and at what premium?
- The area grade is low — what's the realistic commute time and amenity access for the typical tenant pool here? Any planned neighborhood developments (good or bad) we should know about?
- What's the average days-on-market for RENTAL listings here right now (not sales)? A rising rental-DOM trend means longer vacancies and softer asking-rent achievability than the comps imply.
- What's the recent tenant-quality profile in this submarket — average credit score on applications, eviction rate, late-payment / NSF rate, and stable-employment percentage? A property-management company in the area should have these aggregated.
- How much new for-sale + rental construction is in the pipeline within 1–3 miles? Heavy new supply typically softens prices + rents 12–24 months out; constrained supply supports both.
Investment metrics
- 1% rule
- 0.82% ✗
- Cap rate
- 6.38%
- Cash-on-cash
- 0.32%
- DSCR
- 1.01
- GRM
- 10.2
CMA / ARV
- ARV (on-the-fly)
- $251,160
- Comps found
- 12
Show comp detail 12 sales within ~0.75 mi
| Address | Dist | Beds/Ba | Sqft | Sold | Price | $/sf | Match |
|---|---|---|---|---|---|---|---|
| 59 Cherry St | 0.12mi | 3/1.5 | 1,680 (-8%) | 3mo | $210,000 | $125 | 79 |
| 82 Forest St | 0.13mi | 3/2.0 | 1,752 (-4%) | 11mo | $250,000 | $143 | 76 |
| 102 Brown St | 0.15mi | 4/2.0 (+1) | 1,648 (-10%) | 5mo | $259,000 | $157 | 66 |
| 69 Plain St | 0.42mi | 4/2.0 (+1) | 1,752 (-4%) | 10mo | $130,000 | $74 | 59 |
| 47 Morse Pl | 0.43mi | 3/1.5 | 1,709 (-6%) | 13mo | $249,000 | $146 | 59 |
| 107 Library Ave | 0.66mi | 3/2.0 | 1,920 (+6%) | 12mo | $333,000 | $173 | 48 |
| 30 E Washington St | 0.68mi | 4/2.0 (+1) | 1,840 (+1%) | 14mo | $240,000 | $130 | 48 |
| 38 East St | 0.74mi | 4/3.0 (+1) | 1,832 (+1%) | 8mo | $280,000 | $153 | 46 |
| 50 Nichols St | 0.70mi | 3/1.0 | 1,694 (-7%) | 13mo | $233,500 | $138 | 43 |
| 98 park St | 0.61mi | 4/1.0 (+1) | 1,600 (-12%) | 2mo | $105,000 | $66 | 43 |
| 22 E Washington St | 0.63mi | 3/3.0 | 2,062 (+13%) | 2mo | $220,000 | $107 | 40 |
| 6 Avenue B | 0.70mi | 4/1.0 (+1) | 1,645 (-10%) | 10mo | $104,500 | $64 | 36 |
Match score weights: distance 35% · size 25% · config 20% · recency 20%. Top-matched comps best support the ARV.
Projected returns pro-forma
-3.0% appreciation · 3.0% rent growth · sell at horizon
- IRR
- -15.8%
- Equity multiple
- 0.44×
- Total profit
- $-35,449
- Equity at exit
- $33,548
- IRR
- -7.5%
- Equity multiple
- 0.53×
- Total profit
- $-29,699
- Equity at exit
- $19,454
Cash invested: $63,000 (down + closing). Projections, not guarantees.
Landlord ↔ Tenant lean methodology
- Overall (STATE)
- 41 Moderately Tenant-Leaning
- State Vermont
- 41 Moderately Tenant-Leaning · D+15
- County
- — inherits STATE
- City
- — inherits STATE
ZIP-level market 05701
- Home prices YoY
- -18.1%
- Active inventory
- 97
- Price-to-rent
- 10.2×
Monthly cashflow live
- Estimated rent
- $1,835 medium interval (Pro) →
- Mortgage (P&I)
- −$1,180
- Tax from tax record
- −$159 /mo · $1,912/yr
- Insurance
- −$94
- HOA
- −$0
- Vacancy / Maint / Mgmt
- −$385
- Net cashflow
- $17
Break-even live
UW: 25.0% down · 7.5% · 30yr · 1.5% tax · 5.0% vac · 8.0% maint · 8.0% mgmt
Financing live
Cash to close
- Down payment
- $56,250
- Closing costs
- $6,750
- Reserves months
- —
- Total cash needed
- —
Loan-product check · same deal, 3 products live
Conventional
25% down · 7.5% · 30yr
- Down + closing
- —
- Monthly P&I
- —
- Monthly cashflow
- —
- DSCR
- —
- Eligible?
- —
Personal DTI + credit; lowest rate.
DSCR
20% down · 8.5% · 30yr
- Down + closing
- —
- Monthly P&I
- —
- Monthly cashflow
- —
- DSCR
- —
- Eligible?
- —
No personal income docs; deal must DSCR.
Hard money
10% down · 12.0% · 12mo
- Down + closing
- —
- Monthly P&I
- —
- Monthly cashflow
- —
- DSCR
- —
- Eligible?
- —
Short-term bridge; refi at stabilization.
Listing history 7 events
-
2026-06-18days on market $225,000 Active 6 DOM
-
2026-06-17days on market $225,000 Active 5 DOM
-
2026-06-16days on market $225,000 Active 4 DOM
-
2026-06-15days on market $225,000 Active 3 DOM
-
2026-06-15days on market $225,000 Active 2 DOM
-
2026-06-12remarks 693-char remark
-
2026-06-12$225,000 Active 1 DOM
ⓘ Source: listings_history table (triggers on properties + properties_extension) + one-shot
backfill from property_details.listing_events for pre-trigger history.
Tax reassessment forecast VT · Partial reset (capped growth)
- Current annual tax
- $1,912 · $159/mo
- Projected year-2 tax
- $3,094 · $258/mo
- Expected delta
- +$1,181/yr (+$98/mo · 61.8%)
ⓘ Screening estimate from a state-policy table — verify with the county assessor before closing.
Climate risk First Street
- Flood 4/10 Moderate FEMA zone X (unshaded) · 22% chance over 30 yrs
- Wildfire 1/10 Low
- Heat 2/10 Low 7 d/yr ≥92°F today · 17 d/yr by 30 yrs out
- Wind 2/10 Low 4% chance of damaging wind over 30 yrs
- Air quality 1/10 Low 0 unhealthy d/yr today · 0 by 30 yrs out
Nearby sold comps map
Loading sold comps map…
Walkable amenities ~0.75 mi
Loading nearby amenities…
Taxation est. · year 1
- Rental income
- $22,020
- − Mortgage interest
- −$12,603
- − Property taxes
- −$1,912
- − Insurance
- −$1,125
- − Repairs & maintenance
- −$1,762
- − Management
- −$1,762
- − Depreciation
- −$6,545
- Taxable loss
- −$3,690
- Est. tax savings @ 24.0%
- +$886
- After-tax cash flow
- $1,085/yr
For passive investors: Depreciation is non-cash, so a rental often shows a tax loss while cash-flowing — sheltering income. Rental losses are passive: they offset passive income freely, and up to $25,000/yr can offset ordinary (W-2) income if you actively participate and your MAGI is under $100k (phasing out to $0 by $150k); unused losses carry forward. On sale, claimed depreciation is recaptured at up to 25%, and gains may owe capital-gains tax (a 1031 exchange can defer both). Figures are a year-1 estimate at your 24.0% rate — not tax advice; consult a CPA.
Schools (NCES district)
No district data.
Livability — Rutland
- Score
- 81/100
- State rank
- #6
- US rank
- #1410
Category grades
Schools grade is shown separately in the Schools card above.
Census & demographics
- Census place
- Rutland, VT
- Population (ZIP)
- 20,142
Population outlook (Rutland County) Hauer SSP2
- Today (2025)
- 55,307 people
- By 2030
- 52,364 · -5.3%
- By 2040
- 45,751 · -17.3%
- By 2050
- 39,627 · -28.4%
- By 2075
- 29,080 · -47.4%
- By 2100
- 20,673 · -62.6%
Race, ethnicity, and origin ACS 2023
- Neighborhood character
- Predominantly White (94%)
- Race & ethnicity
- White 94% Two or more races 4% Hispanic / Latino 2%
- Common ancestry
- Lithuanian 14% Romanian 6% Slovak 3%
- Foreign-born
- 2% · Canada
- Languages at home
- 94% English-only · Spanish 3% French/Haitian/Cajun 1% Other Asian/Pacific 1%
Political lean MEDSL · Rutland
- 2024 margin
- Lean D (+5.3) · D 51.3% · R 46.0% · Other 2.7%
- 2008→2024 swing
- -19.3pp toward R · 2008: 24.6pp · 2024: 5.3pp
- All cycles
- 2024: D+5.3 2020: D+10.5 2016: D+4.2 2012: D+22.0 2008: D+24.6
Not yet ingested
- Civics
- —
Market trends
- HPI YoY
- ▼ -63.90%
- Current HPI
- 288.4214
- Rent YoY
- —
- Metro
- —
- State GDP YoY
- —
- F500 in state
- 0
Price history
+336.9% since first listed3 events — show timeline
- 2026-06-12 Listed $225,000 PrimeMLS
- 2004-05-24 Sold (Public Records) $95,600 Public Records
- 1991-05-22 Sold (Public Records) $51,500 Public Records
Property tax history
+16.3%/yrLatest (2024): $1,912 · +6.3% YoY. Source: county tax records.
Cash-flow waterfall
monthlySold comps — $/sqft
last 12 mo · ≤1 miLoading sold comps…