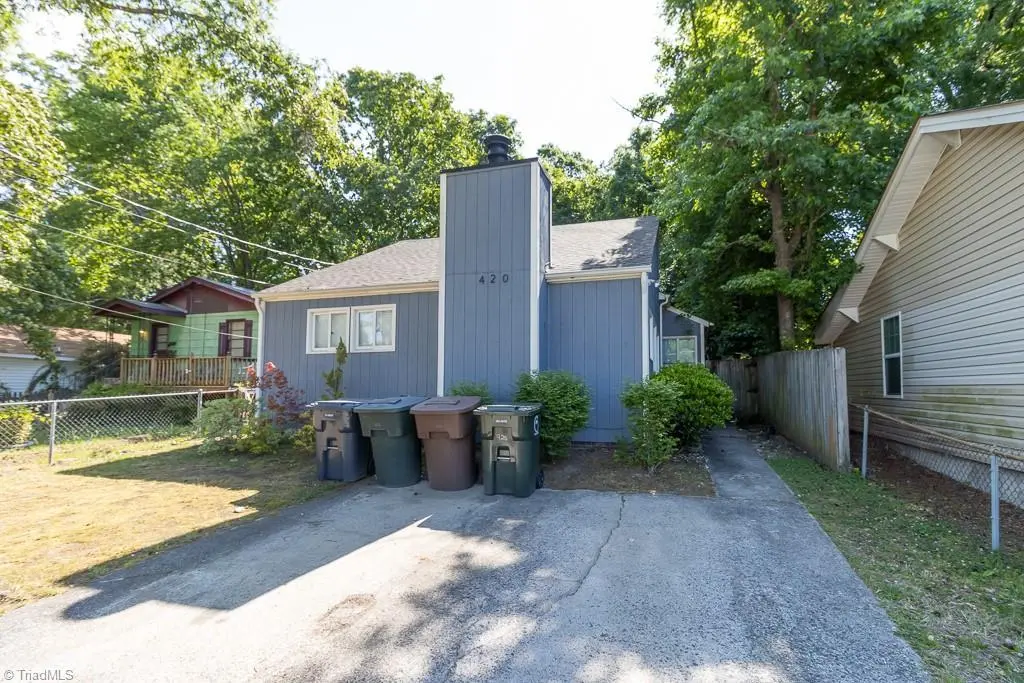
420 Beech St · Greensboro, NC
Flood risk 1/10 · Minimal
- FEMA flood zone
- X (unshaded)
- Chance of flooding over 30 yrs
- 0.0%
- Est. flood insurance / yr
- $507 – $1,088
Fire risk 1/10 · Minimal
- Est. fire insurance / yr
- $906 – $1,684
Heat risk 6/10 · Moderate
- Hot days now (above 103°F)
- 7 days/yr
- Hot days in 30 yrs
- 17 days/yr
Wind risk 4/10 · Minor
- Chance of severe wind over 30 yrs
- 13.0%
Air-quality risk 2/10 · Minimal
- Unhealthy air days now
- 1 days/yr
- Unhealthy air days in 30 yrs
- 2 days/yr
Risk factors via First Street. Map © Google.
Why this score? — see what drove the D+ grade
The composite is a weighted blend of 9 inputs, each scored 0–100. Each bar is that input's sub-score; the figure is the points it added to the 100-point composite (weight × sub-score).
- Cash flow +16.3/30.0
- ARV discount +7.3/15.0
- DSCR +5.1/10.0
- Livability +4.0/5.0
- 1% rule +3.6/10.0
- Schools +3.6/10.0
- Rent growth +2.9/5.0
- Condition / age +2.5/5.0
- Appreciation +0.0/10.0
$189,900
🖨 Deal sheet (PDF) 📄 Offer letter ✓ Due diligence
Listing remarks
Charming 2-bedroom, 2-bath home conveniently located near North Carolina A & T University and downtown Greensboro. Features a fenced in yard and offers excellent potential as an investment property or primary residence.
Key facts
- Primary residence
- Investment property
- Fenced in yard
Tags
Property features AI
Finance
- HOA & community: No association
Exterior
- Parking: Driveway
- Utilities: Public water; Public sewer; Electric water heater
- Home design: Residential stick/site-built house; One story; Built in 1985; Living room fireplace
- Construction: Wood siding; Slab foundation
- Exterior features: Fenced yard; Public-maintained road
Interior
- Kitchen: Disposal; Free-standing range; Range hood; Electric water heater
- Bedrooms: Primary bedroom on main level
- Flooring: Carpet; Laminate; Tile
- Bathrooms: 2 full bathrooms
- Heating & cooling: Central air conditioning; Forced air heating (natural gas)
- Interior features: Primary bedroom on main level; Ceiling fan(s)
Neighborhood map
What this means for you Summary
Snapshot
- This is a 3-bed/2.0-bath single-family listed at $190k.
Deal economics
- At list price, monthly cash flow is $105 ($1k/yr) — positive.
- The deal already cash-flows at list — no discount required.
- To meet the 1% rule (rent ≥ 1% of price), the offer needs to be $163k (14.1% below list).
- Recommended offer: $163k (14.1% below list) — sets the bar for 1% rule.
- Cap rate 7.0% vs local median 3.7% in Greensboro — top-decile yield for the area; either an underpriced asset or a hidden risk that comps aren't pricing in. Stress-test before assuming the spread holds.
Location & tenants
- Location reads 81/100 on livability (#12 in NC, #1,335 nationally) — a professional / high-income tenant draw. Strengths: amenities A+, commute A+, cost of living A+; Watch: employment D, crime F.
- Guilford County Schools (urban): math 39% / reading 45% proficiency, ranked #99 of 178 in NC (top 56%) — families likely to look elsewhere, expect single-tenant / working-renter base with shorter leases.
- Zoned schools: John Van Lindley Elementary (math 37% / reading 53%, grade D-, #568 of 1,410 statewide, top 41%, 468 students, 56% FRL); Kiser Middle (math 37% / reading 50%, grade D, #182 of 475 statewide, top 40%, 902 students, 58% FRL); Grimsley High (math 60% / reading 62%, grade C+, #202 of 535 statewide, top 39%, 1,899 students, 47% FRL) — zoned schools at 54% FRL track the district average.
- Market conditions: Rents rising (+1.8%/yr); 130 active listings in the ZIP; 28 comparable units currently listed for rent nearby; rentals at typical pace (median 26d on market — plan ~3-4 weeks tenant-placement turnaround); 3,843 units permitted in Guilford County in 2024 (2,397 in 5+ unit buildings).
- This rent runs 41% of the median local income ($48k/yr) — at the standard rent-burdened threshold; future hikes will face affordability resistance.
Forward outlook
- Local home prices are declining (-3.0%/yr); year-one equity from $1k of loan paydown is wiped out by about $6k of value loss. Plan a longer hold.
- Guilford County population projected at +26% by 2050 — long-run rental-demand tailwind backs the buy-and-hold thesis.
Negotiation context
- Only 14 days on market — expect competitive offers; lowballing is unlikely to land.
- Current owner paid $86k; list at $190k implies a 121% gain — meaningful room to come down on a strong offer.
Risks & watch-outs
- Climate carrying-cost: extreme-heat days projected 7→17/yr by 2055 (HVAC capex compounding) — expect insurance premiums to compound above CPI over the hold.
Questions for the listing agent
- Is there a deadline driving the sale (1031 exchange, divorce, estate, relocation)? That informs how much negotiation room exists.
- Crime grade is F in this area — have there been break-ins, vandalism, or insurance claims at this property in the last 3 years? What carrier currently insures it and at what premium?
- The area grade is low — what's the realistic commute time and amenity access for the typical tenant pool here? Any planned neighborhood developments (good or bad) we should know about?
- What's the average days-on-market for RENTAL listings here right now (not sales)? A rising rental-DOM trend means longer vacancies and softer asking-rent achievability than the comps imply.
- What's the recent tenant-quality profile in this submarket — average credit score on applications, eviction rate, late-payment / NSF rate, and stable-employment percentage? A property-management company in the area should have these aggregated.
- How much new for-sale + rental construction is in the pipeline within 1–3 miles? Heavy new supply typically softens prices + rents 12–24 months out; constrained supply supports both.
Investment metrics
- 1% rule
- 0.86% ✗
- Cap rate
- 6.96%
- Cash-on-cash
- 2.38%
- DSCR
- 1.11
- GRM
- 9.7
CMA / ARV
- ARV (on-the-fly)
- $189,024
- Comps found
- 7
Show comp detail 7 sales within ~0.75 mi
| Address | Dist | Beds/Ba | Sqft | Sold | Price | $/sf | Match |
|---|---|---|---|---|---|---|---|
| 800 Bluford St | 0.09mi | 3/1.0 | 960 (-9%) | 3mo | $223,500 | $233 | 74 |
| 702 5th Ave | 0.33mi | 2/1.0 (-1) | 1,037 (-2%) | 12mo | $253,000 | $244 | 63 |
| 701 Park Ave | 0.24mi | 2/1.5 (-1) | 956 (-10%) | 5mo | $180,000 | $188 | 62 |
| 306 Regan St | 0.15mi | 3/1.0 | 953 (-10%) | 21mo | $140,000 | $147 | 55 |
| 514 Boyd St | 0.28mi | 2/1.0 (-1) | 932 (-12%) | 21mo | $167,000 | $179 | 40 |
| 709 N Church St | 0.58mi | 2/1.0 (-1) | 1,148 (+9%) | 18mo | $165,000 | $144 | 34 |
| 215 Marshall St | 0.73mi | 2/1.0 (-1) | 925 (-12%) | 6mo | $80,000 | $86 | 31 |
Match score weights: distance 35% · size 25% · config 20% · recency 20%. Top-matched comps best support the ARV.
Projected returns pro-forma
-3.0% appreciation · 1.78% rent growth · sell at horizon
- IRR
- -13.8%
- Equity multiple
- 0.51×
- Total profit
- $-26,103
- Equity at exit
- $28,315
- IRR
- -6.9%
- Equity multiple
- 0.58×
- Total profit
- $-22,243
- Equity at exit
- $16,419
Cash invested: $53,172 (down + closing). Projections, not guarantees.
Landlord ↔ Tenant lean methodology
- Overall (STATE)
- 85 Strongly Landlord-Friendly
- State North Carolina
- 85 Strongly Landlord-Friendly · R+3
- County
- — inherits STATE
- City
- — inherits STATE
ZIP-level market 27401
- Home prices YoY
- -28.9%
- Rents YoY
- 1.8%
- Active inventory
- 130
- Price-to-rent
- 9.7×
Monthly cashflow live
- Estimated rent
- $1,631 high interval (Pro) →
- Mortgage (P&I)
- −$996
- Tax from tax record
- −$109 /mo · $1,303/yr
- Insurance
- −$79
- HOA
- −$0
- Vacancy / Maint / Mgmt
- −$343
- Net cashflow
- $105
Break-even live
Sensitivity live
| Price | -10% $213 | -5% $159 | +0% $105 | +5% $51 | +10% $-2 |
|---|---|---|---|---|---|
| Rent | -10% $-24 | -5% $41 | +0% $105 | +5% $170 | +10% $234 |
| Rate | -1.0pp $201 | -0.5pp $154 | base $105 | +0.5pp $56 | +1.0pp $6 |
UW: 25.0% down · 7.5% · 30yr · 1.5% tax · 5.0% vac · 8.0% maint · 8.0% mgmt
Financing live
Cash to close
- Down payment
- $47,475
- Closing costs
- $5,697
- Reserves months
- —
- Total cash needed
- —
Loan-product check · same deal, 3 products live
Conventional
25% down · 7.5% · 30yr
- Down + closing
- —
- Monthly P&I
- —
- Monthly cashflow
- —
- DSCR
- —
- Eligible?
- —
Personal DTI + credit; lowest rate.
DSCR
20% down · 8.5% · 30yr
- Down + closing
- —
- Monthly P&I
- —
- Monthly cashflow
- —
- DSCR
- —
- Eligible?
- —
No personal income docs; deal must DSCR.
Hard money
10% down · 12.0% · 12mo
- Down + closing
- —
- Monthly P&I
- —
- Monthly cashflow
- —
- DSCR
- —
- Eligible?
- —
Short-term bridge; refi at stabilization.
Rent comps 28 comps
| Address | Beds | Baths | Sqft | Rent | $/sqft | DOM | Units | Dist |
|---|---|---|---|---|---|---|---|---|
| 405 N Dudley St Greensboro, NC | 3.0 | 2.0 | 1264 | $2,200 | $1.74 | 16d | 1 | 0.07mi |
| 506 Martin St Greensboro, NC | 3.0 | 2.0 | 1296 | $1,500 | $1.16 | 25d | 1 | 0.66mi |
| 201 N Elm St Greensboro, NC | 2.0 | 2.0 | 1154 | $2,195 | $1.90 | 25d | 1 | 0.68mi |
| 201 N Elm St Greensboro, NC | 2.0 | 2.0 | 1046 | $2,298 | $2.20 | 16d | 2 | 0.69mi |
| 201 Huffman St Greensboro, NC | 3.0 | 2.0 | 1350 | $1,000 | $0.74 | 16d | 1 | 0.79mi |
| 2011 Lutheran St Greensboro, NC | 2.0 | 1.0 | 800 | $985 | $1.23 | 25d | 1 | 0.79mi |
| 321 S Elm St Greensboro, NC | 1.0–2.0 | 1.0–2.0 | 950 | $1,787 | $1.88 | 16d | 8 | 0.81mi |
| 451 N Eugene St Greensboro, NC | 1.0–2.0 | 1.0–2.0 | 1021 | $2,309 | $2.26 | 16d | 6 | 0.85mi |
| 404 W Smith St Greensboro, NC | 1.0–2.0 | 1.0–2.0 | 803 | $1,719 | $2.14 | 16d | 8 | 0.89mi |
| 710 Reid St Greensboro, NC | 3.0 | 1.0 | 925 | $1,395 | $1.51 | 16d | 1 | 0.90mi |
| 1001 E Bragg St Apt B Greensboro, NC | 2.0 | 1.0 | 700 | $925 | $1.32 | 16d | 1 | 0.92mi |
| 403 S O Henry Blvd Unit Alexander Homes Greensboro, NC | 2.0 | 1.0 | 860 | $875 | $1.02 | 25d | 1 | 0.93mi |
| 503 S O Henry Blvd Greensboro, NC | 2.0 | 1.0 | 860 | $850 | $0.99 | 25d | 1 | 0.94mi |
| 238 E Lewis St #302 Greensboro, NC | 2.0 | 2.0 | 1270 | $1,795 | $1.41 | 25d | 1 | 0.98mi |
| 110 S Raleigh St Greensboro, NC | 3.0 | 1.0 | 1000 | $1,200 | $1.20 | 25d | 1 | 1.12mi |
| 112 S Raleigh St Greensboro, NC | 3.0 | 1.0 | 1000 | $1,200 | $1.20 | 25d | 1 | 1.12mi |
| 2001 Spencer St Greensboro, NC | 2.0 | 1.0 | 720 | $1,295 | $1.80 | 25d | 1 | 1.24mi |
| 801 W McGee St #25 Greensboro, NC | 2.0 | 2.0 | 960 | $1,550 | $1.61 | 23d | 1 | 1.24mi |
| 1410 Maple St Greensboro, NC | 3.0 | 1.0 | 1015 | $1,150 | $1.13 | 16d | 1 | 1.29mi |
| 909 Tuscaloosa St Greensboro, NC | 2.0 | 1.0 | 840 | $1,195 | $1.42 | 25d | 1 | 1.31mi |
| 405 E Whittington St Greensboro, NC | 2.0 | 1.0 | 700 | $995 | $1.42 | 25d | 1 | 1.32mi |
| 1000 Hill St Greensboro, NC | 2.0 | 1.0 | 888 | $850 | $0.96 | 23d | 1 | 1.33mi |
| 1004 Hill St Unit 1004-A Greensboro, NC | 3.0 | 2.0 | 1087 | $1,195 | $1.10 | 25d | 1 | 1.33mi |
| 1700 N Elm St Unit J3 Greensboro, NC | 2.0 | 1.0 | 841 | $1,350 | $1.61 | 25d | 1 | 1.38mi |
| 808 Idlewood Dr Greensboro, NC | 3.0 | 1.0 | 900 | $1,499 | $1.67 | 21d | 1 | 1.38mi |
| 1007 Hill St Unit 1007-C Greensboro, NC | 2.0 | 2.5 | 1050 | $1,595 | $1.52 | 25d | 1 | 1.39mi |
| 1604 Textile Dr Greensboro, NC | 2.0 | 1.0 | 930 | $1,245 | $1.34 | 25d | 1 | 1.42mi |
| 904 Stephens St Greensboro, NC | 3.0 | 1.0 | 1052 | $1,490 | $1.42 | 16d | 1 | 1.50mi |
Listing history 11 events
-
2026-06-07status $189,900 Pending 14 DOM
-
2026-06-03days on market $189,900 Due Diligence Period 14 DOM
-
2026-06-02days on market $189,900 Due Diligence Period 13 DOM
-
2026-06-01days on market $189,900 Due Diligence Period 12 DOM
-
2026-05-31days on market $189,900 Due Diligence Period 11 DOM
-
2026-05-31days on market $189,900 Due Diligence Period 10 DOM
-
2026-05-20$189,900 Active
-
2002-08-07soldstatus $86,000
-
1999-09-02soldstatus $84,000
-
1998-03-01soldstatus $71,500
-
1998-01-01soldstatus $41,200
ⓘ Source: listings_history table (triggers on properties + properties_extension) + one-shot
backfill from property_details.listing_events for pre-trigger history.
Tax reassessment forecast NC · Resets to sale price
- Current annual tax
- $1,303 · $109/mo
- Projected year-2 tax
- $1,557 · $130/mo
- Expected delta
- +$254/yr (+$21/mo · 19.5%)
ⓘ Screening estimate from a state-policy table — verify with the county assessor before closing.
Climate risk First Street
- Flood 1/10 Low FEMA zone X (unshaded) · 0% chance over 30 yrs
- Wildfire 1/10 Low
- Heat 6/10 Major 7 d/yr ≥103°F today · 17 d/yr by 30 yrs out
- Wind 4/10 Moderate 13% chance of damaging wind over 30 yrs
- Air quality 2/10 Low 1 unhealthy d/yr today · 2 by 30 yrs out
Nearby sold comps map
Loading sold comps map…
Walkable amenities ~0.75 mi
Loading nearby amenities…
Taxation est. · year 1
- Rental income
- $19,577
- − Mortgage interest
- −$10,637
- − Property taxes
- −$1,303
- − Insurance
- −$950
- − Repairs & maintenance
- −$1,566
- − Management
- −$1,566
- − Depreciation
- −$5,524
- Taxable loss
- −$1,970
- Est. tax savings @ 24.0%
- +$473
- After-tax cash flow
- $1,736/yr
For passive investors: Depreciation is non-cash, so a rental often shows a tax loss while cash-flowing — sheltering income. Rental losses are passive: they offset passive income freely, and up to $25,000/yr can offset ordinary (W-2) income if you actively participate and your MAGI is under $100k (phasing out to $0 by $150k); unused losses carry forward. On sale, claimed depreciation is recaptured at up to 25%, and gains may owe capital-gains tax (a 1031 exchange can defer both). Figures are a year-1 estimate at your 24.0% rate — not tax advice; consult a CPA.
Schools (NCES district)
- District
- Guilford County Schools
- NCES district ID
- 3701920
- Math proficiency
- 39% ▲ 1.00%
- Reading proficiency
- 45% ▲ 1.00%
- Median HH income
- $46,315
- Composite
- 35.78/100
- National rank
- #4842
- State rank
- #99 of 178 in NC
Livability — Greensboro
- Score
- 81/100
- State rank
- #12
- US rank
- #1335
Category grades
Schools grade is shown separately in the Schools card above.
Census & demographics
- Census place
- Greensboro, NC
- County
- Guilford County · 487,190 people
- City population
- 329,421
- Metro
- Greensboro-High Point, NC
- Population (ZIP)
- 21,920
- Household income
- $47,972
- Rent vs Own
- Severe rent burden
- 1138.0
Population outlook (Guilford County) Hauer SSP2
- Today (2025)
- 584,596 people
- By 2030
- 616,851 · +5.5%
- By 2040
- 678,451 · +16.1%
- By 2050
- 734,788 · +25.7%
- By 2075
- 862,985 · +47.6%
- By 2100
- 948,704 · +62.3%
Race, ethnicity, and origin ACS 2023
- Neighborhood character
- Majority Black (62%)
- Race & ethnicity
- Black 62% White 26% Hispanic / Latino 8% Two or more races 4% Asian 1%
- Hispanic origin (detail)
- Mexican 4%
- Common ancestry
- Italian 1% Serbian 1% Slovak 1%
- Foreign-born
- 9% · Canada
- Languages at home
- 88% English-only · Spanish 6% Arabic 2% French/Haitian/Cajun 1%
Political lean MEDSL · Guilford
- 2024 margin
- Strong D (+21.8) · D 60.2% · R 38.4% · Other 1.4%
- 2008→2024 swing
- +3.5pp toward D · 2008: 18.4pp · 2024: 21.8pp
- All cycles
- 2024: D+21.8 2020: D+23.1 2016: D+20.0 2012: D+16.5 2008: D+18.4
Not yet ingested
- Civics
- —
Market trends
- HPI YoY
- ▼ -97.87%
- Current HPI
- 240.5377
- Rent YoY
- ▲ 1.78%
- Metro
- Greensboro-High Point, NC
- State GDP YoY
- ▲ 3.28%
- F500 in state
- 26
Industry mix (Fortune 500 HQ in NC)
| Industry | F500 HQs | Revenue |
|---|---|---|
| Financial Services | 2 | $213B |
|
||
| Retail | 2 | $95B |
|
||
| Industrial Conglomerate | 1 | $38B |
|
||
| Metals / Steel | 1 | $35B |
|
||
| Utilities | 1 | $30B |
|
||
| Industrial Machinery | 1 | $19B |
|
||
Price history
+360.9% since first listed5 events — show timeline
- 2026-05-20 Listed $189,900 Triad MLS
- 2002-08-07 Sold (Public Records) $86,000 Public Records
- 1999-09-02 Sold (Public Records) $84,000 Public Records
- 1998-03-01 Sold (Public Records) $71,500 Public Records
- 1998-01-01 Sold (Public Records) $41,200 Public Records
Property tax history
+2.3%/yrLatest (2025): $1,303 · -1.0% YoY. Source: county tax records.
Cash-flow waterfall
monthlySold comps — $/sqft
last 12 mo · ≤1 miLoading sold comps…