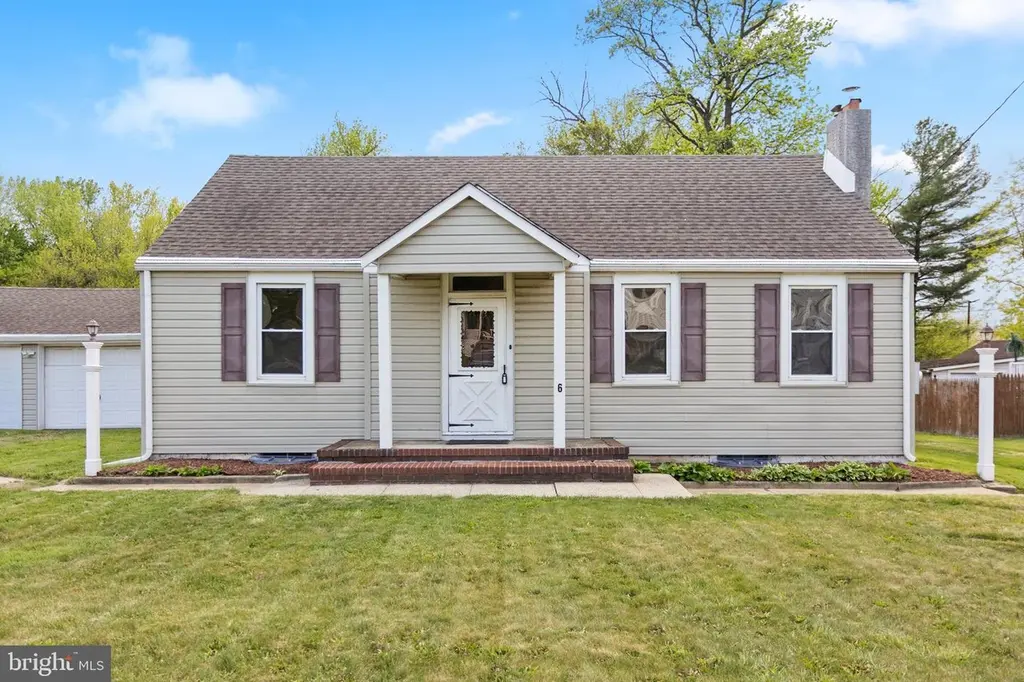
6 Butts Ave · Bordentown, NJ
Flood risk 1/10 · Minimal
- FEMA flood zone
- X (unshaded)
- Chance of flooding over 30 yrs
- 0.0%
- Est. flood insurance / yr
- $507 – $1,088
Fire risk 1/10 · Minimal
- Est. fire insurance / yr
- $526 – $976
Heat risk 6/10 · Moderate
- Hot days now (above 102°F)
- 7 days/yr
- Hot days in 30 yrs
- 15 days/yr
Wind risk 6/10 · Moderate
- Chance of severe wind over 30 yrs
- 27.0%
Air-quality risk 5/10 · Moderate
- Unhealthy air days now
- 6 days/yr
- Unhealthy air days in 30 yrs
- 8 days/yr
Risk factors via First Street. Map © Google.
Why this score? — see what drove the C grade
The composite is a weighted blend of 9 inputs, each scored 0–100. Each bar is that input's sub-score; the figure is the points it added to the 100-point composite (weight × sub-score).
- Cash flow +17.3/30.0
- ARV discount +15.0/15.0
- 1% rule +5.7/10.0
- DSCR +5.4/10.0
- Rent growth +4.0/5.0
- Livability +3.9/5.0
- Schools +3.8/10.0
- Condition / age +2.5/5.0
- Appreciation +0.0/10.0
$299,000
🖨 Deal sheet 📄 Offer letter ✓ Due diligence
Listing remarks
* * * Structural issues with basement foundation walls. Please read info below and review the structural engineer’s report for more info * * * Opportunity awaits in this 4-bedroom, 1.5-bath Cape Cod located in desirable Bordentown Township. At 1,540 sq ft this home features two spacious bedrooms on the main level and two additional large bedrooms upstairs. The main living area is accented by bamboo flooring in the living and dining rooms, along with built-ins surrounding a wood-burning fireplace insert that adds warmth and character. The kitchen opens to the dining area — white cabinetry, tile backsplash and peninsula, and generous counter space. The primary bedroom has ori
Key facts
- Peninsula
- Bamboo flooring
- White cabinetry
Tags
Property features AI
Finance
- Other: Fee simple ownership
Exterior
- Parking: Detached garage (2 spaces); Front-entry and side-entry garage access; Driveway with space for 2 cars (concrete driveway); Total of 4 garage/parking spaces
- Utilities: Public water; Public sewer; Municipal trash service; Electric hot water
- Home design: Detached single-family home; Shingle roof
- Construction: Frame construction; Brick/mortar foundation
- Exterior features: Level entry at main entrance; In-ground vinyl personal pool with fencing; Lot approximately 100 x 195
Interior
- Kitchen: Kitchen integrated with dining area
- Bedrooms: Two bedrooms on the main level; Two bedrooms on the lower level
- Flooring: Wood; Luxury vinyl plank; Slate; Tile/brick
- Bathrooms: One full bathroom; One half bathroom (lower level)
- Heating & cooling: Forced air heating (oil-fired); Central air conditioning
- Interior features: Combination kitchen and dining area; Entry-level bedroom; Wood floors; Drywall and plaster walls
- Laundry & utility: Main-floor laundry
Neighborhood map
What this means for you Summary
Snapshot
- This is a 4-bed/1.5-bath single-family listed at $299k.
Deal economics
- At list price, monthly cash flow is $220 ($3k/yr) — positive.
- The deal already cash-flows at list — no discount required.
- Meets the 1% rule at list price ($3k rent vs $299k).
- Cap rate 7.2% vs local median 3.3% in Bordentown — top-decile yield for the area; either an underpriced asset or a hidden risk that comps aren't pricing in. Stress-test before assuming the spread holds.
Location & tenants
- Location reads 77/100 on livability (#115 in NJ, #2,907 nationally) — a middle-class / working-renter tenant base. Strengths: crime A+, employment A+, housing A+; Watch: commute D+, amenities F, cost of living F.
- Bordentown Regional School District (suburban): math 29% / reading 53% proficiency, ranked #206 of 472 in NJ (top 44%) — families likely to look elsewhere, expect single-tenant / working-renter base with shorter leases; only 12% free/reduced lunch — higher-income household profile.
- Market conditions: Rents rising fast (+6.1%/yr); 97 active listings in the ZIP; 4 comparable units currently listed for rent nearby; rentals at typical pace (median 21d on market — plan ~3-4 weeks tenant-placement turnaround); high-income renter base; 2,161 units permitted in Burlington County in 2024 (988 in 5+ unit buildings).
- This rent runs 34% of the median local income ($113k/yr) — at the standard rent-burdened threshold; future hikes will face affordability resistance.
Forward outlook
- Local home prices are declining (-3.0%/yr); year-one equity from $2k of loan paydown is wiped out by about $9k of value loss. Plan a longer hold.
- Burlington County population projected to shrink 5% by 2050 — rents likely to lag national; underwrite the cash flow, not the appreciation.
Negotiation context
- Only 6 days on market — expect competitive offers; lowballing is unlikely to land.
Risks & watch-outs
- Watch-outs: built in 1946 — expect roof / HVAC / electrical / plumbing capex.
- Climate carrying-cost: major wind risk, 27% chance of damaging wind over 30y; extreme-heat days projected 7→15/yr by 2055 (HVAC capex compounding) — expect insurance premiums to compound above CPI over the hold.
Questions for the listing agent
- Built in 1946 — when were the roof, HVAC, electrical panel, plumbing, and water heater last replaced?
- Is there a deadline driving the sale (1031 exchange, divorce, estate, relocation)? That informs how much negotiation room exists.
- Schools are B-rated — typically a magnet for longer-tenancy family renters. What's the average tenant stay here, and is there a school-zone premium baked into asking?
- What's the average days-on-market for RENTAL listings here right now (not sales)? A rising rental-DOM trend means longer vacancies and softer asking-rent achievability than the comps imply.
- What's the recent tenant-quality profile in this submarket — average credit score on applications, eviction rate, late-payment / NSF rate, and stable-employment percentage? A property-management company in the area should have these aggregated.
- How much new for-sale + rental construction is in the pipeline within 1–3 miles? Heavy new supply typically softens prices + rents 12–24 months out; constrained supply supports both.
Investment metrics
- 1% rule
- 1.07% ✓
- Cap rate
- 7.18%
- Cash-on-cash
- 3.16%
- DSCR
- 1.14
- GRM
- 7.8
CMA / ARV
- ARV (median comp)
- $457,920
- List price
- $299,000
- Delta
- -34.70%
- Verdict
- UNDERPRICED
- Comps
- 20 within 1.0 mi
Show comp detail 12 sales within ~0.75 mi
| Address | Dist | Beds/Ba | Sqft | Sold | Price | $/sf | Match |
|---|---|---|---|---|---|---|---|
| 6 Butts Ave | 0.00mi | 4/1.5 | 1,540 (0%) | 0mo | $315,000 | $205 | 100 |
| 186 Crosswicks Rd | 0.12mi | 4/1.5 | 1,651 (+7%) | 8mo | $345,000 | $209 | 76 |
| 49 Charles Bossert Dr | 0.69mi | 4/2.0 | 1,553 (+1%) | 3mo | $450,000 | $290 | 62 |
| 82 Charles Bossert Dr | 0.63mi | 4/1.0 | 1,473 (-4%) | 1mo | $398,500 | $271 | 60 |
| 6 W Church St | 0.69mi | 4/2.0 | 1,584 (+3%) | 2mo | $499,990 | $316 | 60 |
| 57 Hinkle Dr | 0.43mi | 3/1.0 (-1) | 1,453 (-6%) | 8mo | $400,000 | $275 | 57 |
| 5 Forsgate Ln | 0.58mi | 3/2.0 (-1) | 1,653 (+7%) | 2mo | $380,000 | $230 | 52 |
| 103 Eaton Rd | 0.69mi | 3/2.0 (-1) | 1,526 (-1%) | 9mo | $475,000 | $311 | 52 |
| 163 2nd St | 0.55mi | 3/2.0 (-1) | 1,438 (-7%) | 9mo | $420,000 | $292 | 49 |
| 39 Charles Bossert Dr | 0.65mi | 4/2.0 | 1,733 (+12%) | 2mo | $480,000 | $277 | 45 |
| 16 Lexington Rd | 0.64mi | 4/1.5 | 1,722 (+12%) | 8mo | $430,000 | $250 | 44 |
| 283 Ward Ave | 0.70mi | 3/1.5 (-1) | 1,389 (-10%) | 3mo | $435,000 | $313 | 43 |
Match score weights: distance 35% · size 25% · config 20% · recency 20%. Top-matched comps best support the ARV.
Projected returns pro-forma
-3.0% appreciation · 6.07% rent growth · sell at horizon
- IRR
- -7.5%
- Equity multiple
- 0.71×
- Total profit
- $-24,017
- Equity at exit
- $44,582
- IRR
- 5.9%
- Equity multiple
- 1.51×
- Total profit
- $42,557
- Equity at exit
- $25,852
Cash invested: $83,720 (down + closing). Projections, not guarantees.
Landlord ↔ Tenant lean methodology
- Overall (STATE)
- 21 Tenant-Leaning
- State New Jersey
- 21 Tenant-Leaning · D+6
- County
- — inherits STATE
- City
- — inherits STATE
ZIP-level market 08505
- Home prices YoY
- -31.6%
- Rents YoY
- 6.1%
- Active inventory
- 97
- Price-to-rent
- 7.8×
Monthly cashflow live
- Estimated rent
- $3,205 medium interval (Pro) →
- Mortgage (P&I)
- −$1,568
- Tax from tax record
- −$619 /mo · $7,424/yr
- Insurance
- −$125
- HOA
- −$0
- Vacancy / Maint / Mgmt
- −$673
- Net cashflow
- $220
Break-even live
UW: 25.0% down · 7.5% · 30yr · 1.5% tax · 5.0% vac · 8.0% maint · 8.0% mgmt
Financing live
Cash to close
- Down payment
- $74,750
- Closing costs
- $8,970
- Reserves months
- —
- Total cash needed
- —
Loan-product check · same deal, 3 products live
Conventional
25% down · 7.5% · 30yr
- Down + closing
- —
- Monthly P&I
- —
- Monthly cashflow
- —
- DSCR
- —
- Eligible?
- —
Personal DTI + credit; lowest rate.
DSCR
20% down · 8.5% · 30yr
- Down + closing
- —
- Monthly P&I
- —
- Monthly cashflow
- —
- DSCR
- —
- Eligible?
- —
No personal income docs; deal must DSCR.
Hard money
10% down · 12.0% · 12mo
- Down + closing
- —
- Monthly P&I
- —
- Monthly cashflow
- —
- DSCR
- —
- Eligible?
- —
Short-term bridge; refi at stabilization.
Rent comps 4 comps
| Address | Beds | Baths | Sqft | Rent | $/sqft | DOM | Units | Dist |
|---|---|---|---|---|---|---|---|---|
| 505 Prince St Bordentown, NJ | 3.0 | 2.0 | 1678 | $3,800 | $2.26 | 19d | 1 | 0.49mi |
| 151 2nd St Unit 2 Bordentown, NJ | 4.0 | 1.0 | 1300 | $2,150 | $1.65 | 24d | 1 | 0.56mi |
| 14 Landon Dr Bordentown, NJ | 3.0 | 1.5 | 1596 | $2,890 | $1.81 | 20d | 1 | 0.69mi |
| 2 Salisbury Ct Bordentown, NJ | 3.0 | 3.0 | 1526 | $3,195 | $2.09 | 4d | 1 | 0.90mi |
Listing history 3 events
-
2026-05-12status Pending 1753-char remark
-
2026-05-07historical Active Under Contract 1753-char remark
-
2026-04-30$299,000 Active 1753-char remark
ⓘ Source: listings_history table (triggers on properties + properties_extension) + one-shot
backfill from property_details.listing_events for pre-trigger history.
Tax reassessment forecast NJ · Partial reset (capped growth)
- Current annual tax
- $7,424 · $619/mo
- Projected year-2 tax
- $7,435 · $620/mo
- Expected delta
- +$10/yr (+$1/mo · 0.1%)
ⓘ Screening estimate from a state-policy table — verify with the county assessor before closing.
Climate risk First Street
- Flood 1/10 Low FEMA zone X (unshaded) · 0% chance over 30 yrs
- Wildfire 1/10 Low
- Heat 6/10 Major 7 d/yr ≥102°F today · 15 d/yr by 30 yrs out
- Wind 6/10 Major 27% chance of damaging wind over 30 yrs
- Air quality 5/10 Major 6 unhealthy d/yr today · 8 by 30 yrs out
Nearby sold comps map
Loading sold comps map…
Walkable amenities ~0.75 mi
Loading nearby amenities…
Taxation est. · year 1
- Rental income
- $38,454
- − Mortgage interest
- −$16,749
- − Property taxes
- −$7,424
- − Insurance
- −$1,495
- − Repairs & maintenance
- −$3,076
- − Management
- −$3,076
- − Depreciation
- −$8,698
- Taxable loss
- −$2,064
- Est. tax savings @ 24.0%
- +$495
- After-tax cash flow
- $3,139/yr
For passive investors: Depreciation is non-cash, so a rental often shows a tax loss while cash-flowing — sheltering income. Rental losses are passive: they offset passive income freely, and up to $25,000/yr can offset ordinary (W-2) income if you actively participate and your MAGI is under $100k (phasing out to $0 by $150k); unused losses carry forward. On sale, claimed depreciation is recaptured at up to 25%, and gains may owe capital-gains tax (a 1031 exchange can defer both). Figures are a year-1 estimate at your 24.0% rate — not tax advice; consult a CPA.
Schools (NCES district)
- District
- Bordentown Regional School District
- NCES district ID
- 3402030
- Math proficiency
- 29% ▼ -20.00%
- Reading proficiency
- 53% ▬ 0.00%
- Median HH income
- $78,817
- Composite
- 37.98/100
- National rank
- #4295
- State rank
- #206 of 472 in NJ
Livability — Bordentown
- Score
- 77/100
- State rank
- #115
- US rank
- #2907
Category grades
Schools grade is shown separately in the Schools card above.
Census & demographics
- County
- Burlington County · 323,710 people
- Metro
- Philadelphia-Camden-Wilmington, PA-NJ-DE-MD
- Population (ZIP)
- 19,142
- Household income
- $112,845
- Rent vs Own
- Severe rent burden
- 380.0
Population outlook (Burlington County) Hauer SSP2
- Today (2025)
- 453,425 people
- By 2030
- 452,359 · -0.2%
- By 2040
- 445,033 · -1.9%
- By 2050
- 431,760 · -4.8%
- By 2075
- 406,277 · -10.4%
- By 2100
- 364,732 · -19.6%
Race, ethnicity, and origin ACS 2023
- Neighborhood character
- Predominantly White (69%)
- Race & ethnicity
- White 69% Hispanic / Latino 11% Two or more races 11% Black 9% Asian 6%
- Hispanic origin (detail)
- Mexican 1% Puerto Rican 5% Dominican 1%
- Common ancestry
- Romanian 9% Lithuanian 2% Italian 2%
- Foreign-born
- 13% · Canada, Vietnam, China
- Languages at home
- 79% English-only · Other Asian/Pacific 7% Spanish 6% Other Indo-European 2%
Political lean MEDSL · Burlington
- 2024 margin
- D (+16.6) · D 57.6% · R 41.0% · Other 1.3%
- 2008→2024 swing
- -2.0pp toward R · 2008: 18.6pp · 2024: 16.6pp
- All cycles
- 2024: D+16.6 2020: D+19.5 2016: D+14.8 2012: D+18.7 2008: D+18.6
Not yet ingested
- Civics
- —
Market trends
- HPI YoY
- ▼ -129.01%
- Current HPI
- 279.5254
- Rent YoY
- ▲ 6.07%
- Metro
- Philadelphia-Camden-Wilmington, PA-NJ-DE-MD
- State GDP YoY
- ▲ 2.05%
- F500 in state
- 34
Industry mix (Fortune 500 HQ in NJ)
| Industry | F500 HQs | Revenue |
|---|---|---|
| Consumer Goods | 3 | $31B |
|
||
| Pharmaceuticals | 2 | $153B |
|
||
| Technology | 2 | $21B |
|
||
| Insurance | 2 | $20B |
|
||
| Healthcare | 2 | $19B |
|
||
| Financial Services | 1 | $70B |
|
||
Price history
+5.4% since first listed4 events — show timeline
- 2026-06-11 Sold (MLS) $315,000 BRIGHT MLS
- 2026-05-12 Pending — BRIGHT MLS
- 2026-05-07 Contingent — BRIGHT MLS
- 2026-04-30 Listed $299,000 BRIGHT MLS
Property tax history
+2.6%/yrLatest (2025): $7,424 · +3.4% YoY. Source: county tax records.
Cash-flow waterfall
monthlySold comps — $/sqft
last 12 mo · ≤1 miLoading sold comps…