 🏗️ New Construction
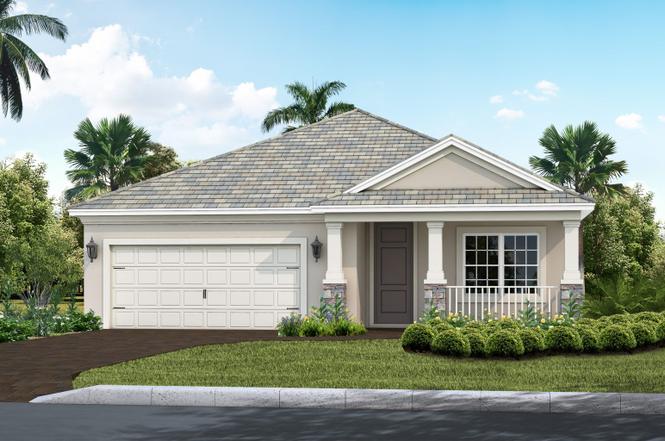
Applause Plan · Verandah, FL
Flood risk No data
- FEMA flood zone
- —
- Chance of flooding over 30 yrs
- —
- Est. flood insurance / yr
- —
Fire risk No data
- Est. fire insurance / yr
- —
Heat risk No data
- Hot days now (above threshold)
- —
- Hot days in 30 yrs
- —
Wind risk No data
- Chance of severe wind over 30 yrs
- —
Air-quality risk No data
- Unhealthy air days now
- —
- Unhealthy air days in 30 yrs
- —
Risk factors via First Street. Map © Google.
Why this score? — see what drove the F grade
The composite is a weighted blend of 9 inputs, each scored 0–100. Each bar is that input's sub-score; the figure is the points it added to the 100-point composite (weight × sub-score).
- ARV discount +7.5/15.0
- Cash flow +4.7/30.0
- Schools +4.1/10.0
- Livability +2.5/5.0
- Condition / age +2.5/5.0
- Rent growth +1.8/5.0
- 1% rule +0.6/10.0
- DSCR +0.0/10.0
- Appreciation +0.0/10.0
$316,990
🖨 Deal sheet 📄 Offer letter ✓ Due diligence
Listing remarks
* Base price does not include the homesite premium or design options. * The Applause is an endearing coastal-inspired design, offering an elegant yet comfortable place to call home. The open main living area includes a kitchen and dining room area, allowing meals to be seamlessly brought from pan to table. The kitchen features an island and walk-in pantry, an ideal stage for the family chef. Sliding glass doors in the great room with optional recessed ceiling open to the covered lanai, where you can relax and enjoy the water or preserve view. The luxurious master bedroom includes a sitting area and, for an additional touch of elegance, optional recessed ceiling. The master suite also holds
Key facts
- Sliding glass doors
- Covered lanai
- Walk in pantry
Tags
Property features AI
Finance
- Financial info: List price $316,990
Exterior
- Parking: 2 covered garage spaces; 2 total parking spaces
- Home design: New construction plan; Single-family property (Plan: Applause)
Interior
- Bedrooms: 3 bedrooms
- Bathrooms: 3 full bathrooms
- Interior features: Open living space (living area approximately 2110); Plan model: Applause
Neighborhood map
What this means for you Summary
Snapshot
- This is a 3-bed/3.0-bath single-family listed at $317k.
Deal economics
- At list price, monthly cash flow is $-1k ($-18k/yr) — negative.
- The deal already cash-flows at list — no discount required.
- Meets the 1% rule at list price ($3k rent vs $317k).
Location & tenants
- Location reads: area grade F — affects rentability + tenant quality, not the cash-flow math above.
- Lee (suburban): math 47% / reading 50% proficiency, ranked #42 of 73 in FL (top 58%) — families likely to look elsewhere, expect single-tenant / working-renter base with shorter leases.
- Market conditions: Rents soft (-3.0%/yr); 763 active listings in the ZIP; 14 comparable units currently listed for rent nearby; rentals at typical pace (median 24d on market — plan ~3-4 weeks tenant-placement turnaround); 15,411 units permitted in Lee County in 2024 (4,686 in 5+ unit buildings).
- At $3,327/mo this rent would consume 55% of the median local household income ($72k/yr) (locally 1358% of renters already pay >50% of income on rent) — very limited rent-growth headroom before tenants either downsize or default.
Forward outlook
- Local home prices are declining (-3.0%/yr); year-one equity from $4k of loan paydown is wiped out by about $18k of value loss. Plan a longer hold.
- Lee County population projected at +44% by 2050 — long-run rental-demand tailwind backs the buy-and-hold thesis.
Negotiation context
- Only 8 days on market — expect competitive offers; lowballing is unlikely to land.
Risks & watch-outs
- Watch-outs: property tax is 2.8% of price.
Questions for the listing agent
- What do current leases actually rent for vs. the listed asking? Can we see a recent rent roll and the last 12 months of T-12 income?
- Property tax is high relative to price — has the assessment been appealed recently, and will the sale trigger a re-assessment?
- Is there a deadline driving the sale (1031 exchange, divorce, estate, relocation)? That informs how much negotiation room exists.
- The area grade is low — what's the realistic commute time and amenity access for the typical tenant pool here? Any planned neighborhood developments (good or bad) we should know about?
- What's the average days-on-market for RENTAL listings here right now (not sales)? A rising rental-DOM trend means longer vacancies and softer asking-rent achievability than the comps imply.
- What's the recent tenant-quality profile in this submarket — average credit score on applications, eviction rate, late-payment / NSF rate, and stable-employment percentage? A property-management company in the area should have these aggregated.
- How much new for-sale + rental construction is in the pipeline within 1–3 miles? Heavy new supply typically softens prices + rents 12–24 months out; constrained supply supports both.
Investment metrics
- 1% rule
- 0.56% ✗
- Cap rate
- 3.28%
- Cash-on-cash
- -10.75%
- DSCR
- 0.52
- GRM
- 15.0
CMA / ARV
- ARV (on-the-fly)
- $597,130
- Comps found
- 1
Show comp detail 1 sale within ~0.75 mi
| Address | Dist | Beds/Ba | Sqft | Sold | Price | $/sf | Match |
|---|---|---|---|---|---|---|---|
| 3300 Shady Bnd | 0.59mi | 3/2.0 | 1,993 (-6%) | 9mo | $565,000 | $283 | 51 |
Match score weights: distance 35% · size 25% · config 20% · recency 20%. Top-matched comps best support the ARV.
Projected returns pro-forma
-3.0% appreciation · 0.0% rent growth · sell at horizon
- IRR
- -39.1%
- Equity multiple
- -0.21×
- Total profit
- $-201,895
- Equity at exit
- $89,034
- IRR
- -82.8%
- Equity multiple
- -1.01×
- Total profit
- $-336,169
- Equity at exit
- $51,629
Cash invested: $167,196 (down + closing). Projections, not guarantees.
Landlord ↔ Tenant lean methodology
- Overall (STATE)
- 87 Strongly Landlord-Friendly
- State Florida
- 87 Strongly Landlord-Friendly · R+3
- County
- — inherits STATE
- City
- — inherits STATE
ZIP-level market 33905
- Home prices YoY
- -31.4%
- Rents YoY
- -3.0%
- Active inventory
- 763
- Price-to-rent
- 7.9×
Monthly cashflow live
- Estimated rent
- $3,327 high interval (Pro) →
- Mortgage (P&I)
- −$3,131
- Tax est. 1.5%
- −$746 /mo · $8,957/yr
- Insurance
- −$249
- HOA
- −$0
- Vacancy / Maint / Mgmt
- −$699
- Net cashflow
- $-1,498
Break-even live
UW: 25.0% down · 7.5% · 30yr · 1.5% tax · 5.0% vac · 8.0% maint · 8.0% mgmt
Financing live
Cash to close
- Down payment
- $149,282
- Closing costs
- $17,914
- Reserves months
- —
- Total cash needed
- —
Loan-product check · same deal, 3 products live
Conventional
25% down · 7.5% · 30yr
- Down + closing
- —
- Monthly P&I
- —
- Monthly cashflow
- —
- DSCR
- —
- Eligible?
- —
Personal DTI + credit; lowest rate.
DSCR
20% down · 8.5% · 30yr
- Down + closing
- —
- Monthly P&I
- —
- Monthly cashflow
- —
- DSCR
- —
- Eligible?
- —
No personal income docs; deal must DSCR.
Hard money
10% down · 12.0% · 12mo
- Down + closing
- —
- Monthly P&I
- —
- Monthly cashflow
- —
- DSCR
- —
- Eligible?
- —
Short-term bridge; refi at stabilization.
Rent comps 14 comps
| Address | Beds | Baths | Sqft | Rent | $/sqft | DOM | Units | Dist |
|---|---|---|---|---|---|---|---|---|
| 3100 Cottonwood Bnd #1901 Fort Myers, FL | 3.0 | 2.5 | 1821 | $2,500 | $1.37 | 23d | 1 | 0.06mi |
| 3111 Cottonwood Bnd #1704 Fort Myers, FL | 3.0 | 2.5 | 1833 | $3,000 | $1.64 | 23d | 1 | 0.09mi |
| 3240 Cottonwood Bnd #201 Fort Myers, FL | 3.0 | 2.5 | 1821 | $5,500 | $3.02 | 23d | 1 | 0.14mi |
| 3211 Cottonwood Bnd #701 Fort Myers, FL | 3.0 | 3.0 | 1821 | $2,500 | $1.37 | 23d | 1 | 0.18mi |
| 3211 Cottonwood Bnd #705 Fort Myers, FL | 3.0 | 2.5 | 1867 | $3,000 | $1.61 | 23d | 1 | 0.18mi |
| 3181 Cottonwood Bnd #901 Fort Myers, FL | 3.0 | 2.5 | 1821 | $5,500 | $3.02 | 23d | 1 | 0.19mi |
| 3210 Cottonwood Bnd #803 Fort Myers, FL | 3.0 | 2.5 | 1867 | $5,000 | $2.68 | 3d | 1 | 0.21mi |
| 3111 Meandering Way #101 Fort Myers, FL | 2.0 | 2.0 | 1421 | $2,700 | $1.90 | 23d | 1 | 0.58mi |
| 3120 Meandering Way #202 Fort Myers, FL | 3.0 | 2.0 | 1690 | $3,000 | $1.78 | 23d | 1 | 0.61mi |
| 3071 Meandering Way #101 Fort Myers, FL | 2.0 | 2.0 | 1421 | $3,000 | $2.11 | 23d | 1 | 0.61mi |
| 3131 Orangetree Bnd Fort Myers, FL | 3.0 | 3.0 | 1842 | $7,000 | $3.80 | 23d | 1 | 0.92mi |
| 12639 5th St Fort Myers, FL | 4.0 | 2.0 | 1533 | $1,900 | $1.24 | 23d | 1 | 1.29mi |
| 2804 River Ridge Blvd Fort Myers, FL | 2.0 | 2.0 | 1404 | $1,350 | $0.96 | 23d | 1 | 1.44mi |
| 3721 Pebblebrook Ridge Ct #102 Fort Myers, FL | 2.0 | 2.0 | 1532 | $2,950 | $1.93 | 23d | 1 | 1.49mi |
Listing history 5 events
-
2026-06-17days on market $316,990 Active 8 DOM
-
2026-06-16days on market $316,990 Active 7 DOM
-
2026-06-16days on market $316,990 Active 6 DOM
-
2026-06-13remarks 699-char remark
-
2026-06-13$316,990 Active 4 DOM
ⓘ Source: listings_history table (triggers on properties + properties_extension) + one-shot
backfill from property_details.listing_events for pre-trigger history.
Nearby sold comps map
Loading sold comps map…
Walkable amenities ~0.75 mi
Loading nearby amenities…
Taxation est. · year 1
- Rental income
- $39,922
- − Mortgage interest
- −$33,449
- − Property taxes
- −$8,957
- − Insurance
- −$2,986
- − Repairs & maintenance
- −$3,194
- − Management
- −$3,194
- − Depreciation
- −$17,371
- Taxable loss
- −$29,227
- Est. tax savings @ 24.0%
- +$7,015
- After-tax cash flow
- $-10,966/yr
For passive investors: Depreciation is non-cash, so a rental often shows a tax loss while cash-flowing — sheltering income. Rental losses are passive: they offset passive income freely, and up to $25,000/yr can offset ordinary (W-2) income if you actively participate and your MAGI is under $100k (phasing out to $0 by $150k); unused losses carry forward. On sale, claimed depreciation is recaptured at up to 25%, and gains may owe capital-gains tax (a 1031 exchange can defer both). Figures are a year-1 estimate at your 24.0% rate — not tax advice; consult a CPA.
Schools (NCES district)
- District
- Lee
- NCES district ID
- 1201080
- Math proficiency
- 47% ▼ -11.00%
- Reading proficiency
- 50% ▼ -4.00%
- Median HH income
- $49,518
- Composite
- 41.49/100
- National rank
- #3458
- State rank
- #42 of 73 in FL
Livability — Verandah
No livability data for this city. (Only ~50 U.S. cities are tracked.)
Census & demographics
- Census place
- Verandah, FL
- County
- Lee County · 788,662 people
- Metro
- Cape Coral-Fort Myers, FL
- Population (ZIP)
- 41,381
- Household income
- $71,987
- Rent vs Own
- Severe rent burden
- 1358.0
Population outlook (Lee County) Hauer SSP2
- Today (2025)
- 871,946 people
- By 2030
- 955,468 · +9.6%
- By 2040
- 1,113,587 · +27.7%
- By 2050
- 1,256,891 · +44.1%
- By 2075
- 1,560,270 · +78.9%
- By 2100
- 1,726,848 · +98.0%
Race, ethnicity, and origin ACS 2023
- Neighborhood character
- Diverse neighborhood (Simpson 0.59)
- Race & ethnicity
- White 53% Hispanic / Latino 34% Two or more races 17% Black 9% Native American 4% Asian 2%
- Hispanic origin (detail)
- Mexican 11% Puerto Rican 5% Cuban 2%
- Common ancestry
- Romanian 2% Slovak 2% Lithuanian 2%
- Foreign-born
- 20% · Canada, Jamaica
- Languages at home
- 68% English-only · Spanish 29% Other Indo-European 1% German/W. Germanic 1%
Political lean MEDSL · Lee
- 2024 margin
- Strong R (+28.4) · D 35.5% · R 63.9%
- 2008→2024 swing
- -18.0pp toward R · 2008: -10.4pp · 2024: -28.4pp
- All cycles
- 2024: R+28.4 2020: R+19.2 2016: R+20.4 2012: R+16.6 2008: R+10.4
Not yet ingested
- Civics
- —
Market trends
- HPI YoY
- ▼ -122.89%
- Current HPI
- 268.4598
- Rent YoY
- ▼ -2.97%
- Metro
- Cape Coral-Fort Myers, FL
- State GDP YoY
- ▲ 3.28%
- F500 in state
- 36
Industry mix (Fortune 500 HQ in FL)
| Industry | F500 HQs | Revenue |
|---|---|---|
| Industrial Technology | 2 | $29B |
|
||
| Insurance | 2 | $17B |
|
||
| Retail | 1 | $60B |
|
||
| Technology Distribution | 1 | $58B |
|
||
| Homebuilding | 1 | $35B |
|
||
| Technology Manufacturing | 1 | $35B |
|
||
Cash-flow waterfall
monthlySold comps — $/sqft
last 12 mo · ≤1 miLoading sold comps…