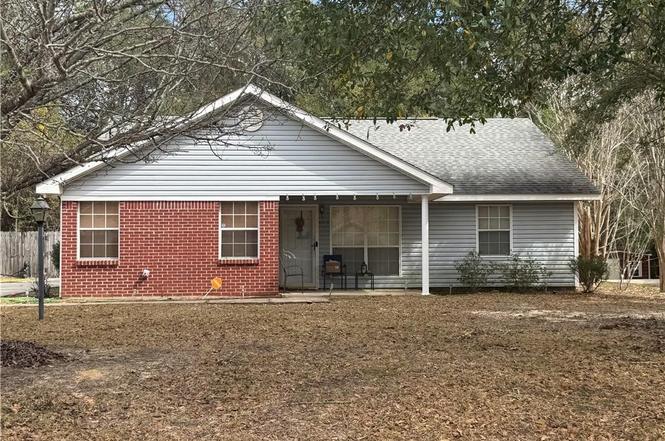
4715 Augusta Dr · Prichard, AL
Flood risk 1/10 · Minimal
- FEMA flood zone
- X (unshaded)
- Chance of flooding over 30 yrs
- 0.0%
- Est. flood insurance / yr
- $507 – $1,088
Fire risk 5/10 · Moderate
- Est. fire insurance / yr
- $916 – $1,700
Heat risk 9/10 · Severe
- Hot days now (above 104°F)
- 7 days/yr
- Hot days in 30 yrs
- 21 days/yr
Wind risk 9/10 · Severe
- Chance of severe wind over 30 yrs
- 99.0%
Air-quality risk 1/10 · Minimal
- Unhealthy air days now
- 0 days/yr
- Unhealthy air days in 30 yrs
- 0 days/yr
Risk factors via First Street. Map © Google.
Why this score? — see what drove the B- grade
The composite is a weighted blend of 9 inputs, each scored 0–100. Each bar is that input's sub-score; the figure is the points it added to the 100-point composite (weight × sub-score).
- Cash flow +26.1/30.0
- ARV discount +15.0/15.0
- DSCR +8.8/10.0
- 1% rule +5.7/10.0
- Livability +2.7/5.0
- Rent growth +2.5/5.0
- Condition / age +2.5/5.0
- Schools +2.3/10.0
- Appreciation +0.0/10.0
$149,900
🖨 Deal sheet (PDF) 📄 Offer letter ✓ Due diligence
Listing remarks
Welcome to 4713 Augusta Dr. This home has a fenced in back yard - great for the fur babies and kids! There is a spacious covered front porch that would be lovely during the spring and fall months! Situated in a well established neighborhood. Call your favorite Realtor today to schedule a private showing!
Key facts
- Covered front porch
- Fenced in back yard
- 0.3 acre lot
Tags
Neighborhood map
What this means for you Summary
Snapshot
- This is a 3-bed/2.0-bath single-family listed at $150k.
Deal economics
- At list price, monthly cash flow is $379 ($5k/yr) — positive.
- The deal already cash-flows at list — no discount required.
- Meets the 1% rule at list price ($2k rent vs $150k).
Location & tenants
- Location reads 54/100 on livability (#472 in AL) — a working-class tenant base; expect higher turnover. Strengths: cost of living A+, housing A; Watch: crime F, amenities F, commute F.
- Mobile County (urban): math 15% / reading 39% proficiency, ranked #81 of 129 in AL (top 63%) — low school quality limits family demand, transient renter base, plan for 1-2y turnover; 67% free/reduced lunch — lower-income household profile, screen leases tightly.
- Zoned schools: Indian Springs Elementary School (math 12% / reading 27%, grade F, #467 of 627 statewide, top 76%, 368 students, 75% FRL); Chastangfournier Middle School (math 0% / reading 15%, grade F, #598 of 627 statewide, top 96%, 551 students, 96% FRL); Mattie T Blount High School (math 2% / reading 3%, grade F, #291 of 305 statewide, top 100%, 1,176 students, 86% FRL) — zoned schools average 86% FRL vs 67% district-wide (18 pts higher); higher-poverty schools than district average — tighter screening recommended.
- Zoned-school proficiency averages 10% at this address vs 27% district-wide (-17 pts) — the specific schools serving this property underperform the Mobile County average; the district grade overstates school quality for this exact location.
- Market conditions: 93 active listings in the ZIP; 1,678 units permitted in Mobile County in 2024 (264 in 5+ unit buildings).
Forward outlook
- Local home prices are declining (-3.0%/yr); year-one equity from $1k of loan paydown is wiped out by about $4k of value loss. Plan a longer hold.
- Mobile County population projected to shrink 8% by 2050 — rents likely to lag national; underwrite the cash flow, not the appreciation.
Negotiation context
- Only 7 days on market — expect competitive offers; lowballing is unlikely to land.
Risks & watch-outs
- Climate carrying-cost: severe wind risk, 99% chance of damaging wind over 30y; moderate wildfire risk; extreme-heat days projected 7→21/yr by 2055 (HVAC capex compounding) — expect insurance premiums to compound above CPI over the hold.
Questions for the listing agent
- Is there a deadline driving the sale (1031 exchange, divorce, estate, relocation)? That informs how much negotiation room exists.
- Schools are D-rated, which usually means shorter tenancies and higher turnover. Who's the typical renter profile here, and what's been the actual vacancy rate?
- Crime grade is F in this area — have there been break-ins, vandalism, or insurance claims at this property in the last 3 years? What carrier currently insures it and at what premium?
- What's the average days-on-market for RENTAL listings here right now (not sales)? A rising rental-DOM trend means longer vacancies and softer asking-rent achievability than the comps imply.
- What's the recent tenant-quality profile in this submarket — average credit score on applications, eviction rate, late-payment / NSF rate, and stable-employment percentage? A property-management company in the area should have these aggregated.
- How much new for-sale + rental construction is in the pipeline within 1–3 miles? Heavy new supply typically softens prices + rents 12–24 months out; constrained supply supports both.
Investment metrics
- 1% rule
- 1.07% ✓
- Cap rate
- 9.33%
- Cash-on-cash
- 10.83%
- DSCR
- 1.48
- GRM
- 7.8
CMA / ARV
- ARV (on-the-fly)
- $185,724
- Comps found
- 5
Show comp detail 5 sales within ~0.75 mi
| Address | Dist | Beds/Ba | Sqft | Sold | Price | $/sf | Match |
|---|---|---|---|---|---|---|---|
| 4512 Senator St | 0.08mi | 3/2.0 | 1,488 (+1%) | 10mo | $180,000 | $121 | 86 |
| 3611 Pinewood Dr | 0.54mi | 3/2.0 | 1,396 (-5%) | 6mo | $184,900 | $132 | 61 |
| 4527 Brunswick Dr | 0.54mi | 4/2.0 (+1) | 1,575 (+7%) | 1mo | $199,000 | $126 | 58 |
| 4411 Glen Eagle Ct | 0.73mi | 3/2.0 | 1,508 (+2%) | 13mo | $190,000 | $126 | 52 |
| 3414 Lott Rd | 0.36mi | 3/1.5 | 1,275 (-14%) | 20mo | $62,000 | $49 | 42 |
Match score weights: distance 35% · size 25% · config 20% · recency 20%. Top-matched comps best support the ARV.
Projected returns pro-forma
-3.0% appreciation · 3.0% rent growth · sell at horizon
- IRR
- -0.1%
- Equity multiple
- 0.99×
- Total profit
- $-227
- Equity at exit
- $22,351
- IRR
- 9.5%
- Equity multiple
- 1.73×
- Total profit
- $30,607
- Equity at exit
- $12,961
Cash invested: $41,972 (down + closing). Projections, not guarantees.
Landlord ↔ Tenant lean methodology
- Overall (STATE)
- 90 Strongly Landlord-Friendly
- State Alabama
- 90 Strongly Landlord-Friendly · R+15
- County
- — inherits STATE
- City
- — inherits STATE
ZIP-level market 36613
- Home prices YoY
- -23.9%
- Active inventory
- 93
- Price-to-rent
- 7.8×
Monthly cashflow live
- Estimated rent
- $1,607 medium interval (Pro) →
- Mortgage (P&I)
- −$786
- Tax from tax record
- −$42 /mo · $504/yr
- Insurance
- −$62
- HOA
- −$0
- Vacancy / Maint / Mgmt
- −$337
- Net cashflow
- $379
Break-even live
Sensitivity live
| Price | -10% $464 | -5% $421 | +0% $379 | +5% $336 | +10% $294 |
|---|---|---|---|---|---|
| Rent | -10% $252 | -5% $315 | +0% $379 | +5% $442 | +10% $506 |
| Rate | -1.0pp $454 | -0.5pp $417 | base $379 | +0.5pp $340 | +1.0pp $300 |
UW: 25.0% down · 7.5% · 30yr · 1.5% tax · 5.0% vac · 8.0% maint · 8.0% mgmt
Financing live
Cash to close
- Down payment
- $37,475
- Closing costs
- $4,497
- Reserves months
- —
- Total cash needed
- —
Loan-product check · same deal, 3 products live
Conventional
25% down · 7.5% · 30yr
- Down + closing
- —
- Monthly P&I
- —
- Monthly cashflow
- —
- DSCR
- —
- Eligible?
- —
Personal DTI + credit; lowest rate.
DSCR
20% down · 8.5% · 30yr
- Down + closing
- —
- Monthly P&I
- —
- Monthly cashflow
- —
- DSCR
- —
- Eligible?
- —
No personal income docs; deal must DSCR.
Hard money
10% down · 12.0% · 12mo
- Down + closing
- —
- Monthly P&I
- —
- Monthly cashflow
- —
- DSCR
- —
- Eligible?
- —
Short-term bridge; refi at stabilization.
Listing history 2 events
-
2026-03-11status Pending
-
2026-03-04$149,900 Active
ⓘ Source: listings_history table (triggers on properties + properties_extension) + one-shot
backfill from property_details.listing_events for pre-trigger history.
Tax reassessment forecast AL · Resets to sale price
- Current annual tax
- $504 · $42/mo
- Projected year-2 tax
- $615 · $51/mo
- Expected delta
- +$111/yr (+$9/mo · 22.0%)
ⓘ Screening estimate from a state-policy table — verify with the county assessor before closing.
Climate risk First Street
- Flood 1/10 Low FEMA zone X (unshaded) · 0% chance over 30 yrs
- Wildfire 5/10 Major
- Heat 9/10 Extreme 7 d/yr ≥104°F today · 21 d/yr by 30 yrs out
- Wind 9/10 Extreme 99% chance of damaging wind over 30 yrs
- Air quality 1/10 Low 0 unhealthy d/yr today · 0 by 30 yrs out
Nearby sold comps map
Loading sold comps map…
Walkable amenities ~0.75 mi
Loading nearby amenities…
Taxation est. · year 1
- Rental income
- $19,281
- − Mortgage interest
- −$8,397
- − Property taxes
- −$504
- − Insurance
- −$750
- − Repairs & maintenance
- −$1,543
- − Management
- −$1,543
- − Depreciation
- −$4,361
- Taxable income
- $2,186
- Est. tax owed @ 24.0%
- −$525
- After-tax cash flow
- $4,021/yr
For passive investors: Depreciation is non-cash, so a rental often shows a tax loss while cash-flowing — sheltering income. Rental losses are passive: they offset passive income freely, and up to $25,000/yr can offset ordinary (W-2) income if you actively participate and your MAGI is under $100k (phasing out to $0 by $150k); unused losses carry forward. On sale, claimed depreciation is recaptured at up to 25%, and gains may owe capital-gains tax (a 1031 exchange can defer both). Figures are a year-1 estimate at your 24.0% rate — not tax advice; consult a CPA.
Schools (NCES district)
- District
- Mobile County
- NCES district ID
- 0102370
- Math proficiency
- 15% ▼ -28.00%
- Reading proficiency
- 39% ▬ 0.00%
- Median HH income
- $42,455
- Composite
- 22.9/100
- National rank
- #8002
- State rank
- #81 of 129 in AL
Livability — Prichard
- Score
- 54/100
- State rank
- #472
- US rank
- #24080
Category grades
Schools grade is shown separately in the Schools card above.
Census & demographics
- Census place
- Prichard, AL
- City population
- 13,402
- Population (ZIP)
- 12,082
Population outlook (Mobile County) Hauer SSP2
- Today (2025)
- 415,303 people
- By 2030
- 411,755 · -0.9%
- By 2040
- 399,670 · -3.8%
- By 2050
- 382,616 · -7.9%
- By 2075
- 337,353 · -18.8%
- By 2100
- 283,391 · -31.8%
Race, ethnicity, and origin ACS 2023
- Neighborhood character
- Majority Black (52%)
- Race & ethnicity
- Black 52% White 44% Two or more races 3% Hispanic / Latino 2%
- Common ancestry
- Lithuanian 2% Italian 2% Slovak 2%
- Foreign-born
- 0%
- Languages at home
- 99% English-only · Spanish 1%
Political lean MEDSL · Mobile
- 2024 margin
- R (+16.4) · D 41.3% · R 57.7%
- 2008→2024 swing
- -7.7pp toward R · 2008: -8.7pp · 2024: -16.4pp
- All cycles
- 2024: R+16.4 2020: R+11.9 2016: R+13.9 2012: R+9.3 2008: R+8.7
Not yet ingested
- Civics
- —
Market trends
- HPI YoY
- ▼ -65.49%
- Current HPI
- 208.8677
- Rent YoY
- —
- Metro
- —
- State GDP YoY
- ▲ 2.94%
- F500 in state
- 4
Industry mix (Fortune 500 HQ in AL)
| Industry | F500 HQs | Revenue |
|---|---|---|
| Financial Services | 1 | $8B |
|
||
| Healthcare | 1 | $5B |
|
||
Price history
2 events — show timeline
- 2026-03-11 Pending — GCMLS AL
- 2026-03-04 Listed $149,900 GCMLS AL
Property tax history
+0.6%/yrLatest (2025): $504 · -31.6% YoY. Source: county tax records.
Cash-flow waterfall
monthlySold comps — $/sqft
last 12 mo · ≤1 miLoading sold comps…