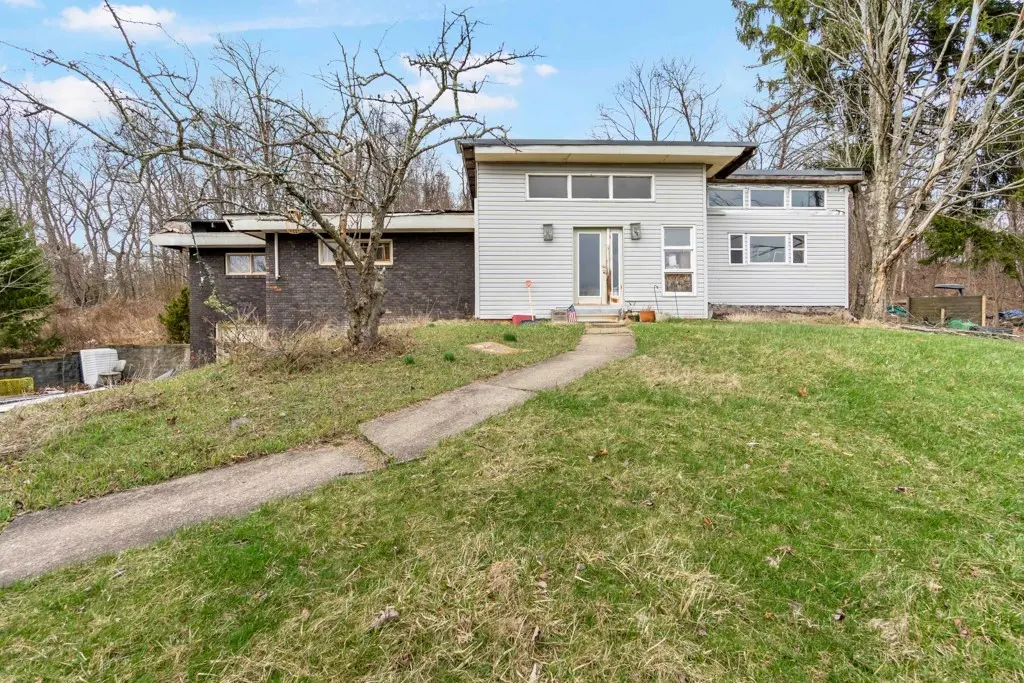
465 Amsler Ridge Rd · Economy, PA
Flood risk 1/10 · Minimal
- FEMA flood zone
- X (unshaded)
- Chance of flooding over 30 yrs
- 0.0%
- Est. flood insurance / yr
- $473 – $860
Fire risk 1/10 · Minimal
- Est. fire insurance / yr
- $511 – $949
Heat risk 3/10 · Minor
- Hot days now (above 97°F)
- 7 days/yr
- Hot days in 30 yrs
- 17 days/yr
Wind risk 2/10 · Minimal
- Chance of severe wind over 30 yrs
- —
Air-quality risk 3/10 · Minor
- Unhealthy air days now
- 2 days/yr
- Unhealthy air days in 30 yrs
- 3 days/yr
Risk factors via First Street. Map © Google.
Why this score? — see what drove the B- grade
The composite is a weighted blend of 9 inputs, each scored 0–100. Each bar is that input's sub-score; the figure is the points it added to the 100-point composite (weight × sub-score).
- Cash flow +30.0/30.0
- 1% rule +10.0/10.0
- DSCR +10.0/10.0
- ARV discount +7.5/15.0
- Livability +3.5/5.0
- Schools +3.1/10.0
- Rent growth +2.5/5.0
- Condition / age +2.5/5.0
- Appreciation +0.0/10.0
$150,000
🖨 Deal sheet (PDF) 📄 Offer letter ✓ Due diligence
Listing remarks MLS
Discover the Endless Potential of 465 Amsler Ridge! Are you looking for the perfect place to bring your vision to life? Nestled on a sprawling, 1.5-acre lot, this property offers the rare gift of space and serenity. Whether you are a visionary ready to take on a rewarding renovation project or looking for the ultimate site to start fresh and build your custom architectural masterpiece, this location is the ideal foundation. Imagine waking up to the tranquil sounds of nature in this remarkably peaceful setting, all while being just minutes away from the conveniences you love. From a complete top-to-bottom remodel of the current structure to a brand-new build designed exactly to your specifications, the possibilities here are as vast as the land itself.
Key facts
- Sprawling space
- 1.5-acre lot
- 1.63 acre lot
Tags
Neighborhood map
What this means for you Summary
Snapshot
- This is a 3-bed/1.0-bath single-family listed at $150k.
Deal economics
- At list price, monthly cash flow is $851 ($10k/yr) — positive.
- The deal already cash-flows at list — no discount required.
- Meets the 1% rule at list price ($2k rent vs $150k).
- Recommended offer: $141k (6.0% below list) — sets the bar for market timing.
- Cap rate 13.1% vs local median 2.8% in Economy — top-decile yield for the area; either an underpriced asset or a hidden risk that comps aren't pricing in. Stress-test before assuming the spread holds.
Location & tenants
- Location reads 69/100 on livability (#855 in PA) — a middle-class / working-renter tenant base. Strengths: crime A+, employment A+, cost of living A+; Watch: amenities F, commute F, health & safety F.
- Ambridge Area SD (suburban): math 23% / reading 48% proficiency, ranked #408 of 539 in PA (top 76%) — families likely to look elsewhere, expect single-tenant / working-renter base with shorter leases.
- Zoned schools: Economy El Sch (math 47% / reading 77%, grade B, #313 of 1,518 statewide, top 24%, 447 students, 100% FRL); Ambridge Area Ms (math 13% / reading 45%, grade F, #391 of 512 statewide, top 77%, 467 students, 99% FRL); Ambridge Area Hs (math 42% / reading 24%, grade F, #325 of 437 statewide, top 75%, 733 students, 92% FRL) — zoned schools average 97% FRL vs 43% district-wide (54 pts higher); higher-poverty schools than district average — tighter screening recommended.
- Market conditions: 138 active listings in the ZIP; high-income renter base; 272 units permitted in Beaver County in 2024 (80 in 5+ unit buildings).
Forward outlook
- Local home prices are declining (-3.0%/yr); year-one equity from $1k of loan paydown is wiped out by about $4k of value loss. Plan a longer hold.
- Beaver County population projected at -14% by 2050 — secular population decline; favor cash flow + early exit over multi-decade hold.
- At projected returns (-3.0% appreciation + 3.0% rent growth), your $42k cash investment doubles in ~5 years — after that, you're playing with house money.
Negotiation context
- It's been on market 87 days — a 6% lower offer ($141k) is reasonable based on typical stale-listing flexibility.
- Current owner paid $96k; list at $150k implies a 56% gain — meaningful room to come down on a strong offer.
Questions for the listing agent
- It's been on market 87 days. Have you received any prior offers? Is the seller open to a 6% concession, seller financing, or rate buy-down credit?
- Built in 1967 — when were the roof, HVAC, electrical panel, plumbing, and water heater last replaced?
- Why hasn't it sold? Are there any deal-killer items the seller is aware of (foundation, flood, title, zoning, code violations)?
- Is there a deadline driving the sale (1031 exchange, divorce, estate, relocation)? That informs how much negotiation room exists.
- Schools are D-rated, which usually means shorter tenancies and higher turnover. Who's the typical renter profile here, and what's been the actual vacancy rate?
- What's the average days-on-market for RENTAL listings here right now (not sales)? A rising rental-DOM trend means longer vacancies and softer asking-rent achievability than the comps imply.
- What's the recent tenant-quality profile in this submarket — average credit score on applications, eviction rate, late-payment / NSF rate, and stable-employment percentage? A property-management company in the area should have these aggregated.
- How much new for-sale + rental construction is in the pipeline within 1–3 miles? Heavy new supply typically softens prices + rents 12–24 months out; constrained supply supports both.
Investment metrics
- 1% rule
- 1.59% ✓
- Cap rate
- 13.10%
- Cash-on-cash
- 24.32%
- DSCR
- 2.08
- GRM
- 5.2
CMA / ARV
- ARV (median comp)
- $865,644
- List price
- $150,000
- Delta
- -82.67%
- Verdict
- UNDERPRICED
- Comps
- 10 within 2.0 mi
Projected returns pro-forma
-3.0% appreciation · 3.0% rent growth · sell at horizon
- IRR
- 17.6%
- Equity multiple
- 1.71×
- Total profit
- $29,948
- Equity at exit
- $22,365
- IRR
- 26.1%
- Equity multiple
- 3.29×
- Total profit
- $96,039
- Equity at exit
- $12,969
Cash invested: $42,000 (down + closing). Projections, not guarantees.
Landlord ↔ Tenant lean methodology
- Overall (STATE)
- 62 Landlord-Friendly
- State Pennsylvania
- 62 Landlord-Friendly · EVEN
- County
- — inherits STATE
- City
- — inherits STATE
ZIP-level market 15143
- Active inventory
- 138
- Price-to-rent
- 5.2×
Monthly cashflow live
- Estimated rent
- $2,390 medium interval (Pro) →
- Mortgage (P&I)
- −$787
- Tax est. 1.5%
- −$188 /mo · $2,250/yr
- Insurance
- −$62
- HOA
- −$0
- Vacancy / Maint / Mgmt
- −$502
- Net cashflow
- $851
Break-even live
Sensitivity live
| Price | -10% $955 | -5% $903 | +0% $851 | +5% $799 | +10% $748 |
|---|---|---|---|---|---|
| Rent | -10% $662 | -5% $757 | +0% $851 | +5% $946 | +10% $1,040 |
| Rate | -1.0pp $927 | -0.5pp $889 | base $851 | +0.5pp $812 | +1.0pp $773 |
UW: 25.0% down · 7.5% · 30yr · 1.5% tax · 5.0% vac · 8.0% maint · 8.0% mgmt
Financing live
Cash to close
- Down payment
- $37,500
- Closing costs
- $4,500
- Reserves months
- —
- Total cash needed
- —
Loan-product check · same deal, 3 products live
Conventional
25% down · 7.5% · 30yr
- Down + closing
- —
- Monthly P&I
- —
- Monthly cashflow
- —
- DSCR
- —
- Eligible?
- —
Personal DTI + credit; lowest rate.
DSCR
20% down · 8.5% · 30yr
- Down + closing
- —
- Monthly P&I
- —
- Monthly cashflow
- —
- DSCR
- —
- Eligible?
- —
No personal income docs; deal must DSCR.
Hard money
10% down · 12.0% · 12mo
- Down + closing
- —
- Monthly P&I
- —
- Monthly cashflow
- —
- DSCR
- —
- Eligible?
- —
Short-term bridge; refi at stabilization.
Listing history 19 events
-
2026-06-21days on market $150,000 Active 87 DOM
-
2026-06-18days on market $150,000 Active 84 DOM
-
2026-06-17days on market $150,000 Active 83 DOM
-
2026-06-16days on market $150,000 Active 82 DOM
-
2026-06-15days on market $150,000 Active 81 DOM
-
2026-06-13days on market $150,000 Active 79 DOM
-
2026-06-13days on market $150,000 Active 78 DOM
-
2026-06-09days on market $150,000 Active 75 DOM
-
2026-06-08days on market $150,000 Active 74 DOM
-
2026-06-07days on market $150,000 Active 73 DOM
-
2026-06-03days on market $150,000 Active 69 DOM
-
2026-06-02days on market $150,000 Active 68 DOM
-
2026-06-01days on market $150,000 Active 67 DOM
-
2026-05-31days on market $150,000 Active 66 DOM
-
2026-03-26$150,000 Active 761-char remark
Show marketing remark (761 chars)
Discover the Endless Potential of 465 Amsler Ridge! Are you looking for the perfect place to bring your vision to life? Nestled on a sprawling, 1.5-acre lot, this property offers the rare gift of space and serenity. Whether you are a visionary ready to take on a rewarding renovation project or looking for the ultimate site to start fresh and build your custom architectural masterpiece, this location is the ideal foundation. Imagine waking up to the tranquil sounds of nature in this remarkably peaceful setting, all while being just minutes away from the conveniences you love. From a complete top-to-bottom remodel of the current structure to a brand-new build designed exactly to your specifications, the possibilities here are as vast as the land itself.
-
1989-09-26soldstatus $96,000
-
1982-01-29soldstatus $50,000
-
1980-10-01soldstatus $61,600
-
1977-10-01soldstatus $67,500
ⓘ Source: listings_history table (triggers on properties + properties_extension) + one-shot
backfill from property_details.listing_events for pre-trigger history.
Climate risk First Street
- Flood 1/10 Low FEMA zone X (unshaded) · 0% chance over 30 yrs
- Wildfire 1/10 Low
- Heat 3/10 Moderate 7 d/yr ≥97°F today · 17 d/yr by 30 yrs out
- Wind 2/10 Low
- Air quality 3/10 Moderate 2 unhealthy d/yr today · 3 by 30 yrs out
Nearby sold comps map
Loading sold comps map…
Walkable amenities ~0.75 mi
Loading nearby amenities…
Taxation est. · year 1
- Rental income
- $28,677
- − Mortgage interest
- −$8,402
- − Property taxes
- −$2,250
- − Insurance
- −$750
- − Repairs & maintenance
- −$2,294
- − Management
- −$2,294
- − Depreciation
- −$4,364
- Taxable income
- $8,323
- Est. tax owed @ 24.0%
- −$1,997
- After-tax cash flow
- $8,218/yr
For passive investors: Depreciation is non-cash, so a rental often shows a tax loss while cash-flowing — sheltering income. Rental losses are passive: they offset passive income freely, and up to $25,000/yr can offset ordinary (W-2) income if you actively participate and your MAGI is under $100k (phasing out to $0 by $150k); unused losses carry forward. On sale, claimed depreciation is recaptured at up to 25%, and gains may owe capital-gains tax (a 1031 exchange can defer both). Figures are a year-1 estimate at your 24.0% rate — not tax advice; consult a CPA.
Schools (NCES district)
- District
- Ambridge Area SD
- NCES district ID
- 4202440
- Math proficiency
- 23% ▼ -12.00%
- Reading proficiency
- 48% ▼ -10.00%
- Median HH income
- $49,514
- Composite
- 30.62/100
- National rank
- #6190
- State rank
- #408 of 539 in PA
Livability — Economy
- Score
- 69/100
- State rank
- #855
- US rank
- #8973
Category grades
Schools grade is shown separately in the Schools card above.
Census & demographics
- Census place
- Economy, PA
- County
- Allegheny County · 1,022,028 people
- City population
- 9,574
- Metro
- Pittsburgh, PA
- Population (ZIP)
- 21,851
- Household income
- $132,674
- Rent vs Own
- Severe rent burden
- 408.0
Population outlook (Beaver County) Hauer SSP2
- Today (2025)
- 164,976 people
- By 2030
- 161,449 · -2.1%
- By 2040
- 151,752 · -8.0%
- By 2050
- 141,155 · -14.4%
- By 2075
- 118,142 · -28.4%
- By 2100
- 91,740 · -44.4%
Race, ethnicity, and origin ACS 2023
- Neighborhood character
- Predominantly White (83%)
- Race & ethnicity
- White 83% Asian 8% Two or more races 4% Black 3% Hispanic / Latino 1%
- Common ancestry
- Romanian 6% Slovak 2% Italian 2%
- Foreign-born
- 8% · China, Canada
- Languages at home
- 90% English-only · Other Asian/Pacific 3% Other Indo-European 3% Chinese 1%
Political lean MEDSL · Beaver
- 2024 margin
- Strong R (+20.7) · D 39.2% · R 59.9%
- 2008→2024 swing
- -17.9pp toward R · 2008: -2.8pp · 2024: -20.7pp
- All cycles
- 2024: R+20.7 2020: R+17.7 2016: R+20.1 2012: R+6.6 2008: R+2.8
Not yet ingested
- Civics
- —
Market trends
- HPI YoY
- ▼ -209.16%
- Current HPI
- 262.7986
- Rent YoY
- —
- Metro
- Pittsburgh, PA
- State GDP YoY
- ▲ 1.68%
- F500 in state
- 34
Industry mix (Fortune 500 HQ in PA)
| Industry | F500 HQs | Revenue |
|---|---|---|
| Healthcare | 2 | $309B |
|
||
| Insurance | 2 | $27B |
|
||
| Telecommunications / Media | 1 | $124B |
|
||
| Industrial Distribution | 1 | $22B |
|
||
| Financial Services | 1 | $20B |
|
||
| Chemicals / Materials | 1 | $18B |
|
||
Price history
+122.2% since first listed5 events — show timeline
- 2026-03-26 Listed $150,000 West Penn MLS
- 1989-09-26 Sold (Public Records) $96,000 Public Records
- 1982-01-29 Sold (Public Records) $50,000 Public Records
- 1980-10-01 Sold (Public Records) $61,600 Public Records
- 1977-10-01 Sold (Public Records) $67,500 Public Records
Property tax history
+8.3%/yrLatest (2026): $8,752 · +1.4% YoY. Source: county tax records.
Cash-flow waterfall
monthlySold comps — $/sqft
last 12 mo · ≤1 miLoading sold comps…