55 S Bergin Pl Unit 3F · Freeport, NY
Flood risk 5/10 · Moderate
- FEMA flood zone
- X (unshaded)
- Chance of flooding over 30 yrs
- 0.24%
- Est. flood insurance / yr
- $507 – $1,088
Fire risk 2/10 · Minimal
- Est. fire insurance / yr
- $691 – $1,283
Heat risk 6/10 · Moderate
- Hot days now (above 95°F)
- 7 days/yr
- Hot days in 30 yrs
- 16 days/yr
Wind risk 6/10 · Moderate
- Chance of severe wind over 30 yrs
- 69.0%
Air-quality risk 4/10 · Minor
- Unhealthy air days now
- 5 days/yr
- Unhealthy air days in 30 yrs
- 8 days/yr
Risk factors via First Street. Map © Google.
Why this score? — see what drove the B- grade
The composite is a weighted blend of 9 inputs, each scored 0–100. Each bar is that input's sub-score; the figure is the points it added to the 100-point composite (weight × sub-score).
- Cash flow +27.6/30.0
- DSCR +9.7/10.0
- 1% rule +7.5/10.0
- ARV discount +7.5/15.0
- Schools +4.6/10.0
- Livability +4.2/5.0
- Rent growth +2.5/5.0
- Condition / age +2.5/5.0
- Appreciation +0.0/10.0
$215,000
🖨 Deal sheet 📄 Offer letter ✓ Due diligence
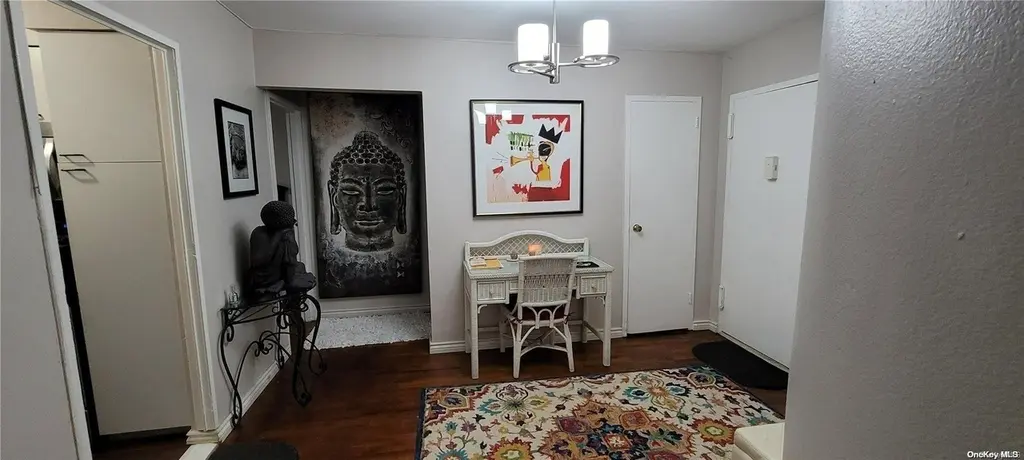
Listing remarks
: Beautiful and spacious Co Op in the heart of Freeport. Located near shops, parkways, schools, bus and train station. Minutes from Jones beach and Nautical mile. Co op offers all spacious rooms, 1 bedroom w 2 closets, full bathroom with tub, entrance foyer with closet and curved wall. Large living room and dining area with access to balcony. Kitchen offers stainless steel appliances with Refrigerator, dishwasher, microwave and stove. Lighting upgraded with 3 ceiling fans and light fixtures throughout unit. Hardwood floors A/C wall units and recently painted and conditioned walls makes it this unit ready to move in. Unit offers laundry room on same floor, elevator, 2 parking lot spaces, hea
Key facts
- 2 parking spots
- Built 1962
- Listed 125 days
Neighborhood map
What this means for you Summary
Snapshot
- This is a 1-bed/1.0-bath condo listed at $215k.
Deal economics
- At list price, monthly cash flow is $643 ($8k/yr) — positive.
- The deal already cash-flows at list — no discount required.
- Meets the 1% rule at list price ($3k rent vs $215k).
- Recommended offer: $189k (12.0% below list) — sets the bar for market timing.
- Cap rate 9.9% vs local median 3.0% in Freeport — top-decile yield for the area; either an underpriced asset or a hidden risk that comps aren't pricing in. Stress-test before assuming the spread holds.
Location & tenants
- Location reads 83/100 on livability (#69 in NY, #1,033 nationally) — a professional / high-income tenant draw. Strengths: commute A+, employment A+, housing A+; Watch: cost of living F.
- Freeport Union Free School District (suburban): math 49% / reading 55% proficiency, ranked #325 of 590 in NY (top 55%) — acceptable for families but not a draw, mixed tenant base, ~2y average lease.
- Zoned schools: John W Dodd Middle School (math 16% / reading 41%, grade F, #569 of 729 statewide, top 78%, 986 students, 67% FRL); Freeport High School (math 82% / reading 85%, grade A, #409 of 1,100 statewide, top 39%, 2,264 students, 62% FRL).
- Market conditions: 199 active listings in the ZIP; 6 comparable units currently listed for rent nearby; rentals lingering (median 44d on market — plan ~5-8 weeks vacancy on turnover, expect pricing pressure); 67% of comp listings sitting > 30 days — soft ceiling on asking rent; 824 units permitted in Nassau County in 2024 (153 in 5+ unit buildings).
Forward outlook
- Local home prices are declining (-3.0%/yr); year-one equity from $1k of loan paydown is wiped out by about $6k of value loss. Plan a longer hold.
- Nassau County population projected at +7% by 2050 — modest demand growth; plan on rents tracking national, not racing it.
- At projected returns (-3.0% appreciation + 3.0% rent growth), your $60k cash investment doubles in ~9 years — after that, you're playing with house money.
Negotiation context
- It's been on market 125 days — a 12% lower offer ($189k) is reasonable based on typical stale-listing flexibility.
- 3 sale attempts since 14y ago with the ask held roughly flat each time — persistent listings suggest the price (not the market) is what's stuck; bring a comps-based counter.
Risks & watch-outs
- Climate carrying-cost: moderate flood risk; major wind risk, 69% chance of damaging wind over 30y; extreme-heat days projected 7→16/yr by 2055 (HVAC capex compounding) — expect insurance premiums to compound above CPI over the hold.
Questions for the listing agent
- It's been on market 125 days. Have you received any prior offers? Is the seller open to a 12% concession, seller financing, or rate buy-down credit?
- Built in 1962 — when were the roof, HVAC, electrical panel, plumbing, and water heater last replaced?
- Any open or pending special assessments — roof, HVAC, plumbing, elevator, façade? What's the per-unit balance and payoff schedule, and is the seller paying it off at close or rolling it to the buyer?
- Why hasn't it sold? Are there any deal-killer items the seller is aware of (foundation, flood, title, zoning, code violations)?
- Is there a deadline driving the sale (1031 exchange, divorce, estate, relocation)? That informs how much negotiation room exists.
- Schools are B-rated — typically a magnet for longer-tenancy family renters. What's the average tenant stay here, and is there a school-zone premium baked into asking?
- What's the average days-on-market for RENTAL listings here right now (not sales)? A rising rental-DOM trend means longer vacancies and softer asking-rent achievability than the comps imply.
- What's the recent tenant-quality profile in this submarket — average credit score on applications, eviction rate, late-payment / NSF rate, and stable-employment percentage? A property-management company in the area should have these aggregated.
- How much new apartment / multifamily construction is in the pipeline within 1–3 miles? Heavy new supply (>2% of stock underway) typically softens rents 12–24 months out; light construction supports rent growth.
Investment metrics
- 1% rule
- 1.25% ✓
- Cap rate
- 9.88%
- Cash-on-cash
- 12.81%
- DSCR
- 1.57
- GRM
- 6.7
CMA / ARV
No comps found within radius.
Projected returns pro-forma
-3.0% appreciation · 3.0% rent growth · sell at horizon
- IRR
- 2.6%
- Equity multiple
- 1.10×
- Total profit
- $6,126
- Equity at exit
- $32,057
- IRR
- 12.2%
- Equity multiple
- 1.97×
- Total profit
- $58,197
- Equity at exit
- $18,589
Cash invested: $60,200 (down + closing). Projections, not guarantees.
Landlord ↔ Tenant lean methodology
- Overall (STATE)
- 15 Strongly Tenant-Friendly
- State New York
- 15 Strongly Tenant-Friendly · D+10
- County
- — inherits STATE
- City
- — inherits STATE
ZIP-level market 11520
- Active inventory
- 199
- Price-to-rent
- 6.7×
Monthly cashflow live
- Estimated rent
- $2,694 high interval (Pro) →
- Mortgage (P&I)
- −$1,127
- Tax est. 1.5%
- −$269 /mo · $3,225/yr
- Insurance
- −$90
- HOA
- −$0
- Vacancy / Maint / Mgmt
- −$566
- Net cashflow
- $643
Break-even live
UW: 25.0% down · 7.5% · 30yr · 1.5% tax · 5.0% vac · 8.0% maint · 8.0% mgmt
Financing live
Cash to close
- Down payment
- $53,750
- Closing costs
- $6,450
- Reserves months
- —
- Total cash needed
- —
Loan-product check · same deal, 3 products live
Conventional
25% down · 7.5% · 30yr
- Down + closing
- —
- Monthly P&I
- —
- Monthly cashflow
- —
- DSCR
- —
- Eligible?
- —
Personal DTI + credit; lowest rate.
DSCR
20% down · 8.5% · 30yr
- Down + closing
- —
- Monthly P&I
- —
- Monthly cashflow
- —
- DSCR
- —
- Eligible?
- —
No personal income docs; deal must DSCR.
Hard money
10% down · 12.0% · 12mo
- Down + closing
- —
- Monthly P&I
- —
- Monthly cashflow
- —
- DSCR
- —
- Eligible?
- —
Short-term bridge; refi at stabilization.
Rent comps 6 comps
| Address | Beds | Baths | Sqft | Rent | $/sqft | DOM | Units | Dist |
|---|---|---|---|---|---|---|---|---|
| 178 Pine St Freeport, NY | 1.0 | 1.0 | 745 | $2,588 | $3.47 | 2d | 3 | 0.10mi |
| 87-89 S Main St Unit 204 Freeport, NY | 1.0 | 1.0 | 900 | $2,900 | $3.22 | 44d | 1 | 0.40mi |
| 74 Broadway Unit 3B Freeport, NY | 1.0 | 1.0 | 525 | $2,700 | $5.14 | 44d | 1 | 0.45mi |
| 237 Porterfield Pl Freeport, NY | 1.0 | 1.0 | 659 | $3,100 | $4.70 | 44d | 1 | 0.68mi |
| 2092 Grand Ave Unit 2 Baldwin, NY | 2.0 | 1.0 | 1000 | $2,800 | $2.80 | 44d | 1 | 1.12mi |
| 840 Seaman Ave Unit 2w Baldwin, NY | 2.0 | 1.0 | 850 | $2,500 | $2.94 | 13d | 1 | 1.16mi |
HOA detail condo
- Monthly dues
- $0 · $0/yr
- Assessments
- None detected in remarks — confirm with the listing agent.
Listing history 6 events
-
2024-01-10status Pending
-
2023-09-06$215,000 Active
-
2014-01-20historical
-
2013-01-16$60,000
-
2012-08-24historical
-
2012-01-10$85,000
ⓘ Source: listings_history table (triggers on properties + properties_extension) + one-shot
backfill from property_details.listing_events for pre-trigger history.
Climate risk First Street
- Flood 5/10 Major FEMA zone X (unshaded) · 24% chance over 30 yrs
- Wildfire 2/10 Low
- Heat 6/10 Major 7 d/yr ≥95°F today · 16 d/yr by 30 yrs out
- Wind 6/10 Major 69% chance of damaging wind over 30 yrs
- Air quality 4/10 Moderate 5 unhealthy d/yr today · 8 by 30 yrs out
Nearby sold comps map
Loading sold comps map…
Walkable amenities ~0.75 mi
Loading nearby amenities…
Taxation est. · year 1
- Rental income
- $32,330
- − Mortgage interest
- −$12,043
- − Property taxes
- −$3,225
- − Insurance
- −$1,075
- − Repairs & maintenance
- −$2,586
- − Management
- −$2,586
- − Depreciation
- −$6,255
- Taxable income
- $4,559
- Est. tax owed @ 24.0%
- −$1,094
- After-tax cash flow
- $6,616/yr
For passive investors: Depreciation is non-cash, so a rental often shows a tax loss while cash-flowing — sheltering income. Rental losses are passive: they offset passive income freely, and up to $25,000/yr can offset ordinary (W-2) income if you actively participate and your MAGI is under $100k (phasing out to $0 by $150k); unused losses carry forward. On sale, claimed depreciation is recaptured at up to 25%, and gains may owe capital-gains tax (a 1031 exchange can defer both). Figures are a year-1 estimate at your 24.0% rate — not tax advice; consult a CPA.
Schools (NCES district)
- District
- Freeport Union Free School District
- NCES district ID
- 3611550
- Math proficiency
- 49% ▼ -4.00%
- Reading proficiency
- 55% ▲ 2.00%
- Median HH income
- $67,772
- Composite
- 46.12/100
- National rank
- #2507
- State rank
- #325 of 590 in NY
Livability — Freeport
- Score
- 83/100
- State rank
- #69
- US rank
- #1033
Category grades
Schools grade is shown separately in the Schools card above.
Census & demographics
- Census place
- Freeport, NY
- City population
- 44,873
- Population (ZIP)
- 44,873
Population outlook (Nassau County) Hauer SSP2
- Today (2025)
- 1,409,302 people
- By 2030
- 1,431,482 · +1.6%
- By 2040
- 1,471,607 · +4.4%
- By 2050
- 1,502,845 · +6.6%
- By 2075
- 1,575,403 · +11.8%
- By 2100
- 1,554,356 · +10.3%
Race, ethnicity, and origin ACS 2023
- Neighborhood character
- Diverse neighborhood (Simpson 0.67)
- Race & ethnicity
- Hispanic / Latino 43% Black 33% White 19% Two or more races 17% Asian 2%
- Hispanic origin (detail)
- Puerto Rican 4% Dominican 15%
- Common ancestry
- Hispanic 5% Scotch-Irish 1% Romanian 1%
- Foreign-born
- 34% · Canada, Jamaica, Guatemala
- Languages at home
- 55% English-only · Spanish 38% French/Haitian/Cajun 3% Other Indo-European 1%
Political lean MEDSL · Nassau
- 2024 margin
- Toss-up / Even · D 47.9% · R 52.1%
- 2008→2024 swing
- -12.6pp toward R · 2008: 8.4pp · 2024: -4.2pp
- All cycles
- 2024: R+4.2 2020: D+9.5 2016: D+5.3 2012: D+6.7 2008: D+8.4
Not yet ingested
- Civics
- —
Market trends
- HPI YoY
- ▼ -721.06%
- Current HPI
- 317.6076
- Rent YoY
- —
- Metro
- —
- State GDP YoY
- ▲ 2.60%
- F500 in state
- 92
Industry mix (Fortune 500 HQ in NY)
| Industry | F500 HQs | Revenue |
|---|---|---|
| Financial Services | 10 | $950B |
|
||
| Consumer Goods | 9 | $162B |
|
||
| Insurance | 4 | $225B |
|
||
| Telecommunications | 2 | $144B |
|
||
| Pharmaceuticals | 2 | $112B |
|
||
| Media / Entertainment | 2 | $69B |
|
||
Price history
+152.9% since first listed6 events — show timeline
- 2024-01-10 Pending — OneKey® MLS as Distributed by MLS Grid
- 2023-09-06 Listed $215,000 OneKey® MLS as Distributed by MLS Grid
- 2014-01-20 Listing Removed — OneKey® MLS as Distributed by MLS Grid
- 2013-01-16 Listed $60,000 OneKey® MLS as Distributed by MLS Grid
- 2012-08-24 Listing Removed — OneKey® MLS as Distributed by MLS Grid
- 2012-01-10 Listed $85,000 OneKey® MLS as Distributed by MLS Grid
Cash-flow waterfall
monthlySold comps — $/sqft
last 12 mo · ≤1 miLoading sold comps…