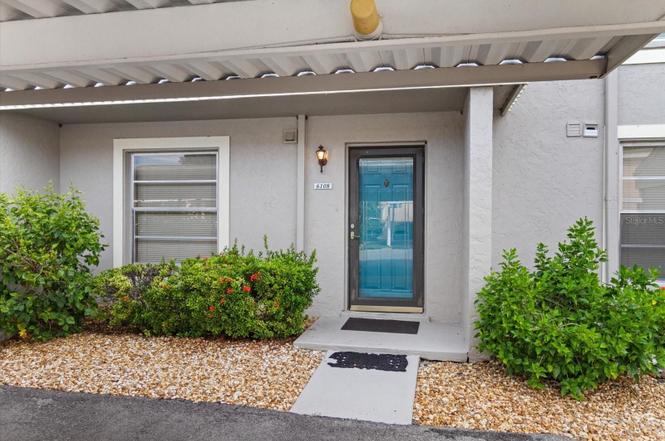
6108 7th Ave W #6108 · Bradenton, FL
Flood risk No data
- FEMA flood zone
- —
- Chance of flooding over 30 yrs
- —
- Est. flood insurance / yr
- —
Fire risk No data
- Est. fire insurance / yr
- —
Heat risk No data
- Hot days now (above threshold)
- —
- Hot days in 30 yrs
- —
Wind risk No data
- Chance of severe wind over 30 yrs
- —
Air-quality risk No data
- Unhealthy air days now
- —
- Unhealthy air days in 30 yrs
- —
Risk factors via First Street. Map © Google.
Why this score? — see what drove the D grade
The composite is a weighted blend of 9 inputs, each scored 0–100. Each bar is that input's sub-score; the figure is the points it added to the 100-point composite (weight × sub-score).
- Cash flow +9.8/30.0
- 1% rule +8.3/10.0
- ARV discount +7.5/15.0
- Schools +4.4/10.0
- Livability +4.0/5.0
- DSCR +2.8/10.0
- Condition / age +2.5/5.0
- Rent growth +2.4/5.0
- Appreciation +0.0/10.0
$174,900
🖨 Deal sheet (PDF) 📄 Offer letter ✓ Due diligence
Listing remarks
MAJOR PRICE REDUCTION! Sought after GROUND FLOOR 3 bedroom condo in lovely Pebble Springs. Looks can be so deceiving here. When you drive in, you will see the well maintained entrances and carports. But enter this lovely and light unit and you will see your backyard oasis. Step out of your screened lanai and walk just steps to the gorgeously landscaped pool. Split floorplan, immaculately kept and tastefully furnished. The bonus is a BRAND NEW ROOF which the SELLER is paying for, a new hot water heater in 2024. What more can you ask for?
Key facts
- Brand new roof
- Ground floor
- Backyard oasis
Tags
Property features AI
Finance
- Other: Total annual fees reported $8,940
- Financial info: Condo fees required monthly; Lease restrictions apply
- HOA & community: HOA managed by C&S Community Management; Monthly condo/HOA fee $745 (includes cable TV, internet, structure and grounds maintenance, pool, recreational facilities); Association approval required; Pets allowed (cats and dogs); Clubhouse and pool in community
Exterior
- Parking: Carport with 1 space
- Utilities: Public water; Public sewer; Electricity connected; Cable connected; Internet available
- Home design: Residential condominium; One level (listed as floor 1); Faces west; Two stories total in building; Entry on first floor
- Construction: Stucco construction; Shingle roof; Slab foundation
- Exterior features: Stucco exterior; Shingle roof; Asphalt road access; Lot approximately 1.58 acres; Cluster III building
Interior
- Kitchen: Dishwasher; Range; Refrigerator; Electric water heater
- Bedrooms: 3 bedrooms
- Flooring: Laminate
- Bathrooms: 2 full bathrooms
- Heating & cooling: Electric heating; Central air conditioning
- Interior features: Ceiling fans; Eat-in kitchen; Open floor plan; Sliding doors
- Laundry & utility: Washer; Dryer; Laundry inside
Neighborhood map
What this means for you Summary
Snapshot
- This is a 3-bed/2.0-bath single-family listed at $175k.
Deal economics
- At list price, monthly cash flow is $-111 ($-1k/yr) — negative.
- To cash-flow at today's rent, offer at most $159k (9.2% below list).
- Meets the 1% rule at list price ($2k rent vs $175k).
- Recommended offer: $154k (12.0% below list) — sets the bar for market timing.
- Cap rate 5.5% vs local median 3.6% in Bradenton — top-decile yield for the area; either an underpriced asset or a hidden risk that comps aren't pricing in. Stress-test before assuming the spread holds.
Location & tenants
- Location reads 81/100 on livability (#101 in FL, #1,528 nationally) — a professional / high-income tenant draw. Strengths: commute A+, cost of living A+, housing A+; Watch: employment D+, crime D, amenities F.
- Manatee (suburban): math 54% / reading 50% proficiency, ranked #26 of 73 in FL (top 36%) — acceptable for families but not a draw, mixed tenant base, ~2y average lease.
- Zoned schools: Palma Sola Elementary School (math 72% / reading 59%, grade B+, #500 of 2,144 statewide, top 24%, 434 students, 56% FRL); Martha B. King Middle School (math 48% / reading 39%, grade D, #329 of 571 statewide, top 58%, 848 students, 63% FRL); Manatee High School (math 32% / reading 47%, grade F, #304 of 667 statewide, top 47%, 1,983 students, 59% FRL).
- Market conditions: Rents soft (-0.3%/yr); 514 active listings in the ZIP; 24 comparable units currently listed for rent nearby; rentals at typical pace (median 18d on market — plan ~3-4 weeks tenant-placement turnaround); solid renter incomes; 7,472 units permitted in Manatee County in 2024 (1,782 in 5+ unit buildings).
- This rent runs 34% of the median local income ($82k/yr) — at the standard rent-burdened threshold; future hikes will face affordability resistance.
Forward outlook
- Local home prices are declining (-3.0%/yr); year-one equity from $1k of loan paydown is wiped out by about $5k of value loss. Plan a longer hold.
- Manatee County population projected at +43% by 2050 — long-run rental-demand tailwind backs the buy-and-hold thesis.
Negotiation context
- It's been on market 269 days — a 12% lower offer ($154k) is reasonable based on typical stale-listing flexibility.
- 6 sale attempts since 2y ago; this cycle's ask is 5730% above the opening price — seller raised mid-cycle; expect resistance to lowballs.
Risks & watch-outs
- Watch-outs: HOA is 32% of rent.
Questions for the listing agent
- What do current leases actually rent for vs. the listed asking? Can we see a recent rent roll and the last 12 months of T-12 income?
- It's been on market 269 days. Have you received any prior offers? Is the seller open to a 12% concession, seller financing, or rate buy-down credit?
- Built in 1979 — when were the roof, HVAC, electrical panel, plumbing, and water heater last replaced?
- What does the HOA fee cover, when was the last increase, and are there any pending special assessments or reserve-fund shortfalls?
- Why hasn't it sold? Are there any deal-killer items the seller is aware of (foundation, flood, title, zoning, code violations)?
- Is there a deadline driving the sale (1031 exchange, divorce, estate, relocation)? That informs how much negotiation room exists.
- Crime grade is D in this area — have there been break-ins, vandalism, or insurance claims at this property in the last 3 years? What carrier currently insures it and at what premium?
- The area grade is low — what's the realistic commute time and amenity access for the typical tenant pool here? Any planned neighborhood developments (good or bad) we should know about?
- What's the average days-on-market for RENTAL listings here right now (not sales)? A rising rental-DOM trend means longer vacancies and softer asking-rent achievability than the comps imply.
- What's the recent tenant-quality profile in this submarket — average credit score on applications, eviction rate, late-payment / NSF rate, and stable-employment percentage? A property-management company in the area should have these aggregated.
- How much new for-sale + rental construction is in the pipeline within 1–3 miles? Heavy new supply typically softens prices + rents 12–24 months out; constrained supply supports both.
Investment metrics
- 1% rule
- 1.33% ✓
- Cap rate
- 5.53%
- Cash-on-cash
- -2.73%
- DSCR
- 0.88
- GRM
- 6.3
CMA / ARV
- ARV (on-the-fly)
- $376,992
- Comps found
- 12
Show comp detail 12 sales within ~0.75 mi
| Address | Dist | Beds/Ba | Sqft | Sold | Price | $/sf | Match |
|---|---|---|---|---|---|---|---|
| 204 59th St NW | 0.34mi | 3/2.0 | 1,116 (-9%) | 4mo | $367,000 | $329 | 66 |
| 1314 58th St W #1314 | 0.54mi | 2/2.0 (-1) | 1,220 (-0%) | 4mo | $220,000 | $180 | 66 |
| 6415 2nd Ave W | 0.40mi | 3/2.0 | 1,319 (+8%) | 6mo | $396,000 | $300 | 64 |
| 5723 1st Avenue Dr W | 0.26mi | 3/2.0 | 1,404 (+15%) | 2mo | $570,000 | $406 | 61 |
| 5501 3rd Avenue Plz W | 0.29mi | 2/2.0 (-1) | 1,380 (+13%) | 2mo | $400,000 | $290 | 58 |
| 5212 1st Ave W | 0.50mi | 4/2.0 (+1) | 1,152 (-6%) | 6mo | $355,000 | $308 | 56 |
| 201 63rd St W | 0.30mi | 2/2.0 (-1) | 1,050 (-14%) | 6mo | $350,000 | $333 | 53 |
| 6419 1st Ave W | 0.44mi | 2/2.0 (-1) | 1,078 (-12%) | 2mo | $345,000 | $320 | 53 |
| 6112 1st Ave W | 0.33mi | 2/1.0 (-1) | 1,065 (-13%) | 2mo | $295,000 | $277 | 52 |
| 6012 1st Ave W | 0.30mi | 2/2.0 (-1) | 1,402 (+14%) | 6mo | $350,000 | $250 | 51 |
| 403 61st St NW | 0.47mi | 2/2.0 (-1) | 1,394 (+14%) | 3mo | $437,000 | $313 | 47 |
| 5116 13th Avenue Dr W | 0.68mi | 3/1.5 | 1,394 (+14%) | 0mo | $360,000 | $258 | 43 |
Match score weights: distance 35% · size 25% · config 20% · recency 20%. Top-matched comps best support the ARV.
Projected returns pro-forma
-3.0% appreciation · 0.0% rent growth · sell at horizon
- IRR
- -26.3%
- Equity multiple
- 0.15×
- Total profit
- $-41,780
- Equity at exit
- $26,078
- IRR
- -56.2%
- Equity multiple
- -0.43×
- Total profit
- $-69,930
- Equity at exit
- $15,122
Cash invested: $48,972 (down + closing). Projections, not guarantees.
Landlord ↔ Tenant lean methodology
- Overall (STATE)
- 87 Strongly Landlord-Friendly
- State Florida
- 87 Strongly Landlord-Friendly · R+3
- County
- — inherits STATE
- City
- — inherits STATE
ZIP-level market 34209
- Rents YoY
- -0.3%
- Active inventory
- 514
- Price-to-rent
- 6.3×
Monthly cashflow live
- Estimated rent
- $2,332 high interval (Pro) →
- Mortgage (P&I)
- −$917
- Tax est. 1.5%
- −$219 /mo · $2,624/yr
- Insurance
- −$73
- HOA
- −$745
- Vacancy / Maint / Mgmt
- −$490
- Net cashflow
- $-111
Break-even live
Sensitivity live
| Price | -10% $9 | -5% $-51 | +0% $-111 | +5% $-172 | +10% $-232 |
|---|---|---|---|---|---|
| Rent | -10% $-296 | -5% $-204 | +0% $-111 | +5% $-19 | +10% $73 |
| Rate | -1.0pp $-23 | -0.5pp $-67 | base $-111 | +0.5pp $-157 | +1.0pp $-203 |
UW: 25.0% down · 7.5% · 30yr · 1.5% tax · 5.0% vac · 8.0% maint · 8.0% mgmt
Financing live
Cash to close
- Down payment
- $43,725
- Closing costs
- $5,247
- Reserves months
- —
- Total cash needed
- —
Loan-product check · same deal, 3 products live
Conventional
25% down · 7.5% · 30yr
- Down + closing
- —
- Monthly P&I
- —
- Monthly cashflow
- —
- DSCR
- —
- Eligible?
- —
Personal DTI + credit; lowest rate.
DSCR
20% down · 8.5% · 30yr
- Down + closing
- —
- Monthly P&I
- —
- Monthly cashflow
- —
- DSCR
- —
- Eligible?
- —
No personal income docs; deal must DSCR.
Hard money
10% down · 12.0% · 12mo
- Down + closing
- —
- Monthly P&I
- —
- Monthly cashflow
- —
- DSCR
- —
- Eligible?
- —
Short-term bridge; refi at stabilization.
Rent comps 24 comps
| Address | Beds | Baths | Sqft | Rent | $/sqft | DOM | Units | Dist |
|---|---|---|---|---|---|---|---|---|
| 6102 7th Ave W Unit 6102 Bradenton, FL | 2.0 | 2.0 | 1050 | $2,600 | $2.48 | 25d | 1 | 0.03mi |
| 6318 7th Ave W Unit None Bradenton, FL | 2.0 | 2.0 | 1025 | $2,000 | $1.95 | 25d | 1 | 0.03mi |
| 6318 7th Ave W Bradenton, FL | 2.0 | 2.0 | 1025 | $1,800 | $1.76 | 25d | 1 | 0.03mi |
| 6306 7th Ave W Bradenton, FL | 3.0 | 2.0 | 984 | $1,800 | $1.83 | 18d | 1 | 0.03mi |
| 5513 3rd Avenue Plz W Bradenton, FL | 3.0 | 2.0 | 1282 | $2,019 | $1.57 | 5d | 1 | 0.25mi |
| 6448 7th Avenue Cir W Bradenton, FL | 3.0 | 2.0 | 1482 | $3,100 | $2.09 | 25d | 1 | 0.40mi |
| 6618 7th Ave Cir W #1404 Bradenton, FL | 2.0 | 2.0 | 1440 | $3,400 | $2.36 | 25d | 1 | 0.41mi |
| 6446 7th Avenue Cir W Unit 6446 Bradenton, FL | 2.0 | 2.0 | 1440 | $2,400 | $1.67 | 25d | 1 | 0.41mi |
| 6646 7th Avenue Cir W Bradenton, FL | 2.0 | 2.0 | 1440 | $2,500 | $1.74 | 25d | 1 | 0.43mi |
| 6652 7th Avenue Cir W Bradenton, FL | 3.0 | 2.0 | 1495 | $2,800 | $1.87 | 16d | 1 | 0.46mi |
| 109 53rd St W Bradenton, FL | 3.0 | 2.5 | 1492 | $2,700 | $1.81 | 25d | 1 | 0.47mi |
| 5132 1st Ave W Bradenton, FL | 3.0 | 2.0 | 1249 | $2,500 | $2.00 | 18d | 1 | 0.52mi |
| 1225 56th St W Bradenton, FL | 2.0 | 2.0 | 1222 | $1,800 | $1.47 | 5d | 1 | 0.58mi |
| 6904 Manatee Ave W Bradenton, FL | 1.0–3.0 | 1.0–2.0 | 1068 | $2,050 | $1.92 | 3d | 76 | 0.65mi |
| 4607 7th Ave W Bradenton, FL | 3.0 | 1.0 | 1296 | $1,950 | $1.50 | 25d | 1 | 0.86mi |
| 202 46th St W Unit 207 Bradenton, FL | 2.0 | 2.0 | 951 | $1,800 | $1.89 | 18d | 1 | 0.87mi |
| 7507 4th Ave W Unit 1546087P Bradenton, FL | 3.0 | 2.0 | 1474 | $2,258 | $1.53 | 18d | 1 | 1.00mi |
| 6817 11th Ave NW Bradenton, FL | 3.0 | 2.0 | 1308 | $3,200 | $2.45 | 25d | 1 | 1.05mi |
| 6415 21st Ave W Bradenton, FL | 1.0–2.0 | 1.0–2.0 | 1150 | $1,896 | $1.65 | 5d | 5 | 1.08mi |
| 6304 Pointe West Blvd Unit A309 Bradenton, FL | 2.0 | 2.0 | 1042 | $1,795 | $1.72 | 12d | 1 | 1.13mi |
| 6914 20th Ave W Bradenton, FL | 2.0 | 2.0 | 1383 | $2,795 | $2.02 | 18d | 1 | 1.17mi |
| 5933 28th Ave W Bradenton, FL | 1.0–2.0 | 1.0–2.0 | 945 | $2,013 | $2.13 | 3d | 6 | 1.34mi |
| 3805 7th Ave W Bradenton, FL | 3.0 | 1.0 | 1000 | $2,200 | $2.20 | 25d | 1 | 1.35mi |
| 1408 37th Street Ct W Bradenton, FL | 3.0 | 2.0 | 1188 | $2,500 | $2.10 | 5d | 1 | 1.49mi |
HOA detail
- Monthly dues
- $745 · $8,940/yr
- Likely covers
- waterpool
Listing history 35 events
-
2026-06-22days on market $174,900 Active 269 DOM
-
2026-06-18days on market $174,900 Active 266 DOM
-
2026-06-17days on market $174,900 Active 265 DOM
-
2026-06-16days on market $174,900 Active 264 DOM
-
2026-06-15days on market $174,900 Active 263 DOM
-
2026-06-13days on market $174,900 Active 261 DOM
-
2026-06-13days on market $174,900 Active 260 DOM
-
2026-06-10days on market $174,900 Active 258 DOM
-
2026-06-09days on market $174,900 Active 257 DOM
-
2026-06-08days on market $174,900 Active 256 DOM
-
2026-06-08days on market $174,900 Active 255 DOM
-
2026-06-03days on market $174,900 Active 251 DOM
-
2026-06-02days on market $174,900 Active 250 DOM
-
2026-06-01days on market $174,900 Active 249 DOM
-
2026-05-31days on market $174,900 Active 248 DOM
-
2026-03-06price $174,900
-
2026-02-06price $199,900
-
2026-02-01historical $3,000
-
2026-01-01$3,000
-
2025-12-21historical $3,000
-
2025-12-18$3,000
-
2025-11-28historical $3,000
-
2025-11-13$3,000
-
2025-09-25$209,900 Active
-
2025-08-05historical $1,700
-
2025-08-01status Pending
-
2025-07-18price $214,900
-
2025-07-08price $1,700
-
2025-05-27$219,900 Active
-
2025-05-03price $1,850
-
2025-04-25price $1,750
-
2025-03-08price $1,900
-
2025-01-13price $2,500
-
2024-12-18price $2,800
-
2024-12-05$3,000
ⓘ Source: listings_history table (triggers on properties + properties_extension) + one-shot
backfill from property_details.listing_events for pre-trigger history.
Nearby sold comps map
Loading sold comps map…
Walkable amenities ~0.75 mi
Loading nearby amenities…
Taxation est. · year 1
- Rental income
- $27,984
- − Mortgage interest
- −$9,797
- − Property taxes
- −$2,624
- − Insurance
- −$874
- − Repairs & maintenance
- −$2,239
- − Management
- −$2,239
- − HOA
- −$8,940
- − Depreciation
- −$5,088
- Taxable loss
- −$3,817
- Est. tax savings @ 24.0%
- +$916
- After-tax cash flow
- $-421/yr
For passive investors: Depreciation is non-cash, so a rental often shows a tax loss while cash-flowing — sheltering income. Rental losses are passive: they offset passive income freely, and up to $25,000/yr can offset ordinary (W-2) income if you actively participate and your MAGI is under $100k (phasing out to $0 by $150k); unused losses carry forward. On sale, claimed depreciation is recaptured at up to 25%, and gains may owe capital-gains tax (a 1031 exchange can defer both). Figures are a year-1 estimate at your 24.0% rate — not tax advice; consult a CPA.
Schools (NCES district)
- District
- Manatee
- NCES district ID
- 1201230
- Math proficiency
- 54% ▼ -6.00%
- Reading proficiency
- 50% ▼ -2.00%
- Median HH income
- $49,607
- Composite
- 44.43/100
- National rank
- #2806
- State rank
- #26 of 73 in FL
Livability — Bradenton
- Score
- 81/100
- State rank
- #101
- US rank
- #1528
Category grades
Schools grade is shown separately in the Schools card above.
Census & demographics
- County
- Manatee County · 416,364 people
- City population
- 227,091
- Metro
- North Port-Sarasota-Bradenton, FL
- Population (ZIP)
- 33,224
- Household income
- $81,728
- Rent vs Own
- Severe rent burden
- 1126.0
Population outlook (Manatee County) Hauer SSP2
- Today (2025)
- 447,342 people
- By 2030
- 488,911 · +9.3%
- By 2040
- 567,934 · +27.0%
- By 2050
- 637,995 · +42.6%
- By 2075
- 781,970 · +74.8%
- By 2100
- 848,272 · +89.6%
Race, ethnicity, and origin ACS 2023
- Neighborhood character
- Predominantly White (84%)
- Race & ethnicity
- White 84% Hispanic / Latino 11% Two or more races 6% Black 2% Asian 1%
- Hispanic origin (detail)
- Puerto Rican 4% Cuban 3%
- Common ancestry
- Romanian 3% Slovak 3% Lithuanian 3%
- Foreign-born
- 9% · Canada, Jamaica, China
- Languages at home
- 90% English-only · Spanish 6% Russian/Polish/Slavic 1% Other Indo-European 1%
Political lean MEDSL · Manatee
- 2024 margin
- Strong R (+23.5) · D 37.9% · R 61.4%
- 2008→2024 swing
- -16.5pp toward R · 2008: -7.0pp · 2024: -23.5pp
- All cycles
- 2024: R+23.5 2020: R+16.1 2016: R+17.1 2012: R+12.5 2008: R+7.0
Not yet ingested
- Civics
- —
Market trends
- HPI YoY
- ▼ -360.34%
- Current HPI
- 320.0061
- Rent YoY
- ▼ -0.30%
- Metro
- North Port-Sarasota-Bradenton, FL
- State GDP YoY
- ▲ 3.28%
- F500 in state
- 36
Industry mix (Fortune 500 HQ in FL)
| Industry | F500 HQs | Revenue |
|---|---|---|
| Industrial Technology | 2 | $29B |
|
||
| Insurance | 2 | $17B |
|
||
| Retail | 1 | $60B |
|
||
| Technology Distribution | 1 | $58B |
|
||
| Homebuilding | 1 | $35B |
|
||
| Technology Manufacturing | 1 | $35B |
|
||
Price history
+5730.0% since first listed20 events — show timeline
- 2026-03-06 Price Changed $174,900 Stellar MLS as Distributed by MLS Grid
- 2026-02-06 Price Changed $199,900 Stellar MLS as Distributed by MLS Grid
- 2026-02-01 Rental Removed $3,000 STELLARMLS
- 2026-01-01 Listed for Rent $3,000 STELLARMLS
- 2025-12-21 Rental Removed $3,000 STELLARMLS
- 2025-12-18 Listed for Rent $3,000 STELLARMLS
- 2025-11-28 Rental Removed $3,000 STELLARMLS
- 2025-11-13 Listed for Rent $3,000 STELLARMLS
- 2025-09-25 Listed $209,900 Stellar MLS as Distributed by MLS Grid
- 2025-08-05 Rental Removed $1,700 STELLARMLS
- 2025-08-01 Pending — Stellar MLS as Distributed by MLS Grid
- 2025-07-18 Price Changed $214,900 Stellar MLS as Distributed by MLS Grid
- 2025-07-08 Price Changed $1,700 STELLARMLS
- 2025-05-27 Listed $219,900 Stellar MLS as Distributed by MLS Grid
- 2025-05-03 Price Changed $1,850 STELLARMLS
- 2025-04-25 Price Changed $1,750 STELLARMLS
- 2025-03-08 Price Changed $1,900 STELLARMLS
- 2025-01-13 Price Changed $2,500 STELLARMLS
- 2024-12-18 Price Changed $2,800 STELLARMLS
- 2024-12-05 Listed for Rent $3,000 STELLARMLS
Cash-flow waterfall
monthlySold comps — $/sqft
last 12 mo · ≤1 miLoading sold comps…