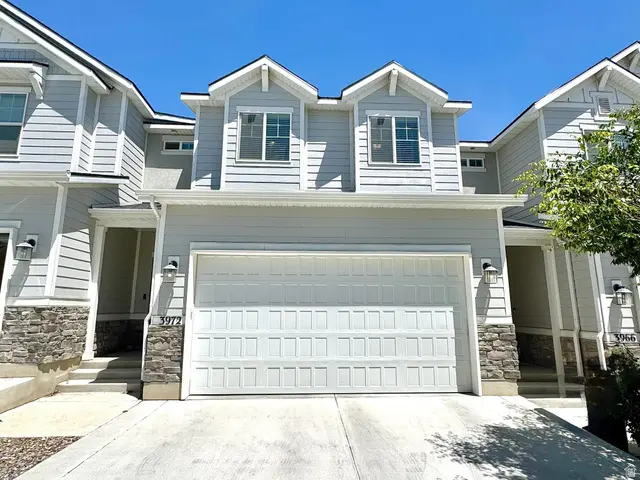
3972 W 740 N · Lehi, UT
Flood risk 1/10 · Minimal
- FEMA flood zone
- X (unshaded)
- Chance of flooding over 30 yrs
- 0.0%
- Est. flood insurance / yr
- $473 – $860
Fire risk 7/10 · Major
- Est. fire insurance / yr
- $453 – $841
Heat risk 5/10 · Moderate
- Hot days now (above 93°F)
- 8 days/yr
- Hot days in 30 yrs
- 23 days/yr
Wind risk 1/10 · Minimal
- Chance of severe wind over 30 yrs
- —
Air-quality risk 2/10 · Minimal
- Unhealthy air days now
- 1 days/yr
- Unhealthy air days in 30 yrs
- 2 days/yr
Risk factors via First Street. Map © Google.
Why this score? — see what drove the D- grade
The composite is a weighted blend of 9 inputs, each scored 0–100. Each bar is that input's sub-score; the figure is the points it added to the 100-point composite (weight × sub-score).
- Appreciation +10.0/10.0
- ARV discount +7.5/15.0
- Cash flow +6.0/30.0
- Livability +4.4/5.0
- Schools +4.2/10.0
- Rent growth +2.5/5.0
- Condition / age +2.5/5.0
- 1% rule +0.5/10.0
- DSCR +0.3/10.0
$449,900
🖨 Deal sheet (PDF) 📄 Offer letter ✓ Due diligence
Listing remarks
This beautifully maintained Lehi townhome offers 2,395 sq ft of modern living across three thoughtfully designed levels. Built in 2021, it features an open-concept main floor with 9-foot ceilings, an oversized island, upgraded solid-surface countertops, premium cabinetry, and brand-new carpet-perfect for everyday living and entertaining. A spacious two-car garage adds convenience and extra storage. Upstairs, you'll find a generous primary suite with a walk-in closet and private ensuite bath, along with two additional bedrooms and a full bathroom. The unfinished basement provides an excellent opportunity to add future living space, a home gym, office, or additional storage to fit your needs.
Key facts
- Walk-in closet
- Premium cabinetry
- Oversized island
Tags
Property features AI
Finance
- HOA & community: Homeowners association (HOA Living); Monthly HOA fee: $109; HOA covers insurance and grounds maintenance; Association amenities include maintenance, insurance, pet policy, picnic area, and snow removal; Subdivision: HARMONY TOWNHOMES
Exterior
- Parking: Attached garage; Covered parking spaces: 2; Open parking spaces: 4; Total parking spaces: 6; 2-car garage
- Security: Video doorbell(s)
- Utilities: Natural gas connected; Electricity connected; Water (culinary) connected; Public sewer connected
- Home design: Townhouse (row-mid); Built in 2021; Standing/established condition
- Construction: Asphalt, stone, and cement siding exterior materials; Asphalt roof; Built/standing construction
- Exterior features: Double-pane windows; Sliding glass doors; Curb and gutter; Full landscaping; Flat terrain
Interior
- Kitchen: Updated kitchen; Gas oven/range; Portable dishwasher; Microwave
- Bedrooms: Total rooms: 9 (includes bedrooms and other living spaces); Daylight basement
- Flooring: Carpet; Tile
- Bathrooms: 2 full bathrooms; 1 partial/half bathroom
- Heating & cooling: Forced-air heating (gas central, ≥95% efficiency); Central air conditioning
- Interior features: Primary bathroom with separate tub and shower; Walk-in closet; Garbage disposal; Updated kitchen; Free-standing gas range/oven; Video doorbell(s); Blinds; Window coverings
- Laundry & utility: Electric dryer hookup
Neighborhood map
What this means for you Summary
Snapshot
- This is a 3-bed/2.5-bath townhouse listed at $450k.
Deal economics
- At list price, monthly cash flow is $-866 ($-10k/yr) — negative.
- To cash-flow at today's rent, offer at most $297k (34.0% below list).
- To meet the 1% rule (rent ≥ 1% of price), the offer needs to be $248k (44.9% below list).
- Recommended offer: $248k (44.9% below list) — sets the bar for 1% rule.
Location & tenants
- Location reads 88/100 on livability (#6 in UT, #242 nationally) — a professional / high-income tenant draw. Strengths: crime A+, commute A+, employment A+; Watch: cost of living F.
- Alpine District (suburban): math 45% / reading 50% proficiency, ranked #25 of 80 in UT (top 31%) — families likely to look elsewhere, expect single-tenant / working-renter base with shorter leases; only 18% free/reduced lunch — higher-income household profile.
- Zoned schools: North Point School (math 52% / reading 57%, grade C, #106 of 585 statewide, top 19%, 1,022 students, 16% FRL); Willowcreek Middle (math 50% / reading 47%, grade C-, #35 of 138 statewide, top 26%, 1,746 students, 13% FRL); Lehi High (math 36% / reading 47%, grade F, #57 of 171 statewide, top 34%, 1,982 students, 12% FRL) — zoned schools at 14% FRL track the district average.
- Market conditions: 329 active listings in the ZIP; 40 comparable units currently listed for rent nearby; rentals at typical pace (median 21d on market — plan ~3-4 weeks tenant-placement turnaround); 6,326 units permitted in Utah County in 2024 (1,053 in 5+ unit buildings).
Forward outlook
- In year one you build about $48k of equity ($3k loan paydown + $45k appreciation (10.0% local appreciation)).
- Utah County population projected at +49% by 2050 — long-run rental-demand tailwind backs the buy-and-hold thesis.
- By year 2, paydown + projected appreciation supports a ~$77k cash-out refi (75% LTV) — recoverable capital for the next deal without selling this one.
Negotiation context
- It's been on market 15 days — a 2% lower offer ($443k) is reasonable based on typical stale-listing flexibility.
Risks & watch-outs
- Climate carrying-cost: major wildfire risk; extreme-heat days projected 8→23/yr by 2055 (HVAC capex compounding) — expect insurance premiums to compound above CPI over the hold.
Questions for the listing agent
- What do current leases actually rent for vs. the listed asking? Can we see a recent rent roll and the last 12 months of T-12 income?
- What does the HOA fee cover, when was the last increase, and are there any pending special assessments or reserve-fund shortfalls?
- Is there a deadline driving the sale (1031 exchange, divorce, estate, relocation)? That informs how much negotiation room exists.
- Schools are B-rated — typically a magnet for longer-tenancy family renters. What's the average tenant stay here, and is there a school-zone premium baked into asking?
- The area grade is low — what's the realistic commute time and amenity access for the typical tenant pool here? Any planned neighborhood developments (good or bad) we should know about?
- What's the average days-on-market for RENTAL listings here right now (not sales)? A rising rental-DOM trend means longer vacancies and softer asking-rent achievability than the comps imply.
- What's the recent tenant-quality profile in this submarket — average credit score on applications, eviction rate, late-payment / NSF rate, and stable-employment percentage? A property-management company in the area should have these aggregated.
- How much new for-sale + rental construction is in the pipeline within 1–3 miles? Heavy new supply typically softens prices + rents 12–24 months out; constrained supply supports both.
Investment metrics
- 1% rule
- 0.55% ✗
- Cap rate
- 3.98%
- Cash-on-cash
- -8.25%
- DSCR
- 0.63
- GRM
- 15.1
CMA / ARV
No comps found within radius.
Projected returns pro-forma
10.0% appreciation · 3.0% rent growth · sell at horizon
- IRR
- 18.5%
- Equity multiple
- 2.51×
- Total profit
- $189,730
- Equity at exit
- $405,306
- IRR
- 17.2%
- Equity multiple
- 5.78×
- Total profit
- $601,827
- Equity at exit
- $874,057
Cash invested: $125,972 (down + closing). Projections, not guarantees.
Landlord ↔ Tenant lean methodology
- Overall (STATE)
- 86 Strongly Landlord-Friendly
- State Utah
- 86 Strongly Landlord-Friendly · R+15
- County
- — inherits STATE
- City
- — inherits STATE
ZIP-level market 84048
- Home prices YoY
- 16.8%
- Active inventory
- 329
- Price-to-rent
- 15.1×
Monthly cashflow live
- Estimated rent
- $2,479 high interval (Pro) →
- Mortgage (P&I)
- −$2,359
- Tax from tax record
- −$169 /mo · $2,029/yr
- Insurance
- −$187
- HOA
- −$109
- Vacancy / Maint / Mgmt
- −$521
- Net cashflow
- $-866
Break-even live
Sensitivity live
| Price | -10% $-611 | -5% $-739 | +0% $-866 | +5% $-993 | +10% $-1,121 |
|---|---|---|---|---|---|
| Rent | -10% $-1,062 | -5% $-964 | +0% $-866 | +5% $-768 | +10% $-670 |
| Rate | -1.0pp $-640 | -0.5pp $-752 | base $-866 | +0.5pp $-983 | +1.0pp $-1,101 |
UW: 25.0% down · 7.5% · 30yr · 1.5% tax · 5.0% vac · 8.0% maint · 8.0% mgmt
Financing live
Cash to close
- Down payment
- $112,475
- Closing costs
- $13,497
- Reserves months
- —
- Total cash needed
- —
Loan-product check · same deal, 3 products live
Conventional
25% down · 7.5% · 30yr
- Down + closing
- —
- Monthly P&I
- —
- Monthly cashflow
- —
- DSCR
- —
- Eligible?
- —
Personal DTI + credit; lowest rate.
DSCR
20% down · 8.5% · 30yr
- Down + closing
- —
- Monthly P&I
- —
- Monthly cashflow
- —
- DSCR
- —
- Eligible?
- —
No personal income docs; deal must DSCR.
Hard money
10% down · 12.0% · 12mo
- Down + closing
- —
- Monthly P&I
- —
- Monthly cashflow
- —
- DSCR
- —
- Eligible?
- —
Short-term bridge; refi at stabilization.
Rent comps 40 comps
| Address | Beds | Baths | Sqft | Rent | $/sqft | DOM | Units | Dist |
|---|---|---|---|---|---|---|---|---|
| 3823 W Cold Pond Ave Lehi, UT | 3.0 | 2.5 | 3067 | $2,595 | $0.85 | 4d | 1 | 0.11mi |
| 803 N Hilltop Dr Lehi, UT | 4.0 | 3.5 | 2408 | $500 | $0.21 | 25d | 1 | 0.16mi |
| 3935 W 1000 N Lehi, UT | 4.0 | 2.5 | 2100 | $3,000 | $1.43 | 25d | 1 | 0.26mi |
| 3709 W 930 N Lehi, UT | 4.0 | 3.5 | 2247 | $550 | $0.24 | 25d | 1 | 0.26mi |
| 4009 1180 N Saratoga Springs, UT | 4.0 | 2.5 | 2879 | $2,549 | $0.89 | 21d | 1 | 0.41mi |
| 613 N Pear Dr Lehi, UT | 4.0 | 2.5 | 2696 | $2,650 | $0.98 | 16d | 1 | 0.46mi |
| 3757 Big Horn Dr Unit 1 Lehi, UT | 3.0 | 2.5 | 1600 | $2,300 | $1.44 | 16d | 1 | 0.46mi |
| 3664 Big Horn Dr Saratoga Springs, UT | 4.0 | 3.5 | 2293 | $2,450 | $1.07 | 25d | 1 | 0.52mi |
| 1632 N Apache Rd Saratoga Springs, UT | 3.0 | 2.5 | 2262 | $2,195 | $0.97 | 4d | 1 | 0.52mi |
| 3697 W 1380 N Lehi, UT | 3.0 | 2.5 | 2200 | $650 | $0.30 | 25d | 1 | 0.56mi |
| 1449 N 3600 W Lehi, UT | 3.0 | 2.5 | 2402 | $2,195 | $0.91 | 23d | 1 | 0.66mi |
| 1455 N 3600 W Lehi, UT | 4.0 | 2.5 | 2400 | $650 | $0.27 | 25d | 1 | 0.67mi |
| 4050 W 1470 N Lehi, UT | 4.0 | 2.5 | 3360 | $3,000 | $0.89 | 16d | 1 | 0.67mi |
| 246 Bridgewater Ln Unit Bedroom 2 Saratoga Springs, UT | 4.0 | 3.5 | 2680 | $900 | $0.34 | 25d | 1 | 0.69mi |
| 246 E Bridgewater Ln Saratoga Springs, UT | 4.0 | 3.5 | 2680 | $600 | $0.22 | 16d | 1 | 0.69mi |
| 3975 W 1530 N Lehi, UT | 3.0 | 2.0 | 1700 | $1,800 | $1.06 | 4d | 1 | 0.70mi |
| 1621 N 3890 W Lehi, UT | 3.0 | 2.5 | 2296 | $2,195 | $0.96 | 4d | 1 | 0.76mi |
| 1252 N Willowbrook Ln Saratoga Springs, UT | 3.0 | 2.5 | 2655 | $2,400 | $0.90 | 21d | 1 | 0.77mi |
| 3988 W 1650 N Unit Bedroom 2 - Male Lehi, UT | 4.0 | 2.5 | 2350 | $700 | $0.30 | 4d | 1 | 0.80mi |
| 1727 N 3830 W Lehi, UT | 3.0 | 2.5 | 2296 | $2,195 | $0.96 | 4d | 1 | 0.86mi |
| 3904 W Hardman Way Lehi, UT | 4.0 | 3.5 | 2420 | $795 | $0.33 | 25d | 1 | 1.00mi |
| 3952 W Hardman Way Lehi, UT | 3.0 | 3.0 | 2288 | $2,800 | $1.22 | 25d | 1 | 1.00mi |
| 1836 N 3530 W Lehi, UT | 3.0 | 2.5 | 2450 | $2,100 | $0.86 | 25d | 1 | 1.02mi |
| 3985 W 1960 N Unit 3985 Lehi, UT | 3.0 | 2.5 | 2400 | $2,095 | $0.87 | 25d | 1 | 1.02mi |
| 1982 N 3900 W Lehi, UT | 3.0 | 2.5 | 2402 | $2,370 | $0.99 | 23d | 1 | 1.06mi |
| 1990 N 3830 W Unit Bedroom 3 Lehi, UT | 4.0 | 3.5 | 2400 | $700 | $0.29 | 4d | 1 | 1.07mi |
| 2010 N 3930 W Lehi, UT | 3.0 | 2.5 | 2042 | $2,249 | $1.10 | 4d | 1 | 1.08mi |
| 4199 W 2010 N Lehi, UT | 4.0 | 2.5 | 2450 | $825 | $0.34 | 25d | 1 | 1.09mi |
| 4237 W 2010 N Lehi, UT | 4.0 | 2.5 | 1673 | $2,450 | $1.46 | 4d | 1 | 1.09mi |
| 4163 W 2060 N Unit Bedroom 1 Saratoga Springs, UT | 4.0 | 2.5 | 2000 | $900 | $0.45 | 4d | 1 | 1.12mi |
| 2867 W 400 S Lehi, UT | 4.0 | 2.5 | 2944 | $2,695 | $0.92 | 16d | 1 | 1.28mi |
| 4259 W Dixon Way Lehi, UT | 4.0 | 3.5 | 2134 | $2,295 | $1.08 | 4d | 1 | 1.30mi |
| 4286 W Dixon Way Lehi, UT | 4.0 | 3.5 | 2100 | $825 | $0.39 | 21d | 1 | 1.33mi |
| 4316 W Dixon Way Lehi, UT | 4.0 | 3.5 | 2129 | $2,495 | $1.17 | 23d | 1 | 1.33mi |
| 4354 W Dixon Way Lehi, UT | 3.0 | 3.5 | 2000 | $2,195 | $1.10 | 25d | 1 | 1.34mi |
| 2548 N Yarrow Cir Saratoga Springs, UT | 3.0 | 2.5 | 2511 | $2,499 | $1.00 | 25d | 1 | 1.38mi |
| 4380 Bergen Ln Eagle Mountain, UT | 3.0 | 3.0 | 1700 | $2,450 | $1.44 | 25d | 1 | 1.42mi |
| 3668 W 2380 N Lehi, UT | 4.0 | 2.5 | 1800 | $2,175 | $1.21 | 4d | 1 | 1.45mi |
| 2415 N Ribe Ln Lehi, UT | 3.0 | 2.5 | 2633 | $2,800 | $1.06 | 25d | 1 | 1.48mi |
| 1974 N Red Yearling Dr Saratoga Springs, UT | 3.0 | 2.5 | 2100 | $2,495 | $1.19 | 21d | 1 | 1.50mi |
HOA detail
- Monthly dues
- $109 · $1,308/yr
- Likely covers
- gym
Listing history 12 events
-
2026-06-21days on market $449,900 Active 15 DOM
-
2026-06-18days on market $449,900 Active 12 DOM
-
2026-06-17days on market $449,900 Active 11 DOM
-
2026-06-16days on market $449,900 Active 10 DOM
-
2026-06-15days on market $449,900 Active 9 DOM
-
2026-06-14days on market $449,900 Active 7 DOM
-
2026-06-13days on market $449,900 Active 6 DOM
-
2026-06-10days on market $449,900 Active 4 DOM
-
2026-06-09days on market $449,900 Active 3 DOM
-
2026-06-08days on market $449,900 Active 2 DOM
-
2026-06-07remarks 699-char remark
-
2026-06-07$449,900 Active 1 DOM
ⓘ Source: listings_history table (triggers on properties + properties_extension) + one-shot
backfill from property_details.listing_events for pre-trigger history.
Tax reassessment forecast UT · Resets to sale price
- Current annual tax
- $2,029 · $169/mo
- Projected year-2 tax
- $2,969 · $247/mo
- Expected delta
- +$941/yr (+$78/mo · 46.4%)
ⓘ Screening estimate from a state-policy table — verify with the county assessor before closing.
Climate risk First Street
- Flood 1/10 Low FEMA zone X (unshaded) · 0% chance over 30 yrs
- Wildfire 7/10 Severe
- Heat 5/10 Major 8 d/yr ≥93°F today · 23 d/yr by 30 yrs out
- Wind 1/10 Low
- Air quality 2/10 Low 1 unhealthy d/yr today · 2 by 30 yrs out
Nearby sold comps map
Loading sold comps map…
Walkable amenities ~0.75 mi
Loading nearby amenities…
Taxation est. · year 1
- Rental income
- $29,753
- − Mortgage interest
- −$25,201
- − Property taxes
- −$2,029
- − Insurance
- −$2,250
- − Repairs & maintenance
- −$2,380
- − Management
- −$2,380
- − HOA
- −$1,308
- − Depreciation
- −$13,088
- Taxable loss
- −$18,883
- Est. tax savings @ 24.0%
- +$4,532
- After-tax cash flow
- $-5,861/yr
For passive investors: Depreciation is non-cash, so a rental often shows a tax loss while cash-flowing — sheltering income. Rental losses are passive: they offset passive income freely, and up to $25,000/yr can offset ordinary (W-2) income if you actively participate and your MAGI is under $100k (phasing out to $0 by $150k); unused losses carry forward. On sale, claimed depreciation is recaptured at up to 25%, and gains may owe capital-gains tax (a 1031 exchange can defer both). Figures are a year-1 estimate at your 24.0% rate — not tax advice; consult a CPA.
Schools (NCES district)
- District
- Alpine District
- NCES district ID
- 4900030
- Math proficiency
- 45% ▼ -4.00%
- Reading proficiency
- 50% ▼ -2.00%
- Median HH income
- $68,595
- Composite
- 42.48/100
- National rank
- #3213
- State rank
- #25 of 80 in UT
Livability — Lehi
- Score
- 88/100
- State rank
- #6
- US rank
- #242
Category grades
Schools grade is shown separately in the Schools card above.
Census & demographics
- Census place
- Lehi, UT
Population outlook (Utah County) Hauer SSP2
- Today (2025)
- 693,420 people
- By 2030
- 757,324 · +9.2%
- By 2040
- 893,178 · +28.8%
- By 2050
- 1,035,842 · +49.4%
- By 2075
- 1,376,733 · +98.5%
- By 2100
- 1,609,388 · +132.1%
Not yet ingested
- Political lean
- —
- Race & ethnicity
- —
- Common origin
- —
- Civics
- —
Market trends
- HPI YoY
- ▲ 37.66%
- Current HPI
- 262.22
- Rent YoY
- —
- Metro
- —
- State GDP YoY
- ▲ 3.54%
- F500 in state
- 2
Industry mix (Fortune 500 HQ in UT)
| Industry | F500 HQs | Revenue |
|---|---|---|
| Financial Services | 1 | $3B |
|
||
Price history
1 event — show timeline
- 2026-06-07 Listed $449,900 WFRMLS
Property tax history
+17.3%/yrLatest (2025): $2,029 · +3.9% YoY. Source: county tax records.
Cash-flow waterfall
monthlySold comps — $/sqft
last 12 mo · ≤1 miLoading sold comps…