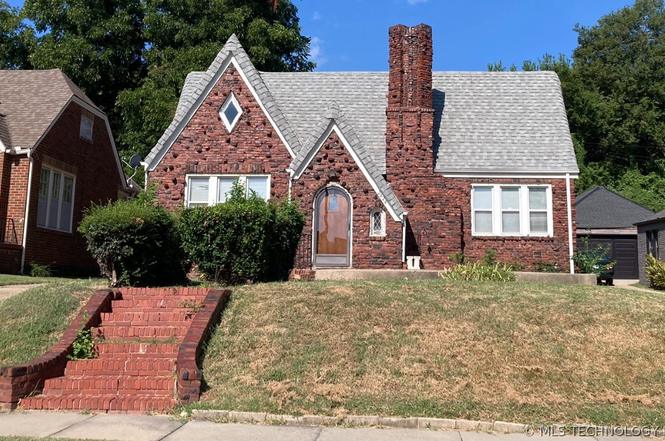
2424 N Boston Ave · Tulsa, OK
Flood risk 1/10 · Minimal
- FEMA flood zone
- X (unshaded)
- Chance of flooding over 30 yrs
- 0.0%
- Est. flood insurance / yr
- $507 – $1,088
Fire risk 5/10 · Moderate
- Est. fire insurance / yr
- $2,463 – $4,575
Heat risk 6/10 · Moderate
- Hot days now (above 110°F)
- 7 days/yr
- Hot days in 30 yrs
- 18 days/yr
Wind risk 3/10 · Minor
- Chance of severe wind over 30 yrs
- 4.0%
Air-quality risk 2/10 · Minimal
- Unhealthy air days now
- 2 days/yr
- Unhealthy air days in 30 yrs
- 2 days/yr
Risk factors via First Street. Map © Google.
Why this score? — see what drove the D+ grade
The composite is a weighted blend of 9 inputs, each scored 0–100. Each bar is that input's sub-score; the figure is the points it added to the 100-point composite (weight × sub-score).
- Cash flow +15.6/30.0
- ARV discount +12.3/15.0
- DSCR +4.8/10.0
- Livability +3.8/5.0
- Rent growth +3.4/5.0
- 1% rule +3.1/10.0
- Appreciation +2.7/10.0
- Condition / age +2.5/5.0
- Schools +0.8/10.0
$175,000
🖨 Deal sheet (PDF) 📄 Offer letter ✓ Due diligence
Listing remarks
READY TO LOVE YOUR LIVING SPACE? COME BROWSE THIS BEAUTIFUL 2 BDRM, 1 BATH HOME TUCKED AWAY IN THE HISTORICAL RESERVOIR HILLS ADDITION WITH ITS MANY UNIQUE FEATURES THAT WARMLY INVITES YOU TO WANT TO CALL THIS HOME. HOUSE SELLING "AS-IS", ENHANCEMENTS COMPLETED BY SELLER WHICH INCLUDES FRESHLY PAINTED INTERIOR THROUGHOUT, RICH WOOD-STAINED FLOORS, ALL HVAC DUCTS AND VENTS REPLACED, UPGRADED TO 3-PRONG ELECTRICAL OUTLETS, SECONDARY ELECTRICAL PANEL INSTALLED, SIX PANEL DOORS ADDED, CEILING FANS REPLACED, FULL KITCHEN RENOVATION WITH NEW APPLIANCES OFFERING A CLEAN, MOVE-IN READY APPEAL. SCHEDULE A SHOWING TODAY!
Key facts
- 7,000 sq ft lot
- Built 1930
- Listed 42 days
Property features AI
Exterior
- Parking: Concrete driveway
- Security: No safety shelter
- Utilities: Electricity available; Natural gas available; Public water; Public sewer
- Home design: Single-story; Faces east; Entry includes basement/crawlspace
- Construction: Brick and wood frame construction; Asphalt fiberglass roof; Basement and crawlspace foundation; Built per public records
- Exterior features: Concrete driveway; No additional exterior features listed
Interior
- Kitchen: Gas oven connection
- Flooring: Carpet; Wood
- Bathrooms: 1 full bathroom
- Heating & cooling: Central heating (gas); Central air conditioning
- Interior features: Laminate counters; Ceiling fan(s); Gas oven connection; Wood window frames; Has fireplace with gas starter; Has basement (crawl space and full)
- Laundry & utility: Washer hookup; Gas dryer hookup; Gas water heater
Neighborhood map
What this means for you Summary
Snapshot
- This is a 2-bed/1.0-bath single-family listed at $175k.
Deal economics
- At list price, monthly cash flow is $74 ($889/yr) — positive.
- The deal already cash-flows at list — no discount required.
- To meet the 1% rule (rent ≥ 1% of price), the offer needs to be $141k (19.4% below list).
- Recommended offer: $141k (19.4% below list) — sets the bar for 1% rule.
- Cap rate 6.8% vs local median 3.8% in Tulsa — top-decile yield for the area; either an underpriced asset or a hidden risk that comps aren't pricing in. Stress-test before assuming the spread holds.
Location & tenants
- Location reads 75/100 on livability (#13 in OK, #4,058 nationally) — a middle-class / working-renter tenant base. Strengths: amenities A+, commute A+, cost of living A+; Watch: crime F, employment D-.
- Tulsa (urban): math 7% / reading 12% proficiency, ranked #250 of 270 in OK (top 93%) — low school quality limits family demand, transient renter base, plan for 1-2y turnover; 76% free/reduced lunch — lower-income household profile, screen leases tightly.
- Zoned schools: Project Accept Traice Es (math 10% / reading 10%, grade F, #695 of 845 statewide, top 84%, 558 students, 0% FRL); Monroe Demonstration Ms (math 0% / reading 2%, grade F, #344 of 345 statewide, top 100%, 688 students, 0% FRL); Booker T. Washington Hs (math 41% / reading 61%, grade D+, #2 of 447 statewide, top 0%, 1,280 students, 0% FRL) — zoned schools average 0% FRL vs 76% district-wide (76 pts lower); this property's tenant base skews higher-income than the district average.
- Market conditions: Rents rising (+3.5%/yr); 137 active listings in the ZIP; 5 comparable units currently listed for rent nearby; rentals at typical pace (median 18d on market — plan ~3-4 weeks tenant-placement turnaround); lower-income renter base — watch delinquency; 2,818 units permitted in Tulsa County in 2024 (518 in 5+ unit buildings).
- This rent runs 41% of the median local income ($41k/yr) — at the standard rent-burdened threshold; future hikes will face affordability resistance.
Forward outlook
- Local home prices are declining (-3.0%/yr); year-one equity from $1k of loan paydown is wiped out by about $5k of value loss. Plan a longer hold.
- Tulsa County population projected at +30% by 2050 — long-run rental-demand tailwind backs the buy-and-hold thesis.
Negotiation context
- It's been on market 42 days — a 3% lower offer ($170k) is reasonable based on typical stale-listing flexibility.
- 3 sale attempts; this cycle's ask is 9% above the opening price — seller raised mid-cycle; expect resistance to lowballs.
Risks & watch-outs
- Watch-outs: built in 1930 — expect roof / HVAC / electrical / plumbing capex.
- Climate carrying-cost: moderate wildfire risk; extreme-heat days projected 7→18/yr by 2055 (HVAC capex compounding) — expect insurance premiums to compound above CPI over the hold.
Questions for the listing agent
- It's been on market 42 days. Have you received any prior offers? Is the seller open to a 19% concession, seller financing, or rate buy-down credit?
- Built in 1930 — when were the roof, HVAC, electrical panel, plumbing, and water heater last replaced?
- Is there a deadline driving the sale (1031 exchange, divorce, estate, relocation)? That informs how much negotiation room exists.
- Schools are F-rated, which usually means shorter tenancies and higher turnover. Who's the typical renter profile here, and what's been the actual vacancy rate?
- Crime grade is F in this area — have there been break-ins, vandalism, or insurance claims at this property in the last 3 years? What carrier currently insures it and at what premium?
- The area grade is low — what's the realistic commute time and amenity access for the typical tenant pool here? Any planned neighborhood developments (good or bad) we should know about?
- What's the average days-on-market for RENTAL listings here right now (not sales)? A rising rental-DOM trend means longer vacancies and softer asking-rent achievability than the comps imply.
- What's the recent tenant-quality profile in this submarket — average credit score on applications, eviction rate, late-payment / NSF rate, and stable-employment percentage? A property-management company in the area should have these aggregated.
- How much new for-sale + rental construction is in the pipeline within 1–3 miles? Heavy new supply typically softens prices + rents 12–24 months out; constrained supply supports both.
Investment metrics
- 1% rule
- 0.81% ✗
- Cap rate
- 6.80%
- Cash-on-cash
- 1.82%
- DSCR
- 1.08
- GRM
- 10.3
CMA / ARV
- ARV (on-the-fly)
- $195,840
- Comps found
- 12
Show comp detail 12 sales within ~0.75 mi
| Address | Dist | Beds/Ba | Sqft | Sold | Price | $/sf | Match |
|---|---|---|---|---|---|---|---|
| 2503 N Boston Pl | 0.15mi | 3/1.0 (+1) | 1,397 (+3%) | 7mo | $130,000 | $93 | 78 |
| 2511 N Boston Ave | 0.13mi | 3/1.5 (+1) | 1,454 (+7%) | 2mo | $155,510 | $107 | 73 |
| 219 E Woodrow Pl | 0.23mi | 3/2.0 (+1) | 1,426 (+5%) | 8mo | $270,000 | $189 | 66 |
| 221 E Woodrow St | 0.28mi | 3/2.0 (+1) | 1,305 (-4%) | 13mo | $238,850 | $183 | 60 |
| 2532 N Martin Luther King Jr Blvd | 0.22mi | 2/2.0 | 1,210 (-11%) | 9mo | $153,000 | $126 | 60 |
| 209 E Xyler St | 0.18mi | 2/1.0 | 1,190 (-12%) | 18mo | $163,000 | $137 | 55 |
| 1966 N Boston Ave | 0.26mi | 3/2.0 (+1) | 1,506 (+11%) | 15mo | $228,000 | $151 | 48 |
| 1546 N Denver Ave | 0.69mi | 2/1.0 | 1,498 (+10%) | 11mo | $215,000 | $144 | 41 |
| 1635 N Boston Ave | 0.56mi | 3/1.0 (+1) | 1,210 (-11%) | 12mo | $128,000 | $106 | 40 |
| 415 E Ute St N | 0.48mi | 3/2.0 (+1) | 1,180 (-13%) | 13mo | $230,000 | $195 | 36 |
| 256 E Tecumseh St | 0.52mi | 3/2.5 (+1) | 1,533 (+13%) | 12mo | $235,000 | $153 | 34 |
| 610 E 27th Pl N | 0.68mi | 3/2.0 (+1) | 1,172 (-14%) | 15mo | $139,900 | $119 | 24 |
Match score weights: distance 35% · size 25% · config 20% · recency 20%. Top-matched comps best support the ARV.
Projected returns pro-forma
-3.0% appreciation · 3.54% rent growth · sell at horizon
- IRR
- -12.9%
- Equity multiple
- 0.53×
- Total profit
- $-22,950
- Equity at exit
- $26,093
- IRR
- -3.3%
- Equity multiple
- 0.77×
- Total profit
- $-11,047
- Equity at exit
- $15,131
Cash invested: $49,000 (down + closing). Projections, not guarantees.
Landlord ↔ Tenant lean methodology
- Overall (STATE)
- 83 Strongly Landlord-Friendly
- State Oklahoma
- 83 Strongly Landlord-Friendly · R+20
- County
- — inherits STATE
- City
- — inherits STATE
ZIP-level market 74106
- Home prices YoY
- -2.5%
- Rents YoY
- 3.5%
- Active inventory
- 137
- Price-to-rent
- 10.3×
Monthly cashflow live
- Estimated rent
- $1,410 high interval (Pro) →
- Mortgage (P&I)
- −$918
- Tax from tax record
- −$49 /mo · $591/yr
- Insurance
- −$73
- HOA
- −$0
- Vacancy / Maint / Mgmt
- −$296
- Net cashflow
- $74
Break-even live
Sensitivity live
| Price | -10% $173 | -5% $124 | +0% $74 | +5% $25 | +10% $-25 |
|---|---|---|---|---|---|
| Rent | -10% $-37 | -5% $18 | +0% $74 | +5% $130 | +10% $186 |
| Rate | -1.0pp $162 | -0.5pp $119 | base $74 | +0.5pp $29 | +1.0pp $-17 |
UW: 25.0% down · 7.5% · 30yr · 1.5% tax · 5.0% vac · 8.0% maint · 8.0% mgmt
Financing live
Cash to close
- Down payment
- $43,750
- Closing costs
- $5,250
- Reserves months
- —
- Total cash needed
- —
Loan-product check · same deal, 3 products live
Conventional
25% down · 7.5% · 30yr
- Down + closing
- —
- Monthly P&I
- —
- Monthly cashflow
- —
- DSCR
- —
- Eligible?
- —
Personal DTI + credit; lowest rate.
DSCR
20% down · 8.5% · 30yr
- Down + closing
- —
- Monthly P&I
- —
- Monthly cashflow
- —
- DSCR
- —
- Eligible?
- —
No personal income docs; deal must DSCR.
Hard money
10% down · 12.0% · 12mo
- Down + closing
- —
- Monthly P&I
- —
- Monthly cashflow
- —
- DSCR
- —
- Eligible?
- —
Short-term bridge; refi at stabilization.
Rent comps 5 comps
| Address | Beds | Baths | Sqft | Rent | $/sqft | DOM | Units | Dist |
|---|---|---|---|---|---|---|---|---|
| 238 E Young Pl Unit A Tulsa, OK | 3.0 | 2.0 | 1020 | $1,550 | $1.52 | 18d | 1 | 0.23mi |
| 238 E Young Pl Unit B Tulsa, OK | 3.0 | 2.0 | 1000 | $1,700 | $1.70 | 25d | 1 | 0.23mi |
| 245 E Young Pl Tulsa, OK | 3.0 | 2.0 | 1528 | $1,450 | $0.95 | 18d | 1 | 0.26mi |
| 613 E Xyler St Tulsa, OK | 1.0 | 1.0 | 1392 | $875 | $0.63 | 18d | 1 | 0.56mi |
| 205 E Marshall St Tulsa, OK | 3.0 | 2.0 | 1452 | $1,725 | $1.19 | 25d | 1 | 1.13mi |
Listing history 22 events
-
2026-06-22days on market $175,000 Active 42 DOM
-
2026-06-18days on market $175,000 Active 39 DOM
-
2026-06-17days on market $175,000 Active 38 DOM
-
2026-06-16days on market $175,000 Active 37 DOM
-
2026-06-15days on market $175,000 Active 36 DOM
-
2026-06-13days on market $175,000 Active 34 DOM
-
2026-06-10days on market $175,000 Active 31 DOM
-
2026-06-09days on market $175,000 Active 30 DOM
-
2026-06-08days on market $175,000 Active 29 DOM
-
2026-06-07days on market $175,000 Active 28 DOM
-
2026-06-05days on market $175,000 Active 25 DOM
-
2026-06-03days on market $175,000 Active 24 DOM
-
2026-06-02days on market $175,000 Active 23 DOM
-
2026-06-01days on market $175,000 Active 22 DOM
-
2026-05-31days on market $175,000 Active 21 DOM
-
2026-05-23price $175,000
-
2026-05-17status Active
-
2026-03-19historical
-
2026-03-10$160,000 Active
-
2026-02-22historical
-
2025-10-25price $160,000
-
2025-08-23$165,000 Active
ⓘ Source: listings_history table (triggers on properties + properties_extension) + one-shot
backfill from property_details.listing_events for pre-trigger history.
Tax reassessment forecast OK · Resets to sale price
- Current annual tax
- $591 · $49/mo
- Projected year-2 tax
- $1,575 · $131/mo
- Expected delta
- +$984/yr (+$82/mo · 166.5%)
ⓘ Screening estimate from a state-policy table — verify with the county assessor before closing.
Climate risk First Street
- Flood 1/10 Low FEMA zone X (unshaded) · 0% chance over 30 yrs
- Wildfire 5/10 Major
- Heat 6/10 Major 7 d/yr ≥110°F today · 18 d/yr by 30 yrs out
- Wind 3/10 Moderate 4% chance of damaging wind over 30 yrs
- Air quality 2/10 Low 2 unhealthy d/yr today · 2 by 30 yrs out
Nearby sold comps map
Loading sold comps map…
Walkable amenities ~0.75 mi
Loading nearby amenities…
Taxation est. · year 1
- Rental income
- $16,922
- − Mortgage interest
- −$9,803
- − Property taxes
- −$591
- − Insurance
- −$875
- − Repairs & maintenance
- −$1,354
- − Management
- −$1,354
- − Depreciation
- −$5,091
- Taxable loss
- −$2,146
- Est. tax savings @ 24.0%
- +$515
- After-tax cash flow
- $1,404/yr
For passive investors: Depreciation is non-cash, so a rental often shows a tax loss while cash-flowing — sheltering income. Rental losses are passive: they offset passive income freely, and up to $25,000/yr can offset ordinary (W-2) income if you actively participate and your MAGI is under $100k (phasing out to $0 by $150k); unused losses carry forward. On sale, claimed depreciation is recaptured at up to 25%, and gains may owe capital-gains tax (a 1031 exchange can defer both). Figures are a year-1 estimate at your 24.0% rate — not tax advice; consult a CPA.
Schools (NCES district)
- District
- Tulsa
- NCES district ID
- 4030240
- Math proficiency
- 7% ▼ -9.00%
- Reading proficiency
- 12% ▼ -7.00%
- Median HH income
- $37,895
- Composite
- 8.04/100
- National rank
- #9919
- State rank
- #250 of 270 in OK
Livability — Tulsa
- Score
- 75/100
- State rank
- #13
- US rank
- #4058
Category grades
Schools grade is shown separately in the Schools card above.
Census & demographics
- Census place
- Tulsa, OK
- County
- Tulsa County · 640,811 people
- City population
- 389,418
- Metro
- Tulsa, OK
- Population (ZIP)
- 15,655
- Household income
- $40,776
- Rent vs Own
- Severe rent burden
- 1055.0
Population outlook (Tulsa County) Hauer SSP2
- Today (2025)
- 723,846 people
- By 2030
- 766,033 · +5.8%
- By 2040
- 851,386 · +17.6%
- By 2050
- 938,389 · +29.6%
- By 2075
- 1,166,011 · +61.1%
- By 2100
- 1,350,277 · +86.5%
Race, ethnicity, and origin ACS 2023
- Neighborhood character
- Diverse neighborhood (Simpson 0.65)
- Race & ethnicity
- Black 55% White 17% Hispanic / Latino 14% Two or more races 13% Native American 4%
- Hispanic origin (detail)
- Mexican 11%
- Common ancestry
- Romanian 1% Serbian 1% Lithuanian 1%
- Foreign-born
- 5% · Canada
- Languages at home
- 87% English-only · Spanish 10% German/W. Germanic 1%
Political lean MEDSL · Tulsa
- 2024 margin
- R (+15.2) · D 41.3% · R 56.5% · Other 2.2%
- 2008→2024 swing
- +9.2pp toward D · 2008: -24.5pp · 2024: -15.2pp
- All cycles
- 2024: R+15.2 2020: R+15.6 2016: R+22.9 2012: R+27.4 2008: R+24.5
Not yet ingested
- Civics
- —
Market trends
- HPI YoY
- ▼ -4.58%
- Current HPI
- 179.5268
- Rent YoY
- ▲ 3.54%
- Metro
- Tulsa, OK
- State GDP YoY
- ▲ 1.55%
- F500 in state
- 6
Industry mix (Fortune 500 HQ in OK)
| Industry | F500 HQs | Revenue |
|---|---|---|
| Energy | 3 | $48B |
|
||
Price history
+6.1% since first listed7 events — show timeline
- 2026-05-23 Price Changed $175,000 MLS Technology, Inc.
- 2026-05-17 Relisted — MLS Technology, Inc.
- 2026-03-19 Listing Removed — MLS Technology, Inc.
- 2026-03-10 Listed $160,000 MLS Technology, Inc.
- 2026-02-22 Listing Removed — MLS Technology, Inc.
- 2025-10-25 Price Changed $160,000 MLS Technology, Inc.
- 2025-08-23 Listed $165,000 MLS Technology, Inc.
Property tax history
+1.1%/yrLatest (2025): $591 · +3.5% YoY. Source: county tax records.
Cash-flow waterfall
monthlySold comps — $/sqft
last 12 mo · ≤1 miLoading sold comps…