106 E Main St · Industry, IL
Flood risk 1/10 · Minimal
- FEMA flood zone
- X
- Chance of flooding over 30 yrs
- 0.0%
- Est. flood insurance / yr
- $507 – $1,088
Fire risk 1/10 · Minimal
- Est. fire insurance / yr
- $804 – $1,492
Heat risk 3/10 · Minor
- Hot days now (above 107°F)
- 7 days/yr
- Hot days in 30 yrs
- 18 days/yr
Wind risk 2/10 · Minimal
- Chance of severe wind over 30 yrs
- 0.0%
Air-quality risk 2/10 · Minimal
- Unhealthy air days now
- 0 days/yr
- Unhealthy air days in 30 yrs
- 1 days/yr
Risk factors via First Street. Map © Google.
Why this score? — see what drove the C- grade
The composite is a weighted blend of 9 inputs, each scored 0–100. Each bar is that input's sub-score; the figure is the points it added to the 100-point composite (weight × sub-score).
- Cash flow +21.0/30.0
- ARV discount +7.5/15.0
- DSCR +6.7/10.0
- Appreciation +4.8/10.0
- 1% rule +4.5/10.0
- Livability +3.2/5.0
- Rent growth +2.5/5.0
- Condition / age +2.5/5.0
- Schools +1.3/10.0
$112,500
🖨 Deal sheet (PDF) 📄 Offer letter ✓ Due diligence
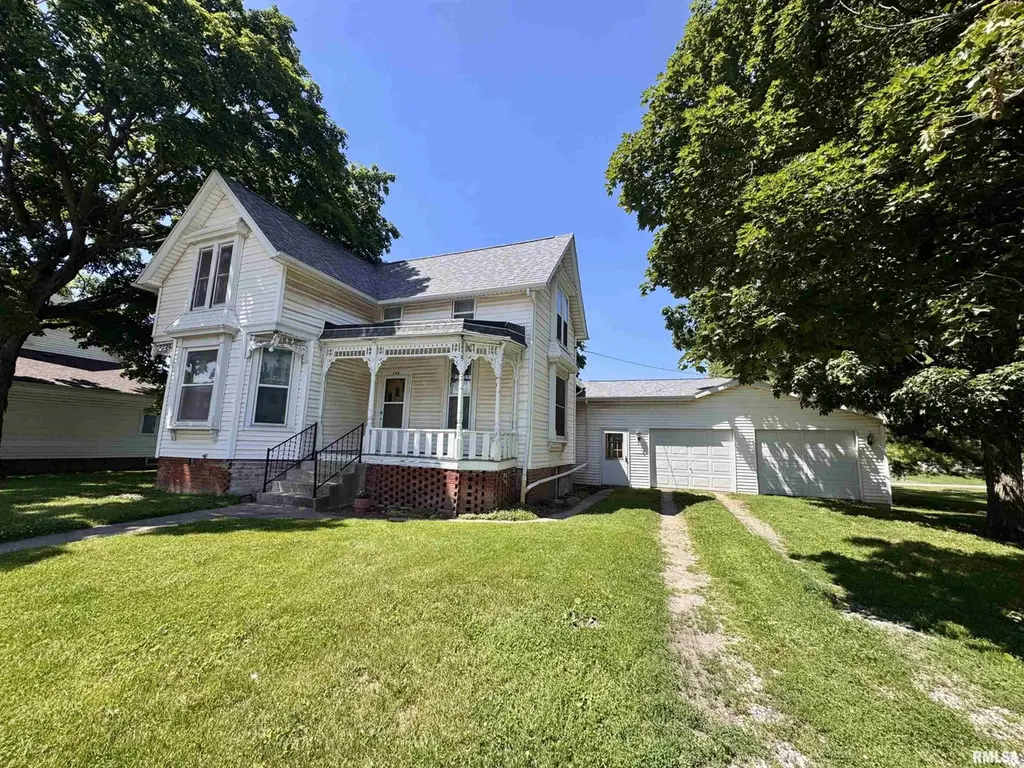
Listing remarks
This four-bedroom home, located close to downtown Industry, offers just over 2300 sq ft of living space. The main level of this home has a large living room, a front family living room with a walkout to a covered front porch, a bedroom with built-in shelving, and an attached full bath. The kitchen is large, with ample cabinetry and an attached dining area. This area has a walkout to a large mudroom, which leads to the attached oversized two-car garage, backyard patio, or a stairway to the home's basement. The upper level of the home has three bedrooms, original to the home; these rooms have great space, and one has a large walk-in attic storage area. The basement is unfinished, but it offer
Key facts
- Covered front porch
- Backyard patio
- Ample cabinetry
Tags
Property features AI
Exterior
- Parking: Attached oversized 2-car garage
- Utilities: Public water; Public sewer
- Home design: Single-family residence; Two levels
- Construction: Built in 1920
- Exterior features: Shingle roof; Sloped lot; Paved road access
Interior
- Kitchen: Refrigerator
- Bedrooms: 4 bedrooms with egress windows; Bedroom sizes include approx. 13.02 x 9.03 (main), 13.04 x 11.06 (upper), 13.04 x 9.06 (main), 13.04 x 12.01 (upper)
- Flooring: Carpet in most bedrooms and living/family rooms; Laminate in dining room, kitchen and mudroom
- Bathrooms: 1 full bathroom
- Heating & cooling: Forced air heating; Central air conditioning
- Interior features: Unfinished basement; High-efficiency heating
- Laundry & utility: Washer and dryer
Neighborhood map
What this means for you Summary
Snapshot
- This is a 4-bed/1.0-bath single-family listed at $112k.
Deal economics
- At list price, monthly cash flow is $159 ($2k/yr) — positive.
- The deal already cash-flows at list — no discount required.
- To meet the 1% rule (rent ≥ 1% of price), the offer needs to be $107k (4.7% below list).
- Recommended offer: $107k (4.7% below list) — sets the bar for 1% rule.
Location & tenants
- Location reads 63/100 on livability (#781 in IL) — a middle-class / working-renter tenant base. Strengths: cost of living A+, housing A+; Watch: health & safety C-, crime D-, amenities F.
- Schuyler-Industry CUSD 5 (town): math 13% / reading 15% proficiency, ranked #522 of 620 in IL (top 84%) — low school quality limits family demand, transient renter base, plan for 1-2y turnover.
- Zoned schools: Washington Elem School (206 students, 0% FRL); Schuyler Industry Middle School (math 8% / reading 11%, grade F, #597 of 665 statewide, top 91%, 272 students, 0% FRL); Rushville-Industry High School (math 17% / reading 27%, grade F, #319 of 693 statewide, top 50%, 283 students, 0% FRL) — zoned schools average 0% FRL vs 39% district-wide (39 pts lower); this property's tenant base skews higher-income than the district average.
- Market conditions: 3 active listings in the ZIP.
Forward outlook
- In year one you build about $403 of equity ($778 loan paydown + $-375 appreciation (-0.3% local appreciation)).
- At projected returns (-0.3% appreciation + 3.0% rent growth), your $32k cash investment doubles in ~9 years — after that, you're playing with house money.
Negotiation context
- It's been on market 25 days — a 2% lower offer ($111k) is reasonable based on typical stale-listing flexibility.
Risks & watch-outs
- Watch-outs: built in 1920 — expect roof / HVAC / electrical / plumbing capex.
Questions for the listing agent
- Built in 1920 — when were the roof, HVAC, electrical panel, plumbing, and water heater last replaced?
- Is there a deadline driving the sale (1031 exchange, divorce, estate, relocation)? That informs how much negotiation room exists.
- Schools are D-rated, which usually means shorter tenancies and higher turnover. Who's the typical renter profile here, and what's been the actual vacancy rate?
- Crime grade is D in this area — have there been break-ins, vandalism, or insurance claims at this property in the last 3 years? What carrier currently insures it and at what premium?
- What's the average days-on-market for RENTAL listings here right now (not sales)? A rising rental-DOM trend means longer vacancies and softer asking-rent achievability than the comps imply.
- What's the recent tenant-quality profile in this submarket — average credit score on applications, eviction rate, late-payment / NSF rate, and stable-employment percentage? A property-management company in the area should have these aggregated.
- How much new for-sale + rental construction is in the pipeline within 1–3 miles? Heavy new supply typically softens prices + rents 12–24 months out; constrained supply supports both.
Investment metrics
- 1% rule
- 0.95% ✗
- Cap rate
- 7.99%
- Cash-on-cash
- 6.05%
- DSCR
- 1.27
- GRM
- 8.7
CMA / ARV
No comps found within radius.
Projected returns pro-forma
-0.33% appreciation · 3.0% rent growth · sell at horizon
- IRR
- 3.4%
- Equity multiple
- 1.16×
- Total profit
- $5,032
- Equity at exit
- $30,803
- IRR
- 9.1%
- Equity multiple
- 1.95×
- Total profit
- $30,057
- Equity at exit
- $35,571
Cash invested: $31,500 (down + closing). Projections, not guarantees.
Landlord ↔ Tenant lean methodology
- Overall (STATE)
- 43 Moderately Tenant-Leaning
- State Illinois
- 43 Moderately Tenant-Leaning · D+7
- County
- — inherits STATE
- City
- — inherits STATE
ZIP-level market 61440
- Home prices YoY
- -0.3%
- Active inventory
- 3
- Price-to-rent
- 8.7×
Monthly cashflow live
- Estimated rent
- $1,072 medium interval (Pro) →
- Mortgage (P&I)
- −$590
- Tax from tax record
- −$51 /mo · $613/yr
- Insurance
- −$47
- HOA
- −$0
- Vacancy / Maint / Mgmt
- −$225
- Net cashflow
- $159
Break-even live
Sensitivity live
| Price | -10% $222 | -5% $191 | +0% $159 | +5% $127 | +10% $95 |
|---|---|---|---|---|---|
| Rent | -10% $74 | -5% $116 | +0% $159 | +5% $201 | +10% $243 |
| Rate | -1.0pp $215 | -0.5pp $187 | base $159 | +0.5pp $130 | +1.0pp $100 |
UW: 25.0% down · 7.5% · 30yr · 1.5% tax · 5.0% vac · 8.0% maint · 8.0% mgmt
Financing live
Cash to close
- Down payment
- $28,125
- Closing costs
- $3,375
- Reserves months
- —
- Total cash needed
- —
Loan-product check · same deal, 3 products live
Conventional
25% down · 7.5% · 30yr
- Down + closing
- —
- Monthly P&I
- —
- Monthly cashflow
- —
- DSCR
- —
- Eligible?
- —
Personal DTI + credit; lowest rate.
DSCR
20% down · 8.5% · 30yr
- Down + closing
- —
- Monthly P&I
- —
- Monthly cashflow
- —
- DSCR
- —
- Eligible?
- —
No personal income docs; deal must DSCR.
Hard money
10% down · 12.0% · 12mo
- Down + closing
- —
- Monthly P&I
- —
- Monthly cashflow
- —
- DSCR
- —
- Eligible?
- —
Short-term bridge; refi at stabilization.
Listing history 19 events
-
2026-06-22days on market $112,500 Active 25 DOM
-
2026-06-21days on market $112,500 Active 24 DOM
-
2026-06-19days on market $112,500 Active 22 DOM
-
2026-06-18days on market $112,500 Active 21 DOM
-
2026-06-17days on market $112,500 Active 20 DOM
-
2026-06-16days on market $112,500 Active 19 DOM
-
2026-06-15days on market $112,500 Active 18 DOM
-
2026-06-14days on market $112,500 Active 16 DOM
-
2026-06-12days on market $112,500 Active 15 DOM
-
2026-06-09days on market $112,500 Active 12 DOM
-
2026-06-08days on market $112,500 Active 11 DOM
-
2026-06-07days on market $112,500 Active 10 DOM
-
2026-06-07days on market $112,500 Active 9 DOM
-
2026-06-04days on market $112,500 Active 6 DOM
-
2026-06-02days on market $112,500 Active 5 DOM
-
2026-06-01days on market $112,500 Active 4 DOM
-
2026-05-31days on market $112,500 Active 3 DOM
-
2026-05-31days on market $112,500 Active 2 DOM
-
2026-05-27$112,500 Active
ⓘ Source: listings_history table (triggers on properties + properties_extension) + one-shot
backfill from property_details.listing_events for pre-trigger history.
Tax reassessment forecast IL · Partial reset (capped growth)
- Current annual tax
- $613 · $51/mo
- Projected year-2 tax
- $1,583 · $132/mo
- Expected delta
- +$971/yr (+$81/mo · 158.4%)
ⓘ Screening estimate from a state-policy table — verify with the county assessor before closing.
Climate risk First Street
- Flood 1/10 Low FEMA zone X · 0% chance over 30 yrs
- Wildfire 1/10 Low
- Heat 3/10 Moderate 7 d/yr ≥107°F today · 18 d/yr by 30 yrs out
- Wind 2/10 Low 0% chance of damaging wind over 30 yrs
- Air quality 2/10 Low 0 unhealthy d/yr today · 1 by 30 yrs out
Nearby sold comps map
Loading sold comps map…
Walkable amenities ~0.75 mi
Loading nearby amenities…
Taxation est. · year 1
- Rental income
- $12,861
- − Mortgage interest
- −$6,302
- − Property taxes
- −$613
- − Insurance
- −$562
- − Repairs & maintenance
- −$1,029
- − Management
- −$1,029
- − Depreciation
- −$3,273
- Taxable income
- $54
- Est. tax owed @ 24.0%
- −$13
- After-tax cash flow
- $1,893/yr
For passive investors: Depreciation is non-cash, so a rental often shows a tax loss while cash-flowing — sheltering income. Rental losses are passive: they offset passive income freely, and up to $25,000/yr can offset ordinary (W-2) income if you actively participate and your MAGI is under $100k (phasing out to $0 by $150k); unused losses carry forward. On sale, claimed depreciation is recaptured at up to 25%, and gains may owe capital-gains tax (a 1031 exchange can defer both). Figures are a year-1 estimate at your 24.0% rate — not tax advice; consult a CPA.
Schools (NCES district)
- District
- Schuyler-Industry CUSD 5
- NCES district ID
- 1700332
- Math proficiency
- 13% ▼ -8.00%
- Reading proficiency
- 15% ▼ -10.00%
- Median HH income
- $46,367
- Composite
- 12.59/100
- National rank
- #9616
- State rank
- #522 of 620 in IL
Livability — Industry
- Score
- 63/100
- State rank
- #781
- US rank
- #15594
Category grades
Schools grade is shown separately in the Schools card above.
Census & demographics
- Census place
- Industry, IL
- Population (ZIP)
- 734
Population outlook (McDonough County) Hauer SSP2
- Today (2025)
- 33,242 people
- By 2030
- 33,318 · +0.2%
- By 2040
- 33,520 · +0.8%
- By 2050
- 33,630 · +1.2%
- By 2075
- 33,657 · +1.2%
- By 2100
- 33,127 · -0.3%
Race, ethnicity, and origin ACS 2023
- Neighborhood character
- Predominantly White (96%)
- Race & ethnicity
- White 96% Two or more races 3%
- Common ancestry
- Italian 2% Slovak 1% Iranian 1%
- Foreign-born
- 0%
- Languages at home
- 97% English-only · Other Asian/Pacific 1% German/W. Germanic 1% French/Haitian/Cajun 1%
Political lean MEDSL · McDonough
- 2024 margin
- R (+18.9) · D 39.7% · R 58.5% · Other 1.8%
- 2008→2024 swing
- -24.4pp toward R · 2008: 5.6pp · 2024: -18.9pp
- All cycles
- 2024: R+18.9 2020: R+16.6 2016: R+11.7 2012: R+1.5 2008: D+5.6
Not yet ingested
- Civics
- —
Market trends
- HPI YoY
- ▼ -0.33%
- Current HPI
- 111.2542
- Rent YoY
- —
- Metro
- —
- State GDP YoY
- ▲ 1.59%
- F500 in state
- 60
Industry mix (Fortune 500 HQ in IL)
| Industry | F500 HQs | Revenue |
|---|---|---|
| Insurance | 4 | $201B |
|
||
| Consumer Goods | 4 | $87B |
|
||
| Industrial Machinery | 3 | $64B |
|
||
| Healthcare | 2 | $55B |
|
||
| Retail / Pharmacy | 1 | $148B |
|
||
| Agriculture / Food | 1 | $86B |
|
||
Price history
1 event — show timeline
- 2026-05-27 Listed $112,500 RMLSA as Distributed by MLS Grid
Property tax history
+1.5%/yrLatest (2024): $613 · +10.4% YoY. Source: county tax records.
Cash-flow waterfall
monthlySold comps — $/sqft
last 12 mo · ≤1 miLoading sold comps…